The number of bottles of cold drinks sold by a shopkeeper on six consecutive days is as follows:

Prepare a pictograph of the above data using an appropriate symbol
Step by step video & image solution for The number of bottles of cold drinks sold by a shopkeeper on six consecutive days is as follows: Prepare a pictograph of the above data using an appropriate symbol by Maths experts to help you in doubts & scoring excellent marks in Class 6 exams.
Updated on:21/07/2023Topper's Solved these Questions
Similar Questions
The number of Mathematics books sold by a shopkeeper on six consecutive days is shown below Draw a bar graph to represent the above information choosing the scale of your choice.
View SolutionThe number of Mathematics books sold by a shopkeeper on six consecutive days is shown below :
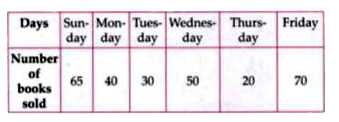
Draw a bar graph to represent the above information choosing the scale of your choice.
View SolutionAnnual expenditure of a company in the year 2007-2008 is given below:
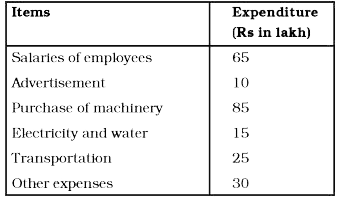
Prepare a pictograph of the above data using an appropriate symbol to represent Rs 10 lakh.
View SolutionThe following bar graph represents the number of cold drink bottles sold by a shopkeeper on six consecutive days.
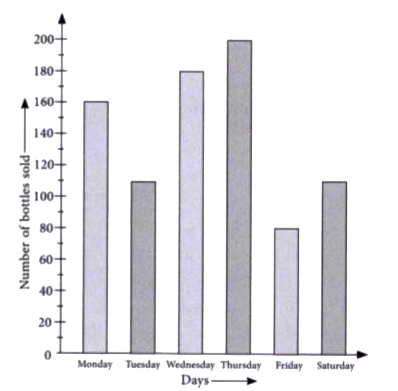
Find the total number of cold drink bottles sold in six days.
View SolutionThe following bar graph represents the number of cold drink bottles sold by a shopkeeper on six consecutive days.
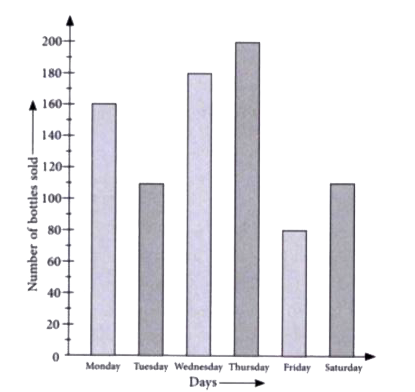
On which two days same number of bottles were sold?
View SolutionThe following table gives information about the circulation of newspapers (dailies) in a town in five languages.

Prepare a pictograph of the above data, using a symbol of your choice, each representing 1000 newspapers.
View SolutionThe following bar graph represents the number of cold drink bottles sold by a shopkeeper on six consecutive days.
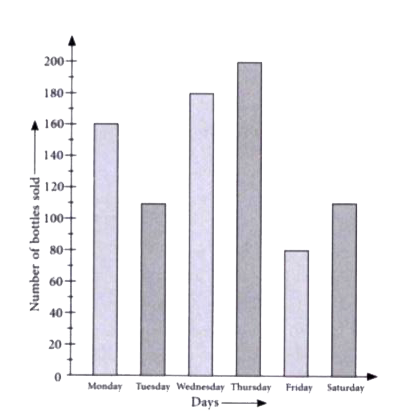
On which day minimum number of bottles were sold?
View SolutionTotal number of students of a school in different years is shown in the following table.
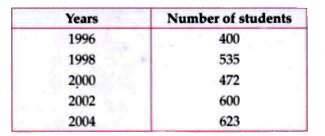
Prepare another pictograph of students using any other symbol each representing 50 students. Which pictograph do you find more informative ?
View SolutionTotal number of animals in five villages are as follows: Village, Number of animals A B C D E, 80 120 90 40 60 Prepare a pictograph of these animals using one symbol to represent 10 animals.
View SolutionThe table below gives the data of tourists visiting 5 hill stations over two consecutive years. Study the table and answer the questions that follow:

(a) Draw a double bar graph to depict the above information using appropriate scale.
(b) Which hill station was visited by the maximum number of tourists in 2008?
(c) Which hill station was visited by the least number of tourists in 2009?
(d) In which hill stations was there increase in number of tourists in the year 2009?
View Solution
