The number of hours, spent by a school boy on different activities in a working day, is given below: Activities, Sleep, School, Home, Play, others, Total No. Of hours, 8, 7, 4, 2, 3, 24 Present the information in the form of a pie-chart.
To present the information in the form of a pie chart, we need to follow these steps:
Step 1: Understand the Data
We have the following activities and the number of hours spent on each:
- Sleep: 8 hours
- School: 7 hours
- Home: 4 hours
- Play: 2 hours
- Others: 3 hours
- Total: 24 hours
Step 2: Calculate the Angle for Each Activity
The total number of hours in a day is 24, which corresponds to a full circle of 360 degrees. To find the angle for each activity, we use the formula:
Angle=(Hours for ActivityTotal Hours)×360
Now, we will calculate the angle for each activity:
1. Sleep:
Angle for Sleep=(824)×360=120 degrees
2. School:
Angle for School=(724)×360=105 degrees
3. Home:
Angle for Home=(424)×360=60 degrees
4. Play:
Angle for Play=(224)×360=30 degrees
5. Others:
Angle for Others=(324)×360=45 degrees
Step 3: Draw the Pie Chart
1. Start by drawing a circle.
2. From the center of the circle, draw a line to represent the first activity (Others) at 45 degrees.
3. Next, draw the line for Play at 30 degrees from the end of the Others section.
4. Then, draw the line for Home at 60 degrees from the end of the Play section.
5. After that, draw the line for School at 105 degrees from the end of the Home section.
6. Finally, draw the line for Sleep at 120 degrees from the end of the School section.
Step 4: Label the Sections
Label each section of the pie chart with the activity name and the corresponding angle.
Final Pie Chart Summary:
- Sleep: 120 degrees
- School: 105 degrees
- Home: 60 degrees
- Play: 30 degrees
- Others: 45 degrees
We have the following activities and the number of hours spent on each:
- School: 7 hours
- Home: 4 hours
- Play: 2 hours
- Others: 3 hours
- Total: 24 hours
The total number of hours in a day is 24, which corresponds to a full circle of 360 degrees. To find the angle for each activity, we use the formula:
Angle for Sleep=(824)×360=120 degrees
Angle for School=(724)×360=105 degrees
Angle for Home=(424)×360=60 degrees
Angle for Play=(224)×360=30 degrees
Angle for Others=(324)×360=45 degrees
1. Start by drawing a circle.
2. From the center of the circle, draw a line to represent the first activity (Others) at 45 degrees.
3. Next, draw the line for Play at 30 degrees from the end of the Others section.
4. Then, draw the line for Home at 60 degrees from the end of the Play section.
5. After that, draw the line for School at 105 degrees from the end of the Home section.
6. Finally, draw the line for Sleep at 120 degrees from the end of the School section.
Label each section of the pie chart with the activity name and the corresponding angle.
- Sleep: 120 degrees
- School: 105 degrees
- Home: 60 degrees
- Play: 30 degrees
- Others: 45 degrees
Topper's Solved these Questions
Similar Questions
The number of hours spent by a school boy in different activities in a day is given below:

Represent the above information using pie diagram.
View SolutionThe number of hours spent by a school boy in different activities in a day is given below :

Represent the above information using a pie diagram.
View Solution
Knowledge Check
A pie diagram represents the number of hours spent by a school boy in different activites in a day. If 7 hours are spent in school, then what is the measure of the central angle?
A210∘B105∘C52.5∘D90∘The pie Chart given below presents the number of laptops as a percentage of the total number of laptops in an office delivered by six different companies.
The central angles shown in the Pie Chart are not as any chosen scale.
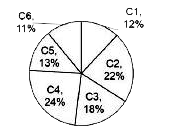
If the total number of laptops in the office is 3800, then what is the difference in number of laptops of Companies C2 and C5 ?A342B282C242D362
A person spends his time every day as shown below :
¯¯¯¯¯¯¯¯¯¯¯¯¯¯¯¯¯¯¯¯¯¯¯¯¯¯¯¯¯¯¯¯¯¯¯¯¯¯¯¯¯¯¯¯¯¯¯¯¯¯¯¯¯¯¯¯¯¯¯¯¯¯¯¯¯¯¯¯¯¯¯¯¯¯¯¯¯¯¯¯¯¯¯¯¯¯¯¯¯¯¯¯¯¯¯¯¯¯¯¯¯¯¯¯¯¯¯¯¯¯¯¯¯¯¯¯¯¯¯¯¯¯¯¯¯¯¯¯¯¯¯¯¯¯¯¯¯¯Activity Study Games Yoga and Sleeping Miscellaneous DanceNumber of hours 9 3 3 7 2 ––––––––––––––––––––––––––––––––––––––––––––––––––––––––––––––––––––––––––––––––––––––––––
Present the data in pie chart.
View SolutionThe pie-chart given below shows the number of students enrolled in a school in different activities. Total number of students in the school is 1200. Study the chart and answer the questions.
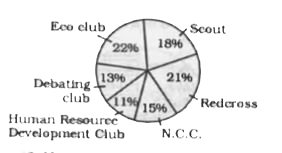
Which two clubs have the enrolment in the ratio of 2:1 ?
View SolutionThe pie-chart given below shows the number of students enrolled in a school in different activities. Total number of students in the school is 1200. Study the chart and answer the questions.
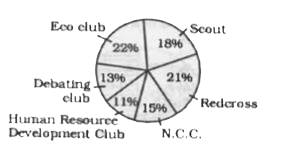
What is the ratio of number of students enrolled in Scout and Redcross activities together to those enrolled in Debating Club activities ?
View SolutionThe pie-chart given below shows the number of students enrolled in a school in different activities. Total number of students in the school is 1200. Study the chart and answer the questions.
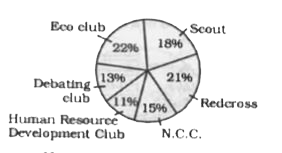
The number of students enrolled in Eco-club is what per cent of those enrolled in Redcross activities ?
View SolutionThe pie-chart given below shows the number of students enrolled in a school in different activities. Total number of students in the school is 1200. Study the chart and answer the questions.
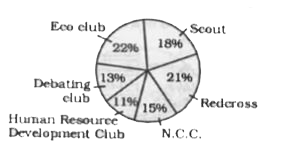
What is the total number of students enrolled in Debating Club and HRD Club ?
View SolutionThe pie-chart given below shows the number of students enrolled in a school in different activities. Total number of students in the school is 1200. Study the chart and answer the questions.
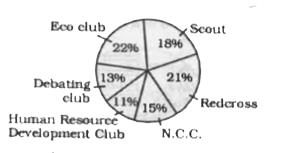
How many students are enrolled in N.C.C. activities ?
View Solution
