The runs scored by a cricket team in first 15 overs are given below: Overs, I, II, III, IV, V, VI, VII, VIII, IX, X, XI, XII, XIII, XIV, XV Runs:, 2, 1, 4, 2, 6, 8, 10, 21, 5, 8, 3, 2, 6, 8, 12 Draw the graph representing the above data in two different ways as a graph and as a bar chart.
Step by step video & image solution for The runs scored by a cricket team in first 15 overs are given below: Overs, I, II, III, IV, V, VI, VII, VIII, IX, X, XI, XII, XIII, XIV, XV Runs:, 2, 1, 4, 2, 6, 8, 10, 21, 5, 8, 3, 2, 6, 8, 12 Draw the graph representing the above data in two different ways as a graph and as a bar chart. by Maths experts to help you in doubts & scoring excellent marks in Class 8 exams.
Updated on:21/07/2023Topper's Solved these Questions
Similar Questions
The runs scored by two teams A and B in first 10 overs are given below: Overs, I, II, III, IV, V, VI, VII, VIII, IX, X Team A:, 2, 1, 8, 9, 4, 5, 6, 10, 6, 2 Team B:, 5, 6, 2, 10, 5, 6, 3, 4, 8, 10 Draw a graph depicting the data, making the graphs on the same axes in each case in two different ways as a graph and as a bar chart.
View SolutionThe runs scored by a cricket team in first 10 over are given below:

Draw a graph depicting the data
View Solution
Knowledge Check
The range of the data 9, 8, 4, 3, 2, 1, 6, 4, 8, 10, 12, 15, 4, 3 is
A15B14C12D10
The runs scored by a cricket team in first 10 overs are given below:

Draw a line graph representing the above data.
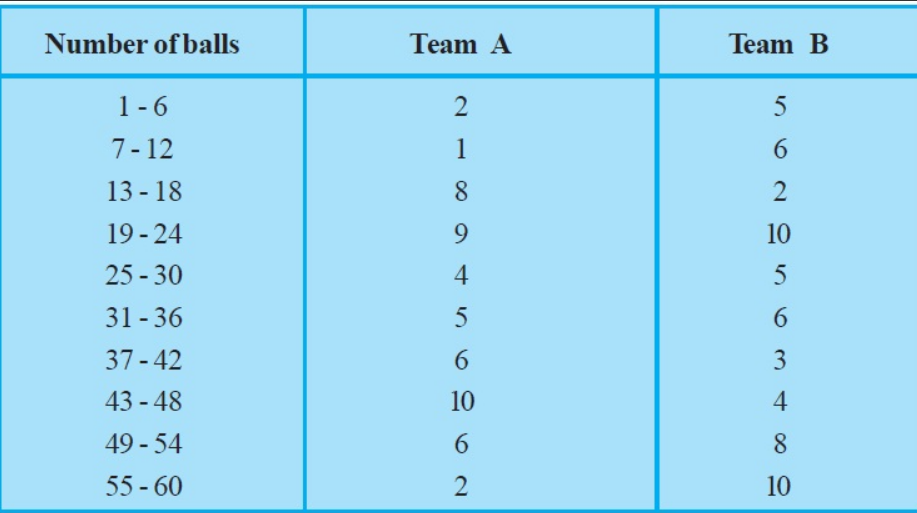
View SolutionThe runs scored by two teams A and B on the first 60 balls in a cricket match are given below:

Represent the data of both the teams on the same graph by frequency polygon.
View SolutionThe number of runs given by a bowler in a one-day match in 10 overs is given below.
Draw the line graph for given data.
Overs12345678910Number of runs28510472012711
View SolutionFind the mean deviation about the median for the data : xi: 5 7 9 10 12 15. fi: 8 6 2 2 2 6
View SolutionIf it is 4 = then then it's on if1 x = 6x2-1 male -(11) x2 = 3 + 2.12(III) x2 = 3 - 22(IV) xi = 6x2 + 1(2) 1.1V(3) I, III(4) I, II, III, IV
View SolutionIn which octant the following points lie :
(i) (2, 1, 4) (ii) (-1,2,4)
(iii) (1,-3, 2) (iv) (1, 5,-6)
(v) (2, -1, -3) (vi) (-2, 3, -5)
(vii) (-4, -1, 3) (viii) (-1, -2, 3)
View SolutionDraw a graph for the following. (i) Side of square (in cm) 2,3,3.5,5,6 and Perimeter (in cm) 8,12,14,20,24 Is it a linear graph ? (ii) Side of square (in cm) 2,3,4,5,6 and Area (in cm) 4,9,16,25,36 Is it a linear graph ?
View Solution
