Total number of students of a school in different years is shown in the following table
To solve the question of preparing a pictograph based on the total number of students in different years, we will follow these steps:
1. Understand the Data:
We have the number of students in different years. The years and the corresponding number of students are:
- 1996: 400 students
- 1998: 535 students
- 2000: 472 students
- 2002: 600 students
- 2004: 623 students
2. Choose a Symbol:
We will use a symbol to represent a certain number of students. In the first pictograph, we will use one symbol to represent 100 students.
3. Draw the Pictograph for Each Year:
- 1996: 400 students = 4 symbols (since 400 ÷ 100 = 4)
- 1998: 535 students = 5 symbols and 1 half symbol (since 500 ÷ 100 = 5 and 35 students = half)
- 2000: 472 students = 4 symbols and 1 half symbol (since 400 ÷ 100 = 4 and 72 students = half)
- 2002: 600 students = 6 symbols (since 600 ÷ 100 = 6)
- 2004: 623 students = 6 symbols and 1 half symbol (since 600 ÷ 100 = 6 and 23 students = half)
4. Represent the Pictograph:
Now we will represent the data in pictograph form:
Year | Students | Pictograph
-------------------------------
1996 | 400 | ★★★★
1998 | 535 | ★★★★★☆
2000 | 472 | ★★★★☆
2002 | 600 | ★★★★★★
2004 | 623 | ★★★★★★☆
5. Prepare a Second Pictograph:
Now, we will prepare another pictograph using a different symbol, where each symbol represents 50 students.
- 1996: 400 students = 8 symbols (since 400 ÷ 50 = 8)
- 1998: 535 students = 10 symbols and 1 half symbol (since 500 ÷ 50 = 10 and 35 students = half)
- 2000: 472 students = 9 symbols and 1 half symbol (since 450 ÷ 50 = 9 and 22 students = half)
- 2002: 600 students = 12 symbols (since 600 ÷ 50 = 12)
- 2004: 623 students = 12 symbols and 1 half symbol (since 600 ÷ 50 = 12 and 23 students = half)
6. Represent the Second Pictograph:
Year|Students|Πc→graph−−−−−−−−−−−−−−−−−−−−−−−−−−−−−−−1996|400|★★★★★★★★1998|535|★★★★★★★★★★☆2000|472|★★★★★★★★★☆2002|600|★★★★★★★★★★★★2004|623|★★★★★★★★★★★★☆
7. Conclusion:
- The second pictograph is more informative because it uses smaller intervals (50 students per symbol), allowing for a more precise representation of the data.
We have the number of students in different years. The years and the corresponding number of students are:
- 1996: 400 students
- 1998: 535 students
- 2000: 472 students
- 2002: 600 students
- 2004: 623 students
We will use a symbol to represent a certain number of students. In the first pictograph, we will use one symbol to represent 100 students.
- 1996: 400 students = 4 symbols (since 400 ÷ 100 = 4)
- 1998: 535 students = 5 symbols and 1 half symbol (since 500 ÷ 100 = 5 and 35 students = half)
- 2000: 472 students = 4 symbols and 1 half symbol (since 400 ÷ 100 = 4 and 72 students = half)
- 2002: 600 students = 6 symbols (since 600 ÷ 100 = 6)
- 2004: 623 students = 6 symbols and 1 half symbol (since 600 ÷ 100 = 6 and 23 students = half)
Now we will represent the data in pictograph form:
Year | Students | Pictograph
-------------------------------
1996 | 400 | ★★★★
1998 | 535 | ★★★★★☆
2000 | 472 | ★★★★☆
2002 | 600 | ★★★★★★
2004 | 623 | ★★★★★★☆
Now, we will prepare another pictograph using a different symbol, where each symbol represents 50 students.
- 1996: 400 students = 8 symbols (since 400 ÷ 50 = 8)
- 1998: 535 students = 10 symbols and 1 half symbol (since 500 ÷ 50 = 10 and 35 students = half)
- 2000: 472 students = 9 symbols and 1 half symbol (since 450 ÷ 50 = 9 and 22 students = half)
- 2002: 600 students = 12 symbols (since 600 ÷ 50 = 12)
- 2004: 623 students = 12 symbols and 1 half symbol (since 600 ÷ 50 = 12 and 23 students = half)
Year|Students|Πc→graph−−−−−−−−−−−−−−−−−−−−−−−−−−−−−−−1996|400|★★★★★★★★1998|535|★★★★★★★★★★☆2000|472|★★★★★★★★★☆2002|600|★★★★★★★★★★★★2004|623|★★★★★★★★★★★★☆
- The second pictograph is more informative because it uses smaller intervals (50 students per symbol), allowing for a more precise representation of the data.
Topper's Solved these Questions
- DATA HANDLINGBOOK - NCERT ENGLISHCHAPTER - DATA HANDLINGEXERCISE - SOLVED EXAMPLES
9 Videos
- DATA HANDLINGBOOK - NCERT ENGLISHCHAPTER - DATA HANDLINGEXERCISE - EXERCISE 9.3
3 Videos
- BASIC GEOMETRICAL IDEASBOOK - NCERT ENGLISHCHAPTER - BASIC GEOMETRICAL IDEASEXERCISE - EXERCISE 4.6
4 Videos
- DECIMALSBOOK - NCERT ENGLISHCHAPTER - DECIMALSEXERCISE - EXERCISE 8.3
2 Videos
Similar Questions
Knowledge Check

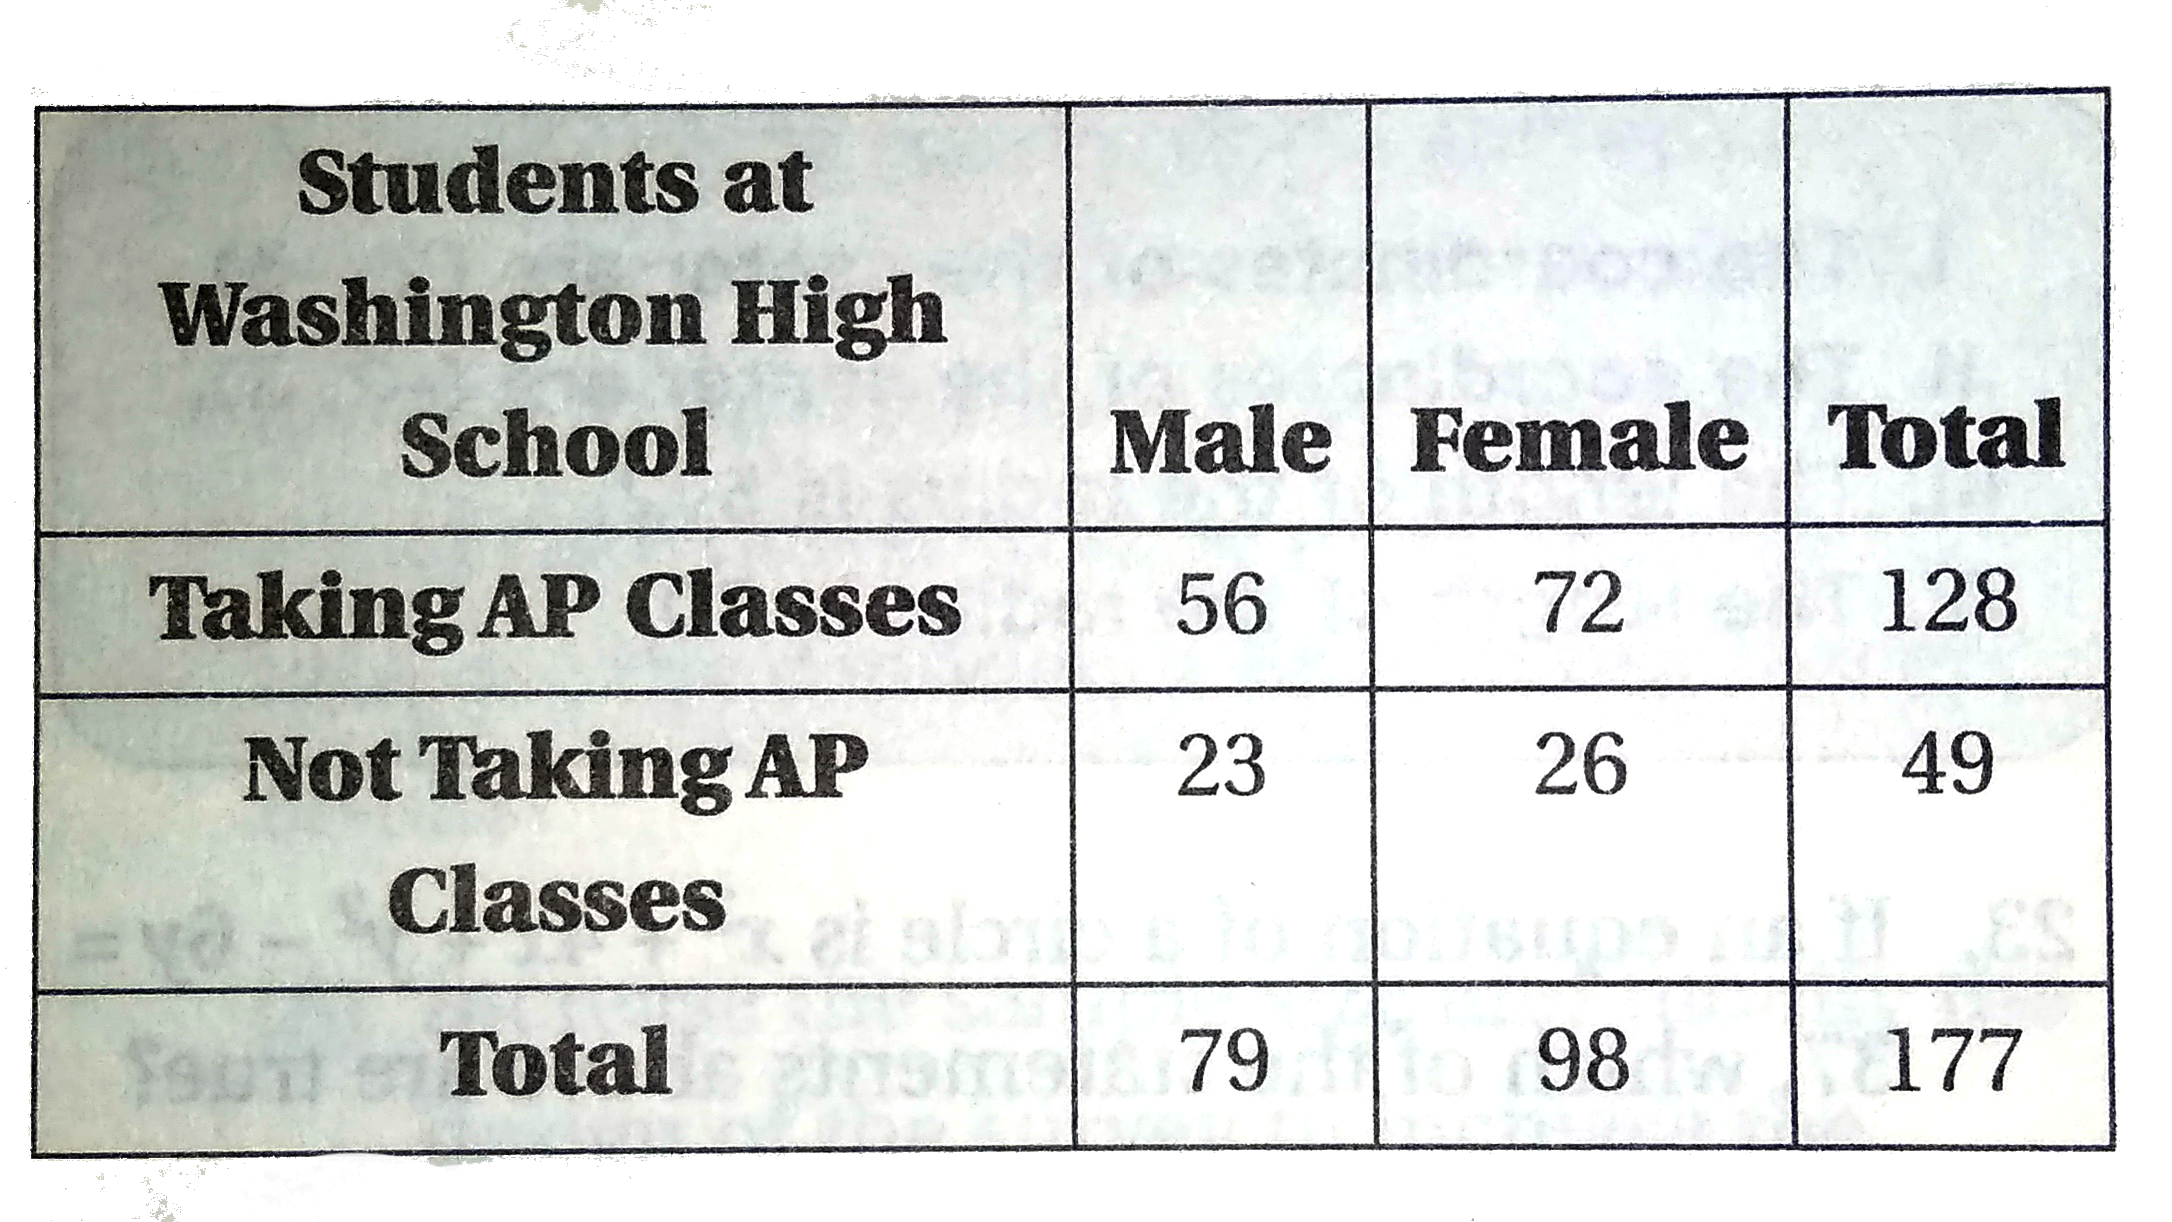
The table above gives the number of male and female students at Washington High School who are taking Advanced Placement (AP) classes and those who are not. What is the proportions of the total number of students at the school who are both male and NOT taking AP classes?A23177B79177C2349D2356
The ages of 37 students in a class are given in the following table: Find the median
View SolutionThe following pie-chart shows the number of students admitted in different feculties of a college. If 1000 students are admitted in Science answer the following:
(i) What is the total number of students?
(ii) What is the ratio of students in science and arts?
View SolutionRead the adjoining bar graph showing the number ofstudents in a particular class of a school. Answer thefollowing questions :(a) What is the scale of this graph?(b) How many new students are added every year?(c) Is the number of students in the year 2003 twice that in the year 2000?
View SolutionThe number of students admitted in different faculties of a college are given below: Faculty, Science, Art, Commerce, Law, Edu., Total No. of Student, 1000,1200,650,450,300,3600 Draw a pie-chart to represent the above information.
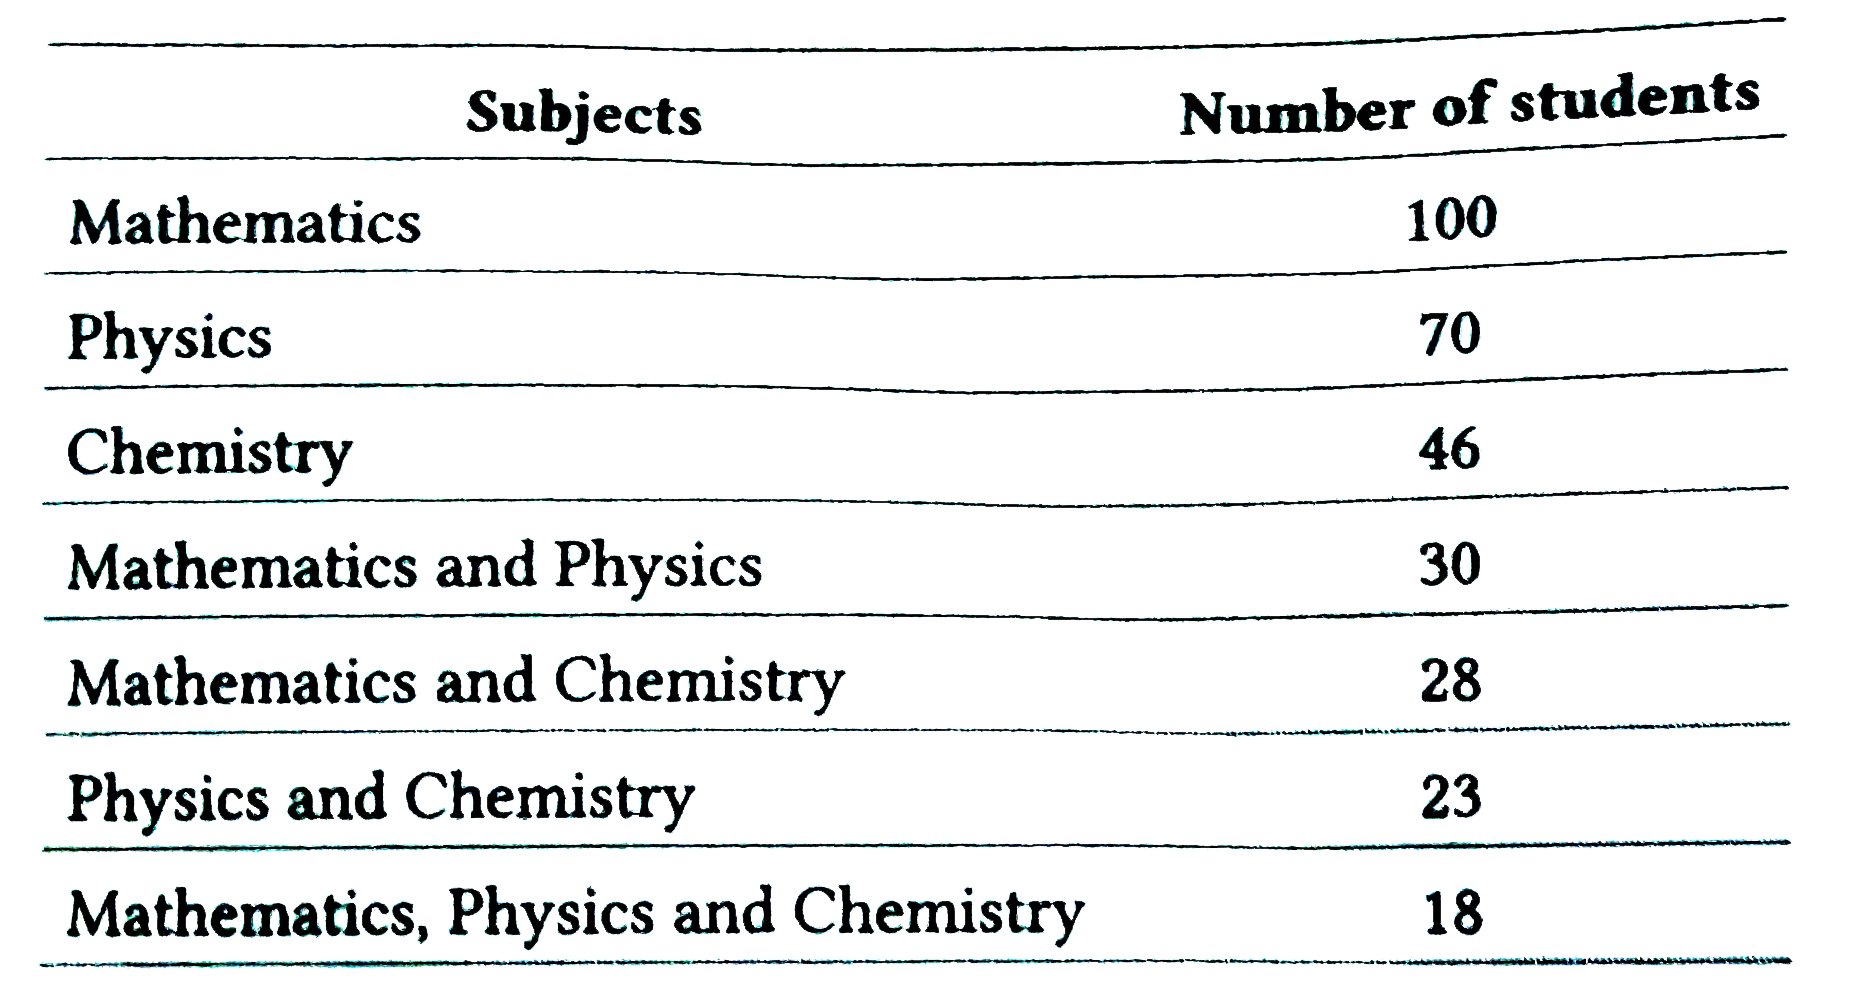
View SolutionA class has 175 students. The following table shows the number of students studying one or more of the following subjects in this case.

How many students are enrolled in Mathematics alone, Physics alone and Chemistry alone? Are there students who have not offered any one of these subjects?
View SolutionA picnic is being planned in a school for Class VII. Girls are 60% of the total number of students and are 18 in number.The picnic site is 55 km from the school and the transport company is charging at the rate of Rs 12 per km. The total cost of refreshments will be Rs 4280. Can you tell.1. The ratio of the number of girls to the number of boys in the class?2. The cost per head if two teachers are also going with the class?3. If their first stop is at a place 22 km from the school, what per cent of the total distance of 55 km is this? What per cent of the distance is left to be covered?
View SolutionNumber of boys in a school are 360 and the rest are girls. If the total strength of the school is 750, find the ratio of :
a. the number of boys to the number of girls.
b. the number of girls to the number of boys.
c. the number of boys to all students in the school.
d. all students in the school to the number of girls.
View Solution
