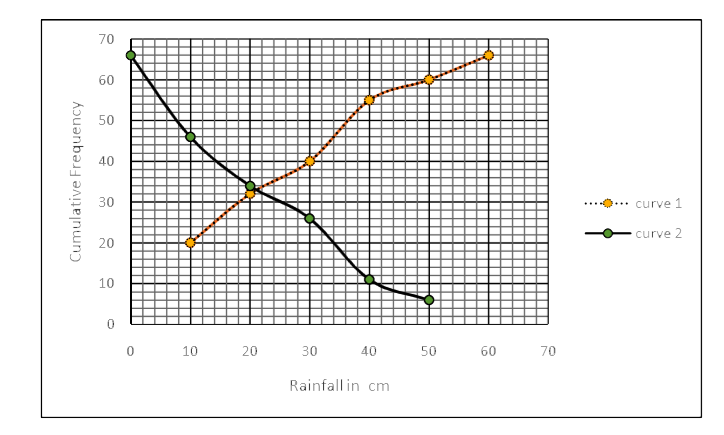
What is the value of the median of the data using the graph in the following figure of less than ogive and more than ogive? (FIGURE)
To find the median of the data using the less than ogive and more than ogive graphs, follow these steps:
1. Understand the Ogives:
- The less than ogive represents the cumulative frequency of data points that are less than or equal to a certain value.
- The more than ogive represents the cumulative frequency of data points that are greater than or equal to a certain value.
2. Identify the Intersection Point:
- Look at the graph and find the point where the less than ogive and the more than ogive intersect. This point is crucial as it indicates the median.
3. Draw a Perpendicular Line:
- From the intersection point, draw a perpendicular line down to the x-axis (the horizontal axis). This line helps us find the corresponding x-value that represents the median.
4. Read the Median Value:
- The point where the perpendicular line intersects the x-axis is the median of the data. In this case, it is given as 4.
5. Conclusion:
- Therefore, the value of the median of the data is 4.
Final Answer:
The median of the data is 4.
- The less than ogive represents the cumulative frequency of data points that are less than or equal to a certain value.
- The more than ogive represents the cumulative frequency of data points that are greater than or equal to a certain value.
- Look at the graph and find the point where the less than ogive and the more than ogive intersect. This point is crucial as it indicates the median.
- From the intersection point, draw a perpendicular line down to the x-axis (the horizontal axis). This line helps us find the corresponding x-value that represents the median.
- The point where the perpendicular line intersects the x-axis is the median of the data. In this case, it is given as 4.
- Therefore, the value of the median of the data is 4.
The median of the data is 4.
Topper's Solved these Questions
Similar Questions
Find the mean deviation using median for the following datas:
 View Solution
A TV reporter was given a task to prepare a report on the rainfall of the city Dispur of India in a particular year. After collecting the data, he analyzed the data and prepared a report on the rainfall of the city. Using this report, he drew the following graph for a particular time period of 66 days

Based on the above graph, answer the following questions
(i) Identify less than type ogive and more than type ogive from the given graph.
(ii) Find the median rainfall of Dispur
(iii) Obtain the Mode of the data if mean rainfall is 23.4cmView Solution
Knowledge Check
- Question 1 - Select One
The abscissa of the point of intersection of less than type and more than type ogives gives its
AmeanBmodeCmedianDall the three measures
Which of the following occurs more than one and less than five in a chromosome?
View SolutionWhich of the following figures have rotational symmetry of order more than 1:
View SolutionWhich measure of central tendency is given by the x -coordinate of the point of intersection of the more than ogive and less than ogive?
View SolutionConstruct a less than ogive and a more than ogive from the following data :
 View Solution
Draw an ogive for the following distribution

Use the ogive drawn to determine:
the median income,View SolutionFor the following data, draw a 'less than' ogive and hence find the median of the distribution.
 View Solution
Draw a less than cumulative curve (ogive to represent the data.

Also, find the mdian with the help of less than ogive.View Solution

