Complete Solutions to QUESTION BASED ON LINE GRAPH: of chapter COMPOSITION - II (WRITING ANALYTICAL PARAGRAPH ON MAP/CHART/REPORT/ LINE GRAPH) of Class 10 book with complete answers and questions
| Class 10 | ENGLISH |
| Chapter | COMPOSITION - II (WRITING ANALYTICAL PARAGRAPH ON MAP/CHART/REPORT/ LINE GRAPH) |
| FULL MARKS | QUESTION BASED ON LINE GRAPH: |
| Number Of Questions | 7 |
| Academic Year | 2023-24 |
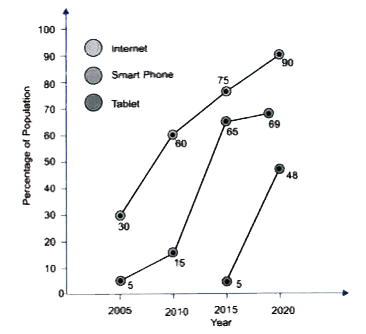
The graph shows the recent technological revolution in India in recent years. Summarises the information by selecting and reporting the main features. Make comparisons where necessary.
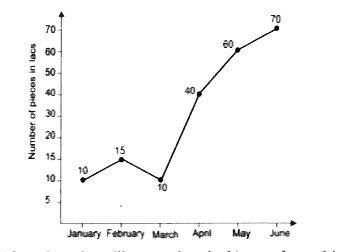
View SolutionThe line-graph chart given below breaks down the sales history of the famous Lifebuoy brand in soap in the first six months of the year, from January to June. Write an analytic paragraph in 150–200 words after selecting and reporting the main features. Make comparions where necessary.
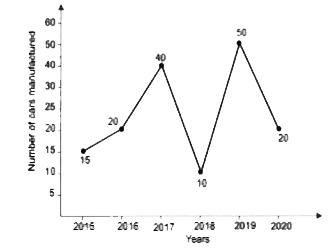
View SolutionThe line graph given below breaks down the number of cars produced in Standard Automobile Company from 2015 to 2020. Summarise the information by selecting and reporting the main features. Make comparisons where necessary.
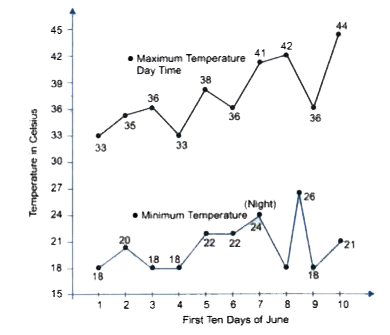
View SolutionThe line graph given above illustrates the maximum and minimum temperatures in the first ten days of June. Summarise the information by selecting and reporting the main features. Make comparisons where necessary.
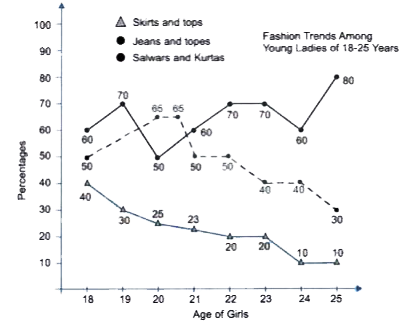
View SolutionThe line graph shown below illustrates the main trends in garments of young ladies of 18 to 25 years. Summarise and write an analytic paragraph in your own words highlighting the main features and details. Compare wherever relevant.
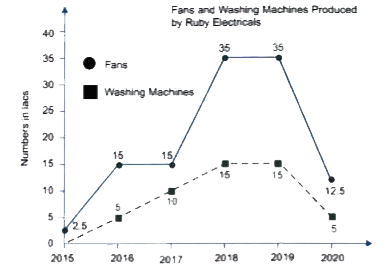
View SolutionThe line graph given below shows the number of Fans and Washing Machines produced by Ruby Electricals between 2015 and 2020. Summarise and write an analytic paragraph highlighting the main trends and the necessary details. Compare wherever relevant.
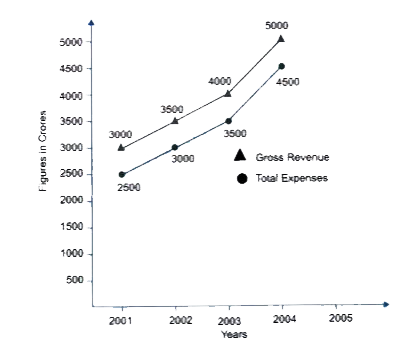
View SolutionThe Line graph given below represents Railway Finance from 2001-2002 to 2004-2005 (Northern Zone). It breaks down the gross revenue collected as well as the total expenses incurred during these years. Summarise and write an analytic paragraph highlighting the general trend and necessary details. Compare wherever relevant.
View Solution
QUESTION BASED ON LINE GRAPH: questions and complete solutions for chapter COMPOSITION - II (WRITING ANALYTICAL PARAGRAPH ON MAP/CHART/REPORT/ LINE GRAPH) of FULL MARKS ENGLISH (HINGLISH) of Class 10