Complete Solutions to Understanding Motion Through Graphs of chapter GENERAL KINEMATICS AND MOTION IN ONE DIMENSION of Class 11 book with complete answers and questions
| Class 11 | PHYSICS |
| Chapter | GENERAL KINEMATICS AND MOTION IN ONE DIMENSION |
| A2Z | Understanding Motion Through Graphs |
| Number Of Questions | 40 |
| Academic Year | 2023-24 |
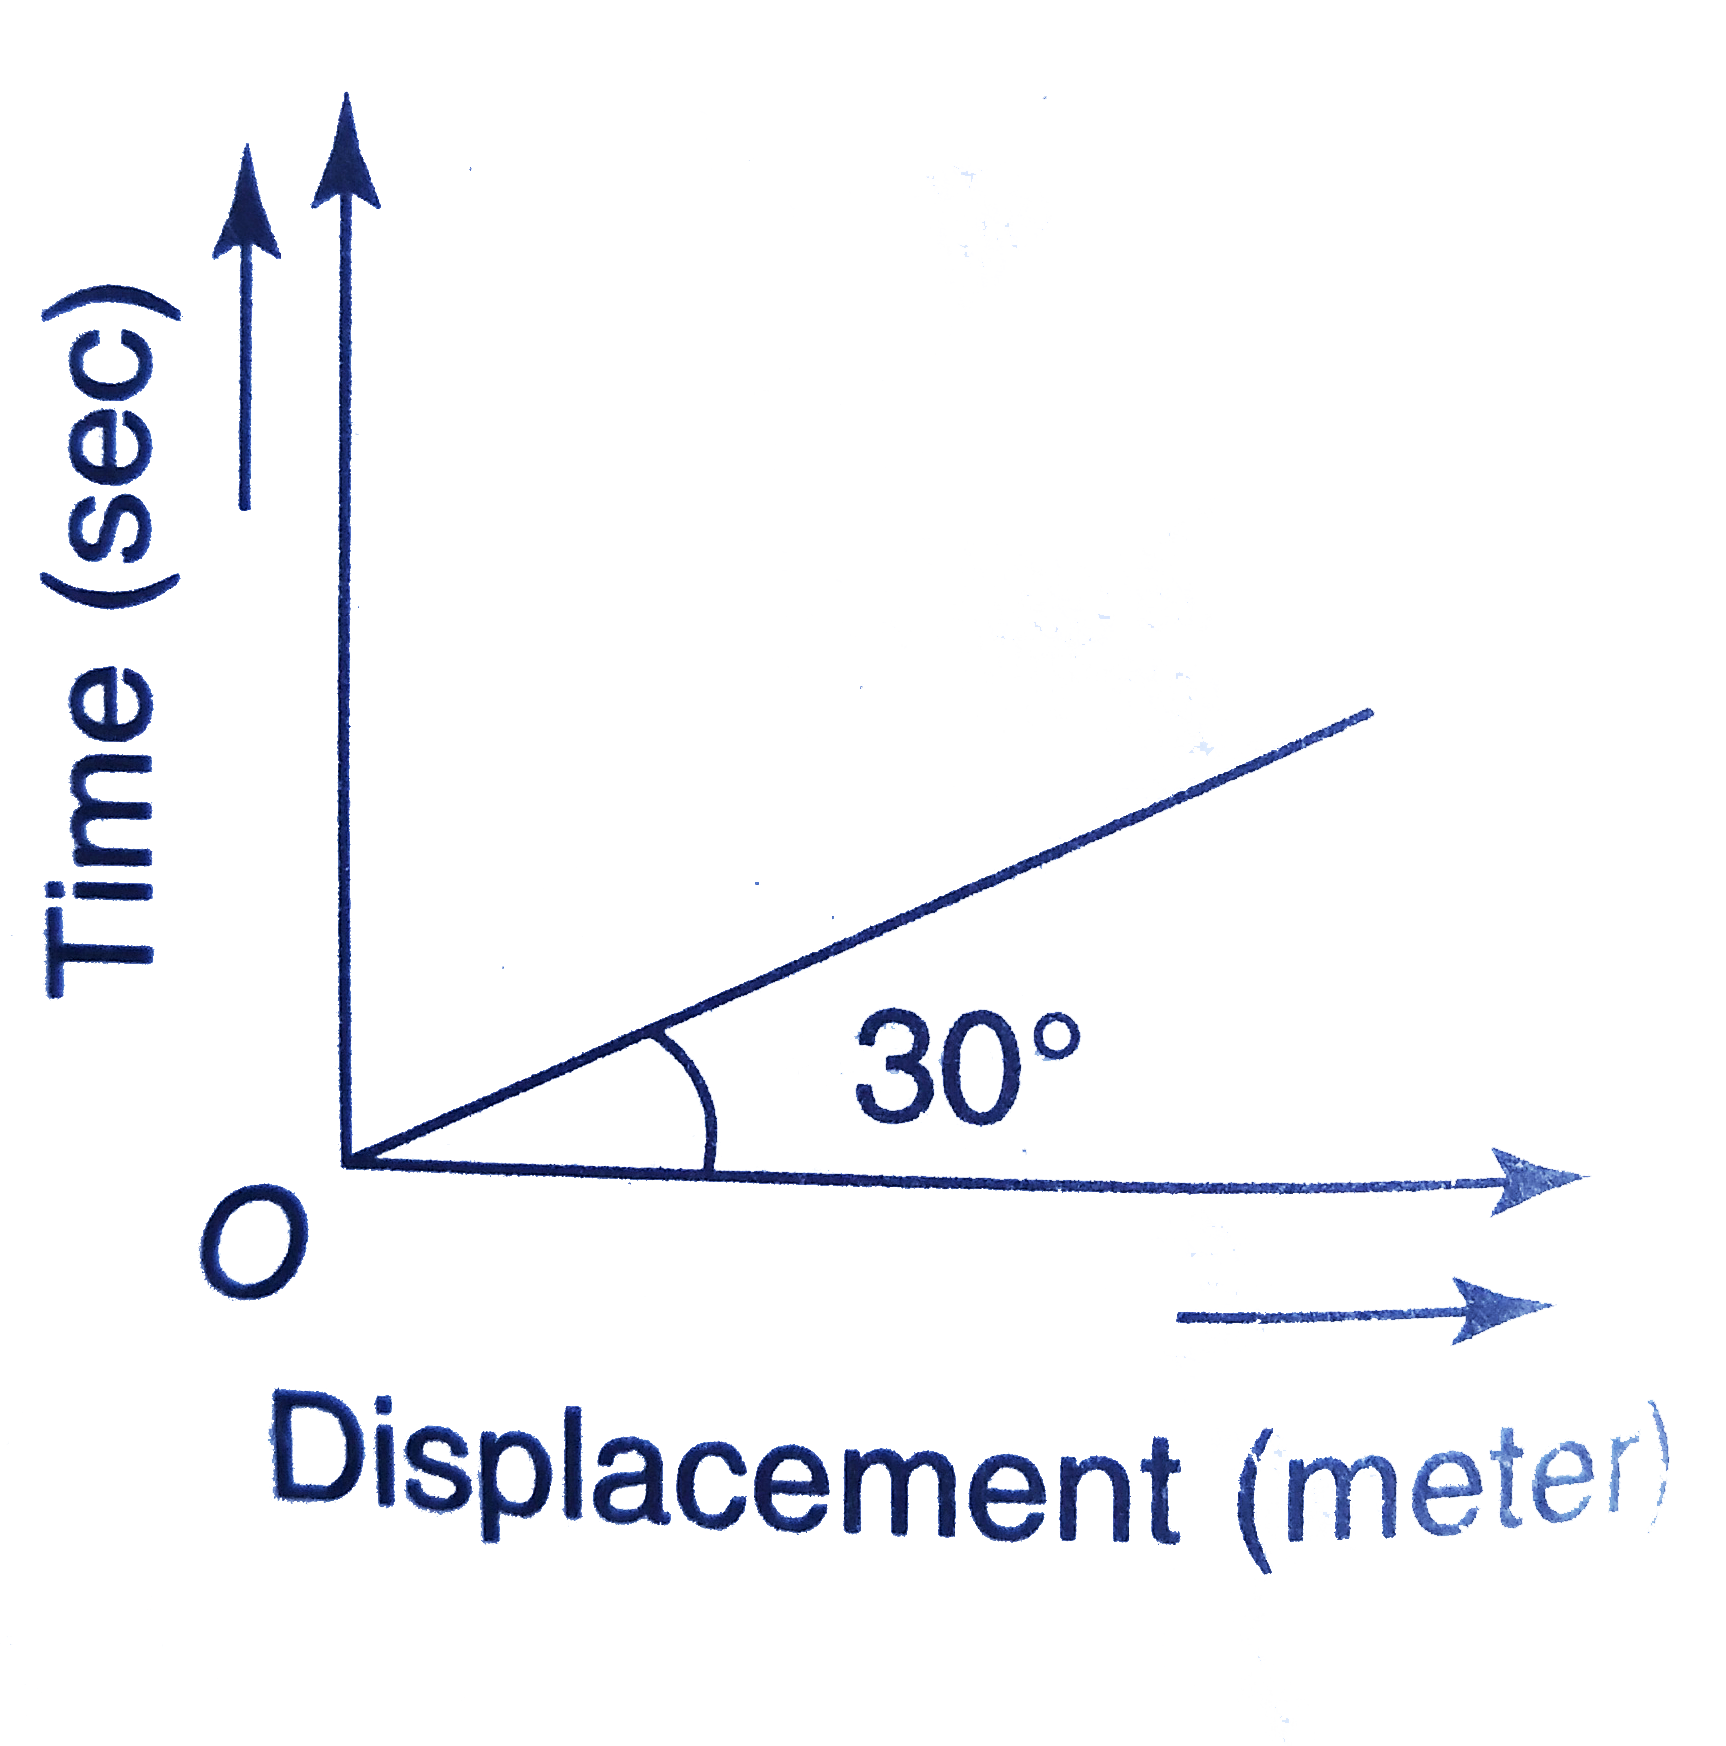
From the following displacement-time graph find out the velocity of a moving body.
View SolutionAmong the four graphs shown in the figure there is only one graph for which average velocity over the time interval (0,T) can vanish for a suitably chosen `T`. Which one is it ?
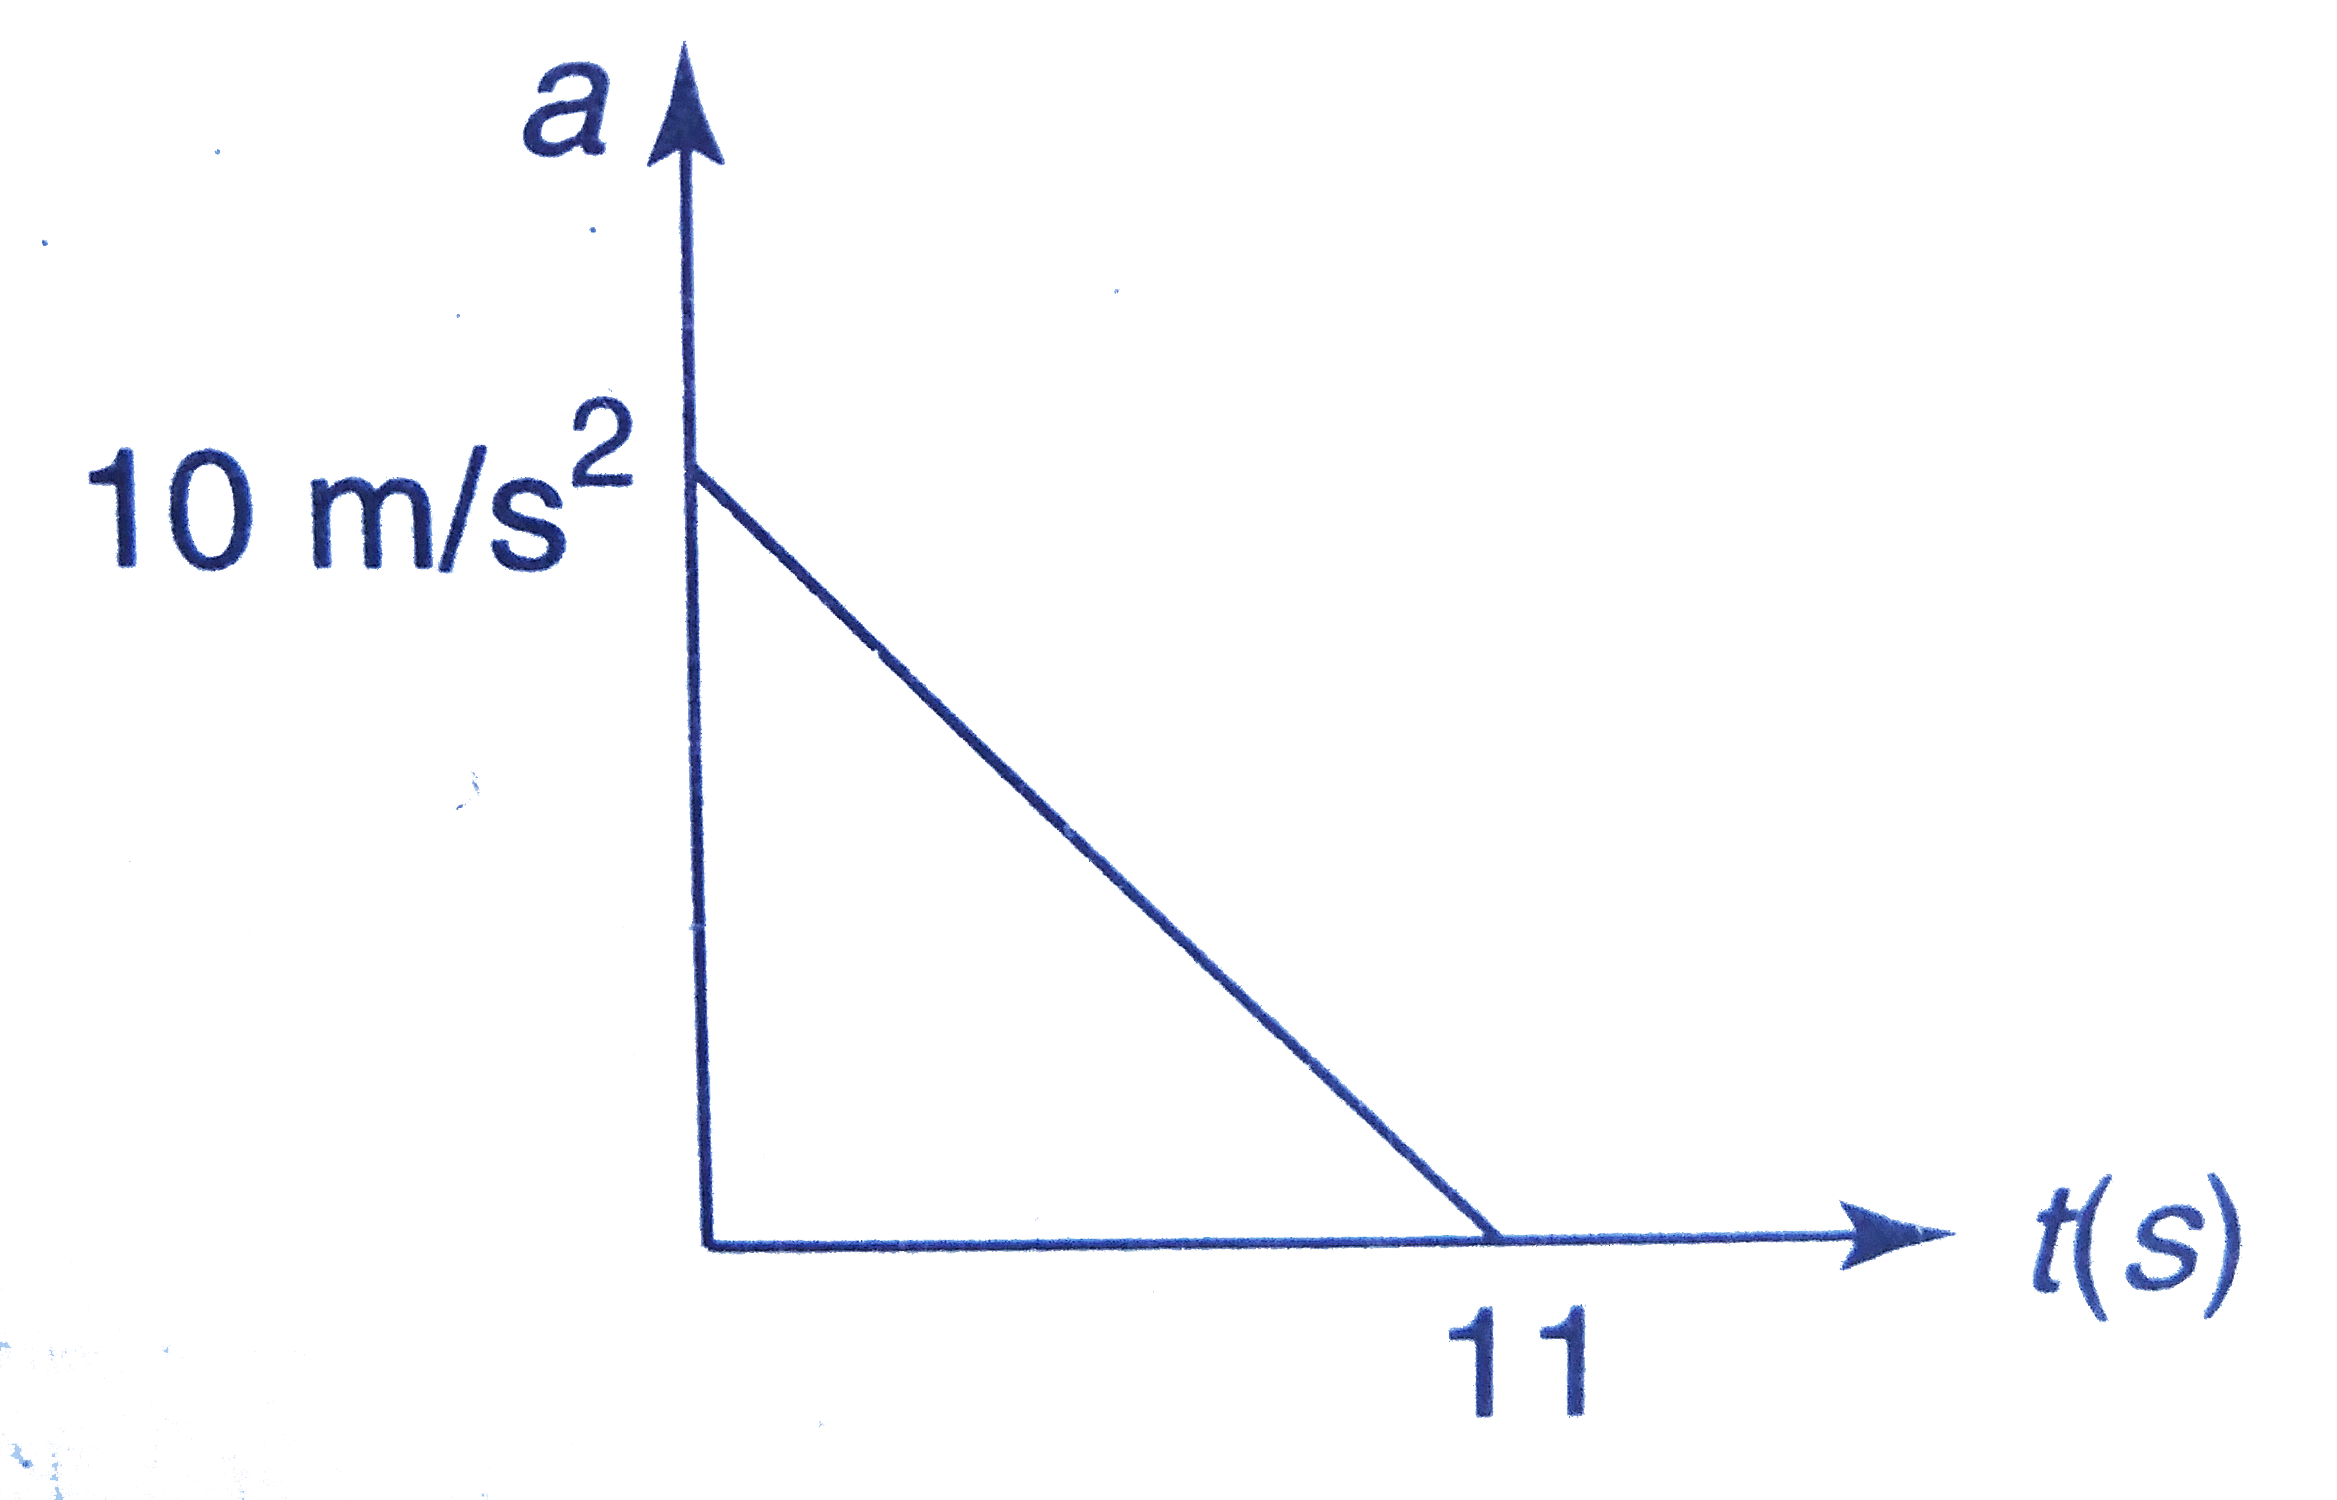
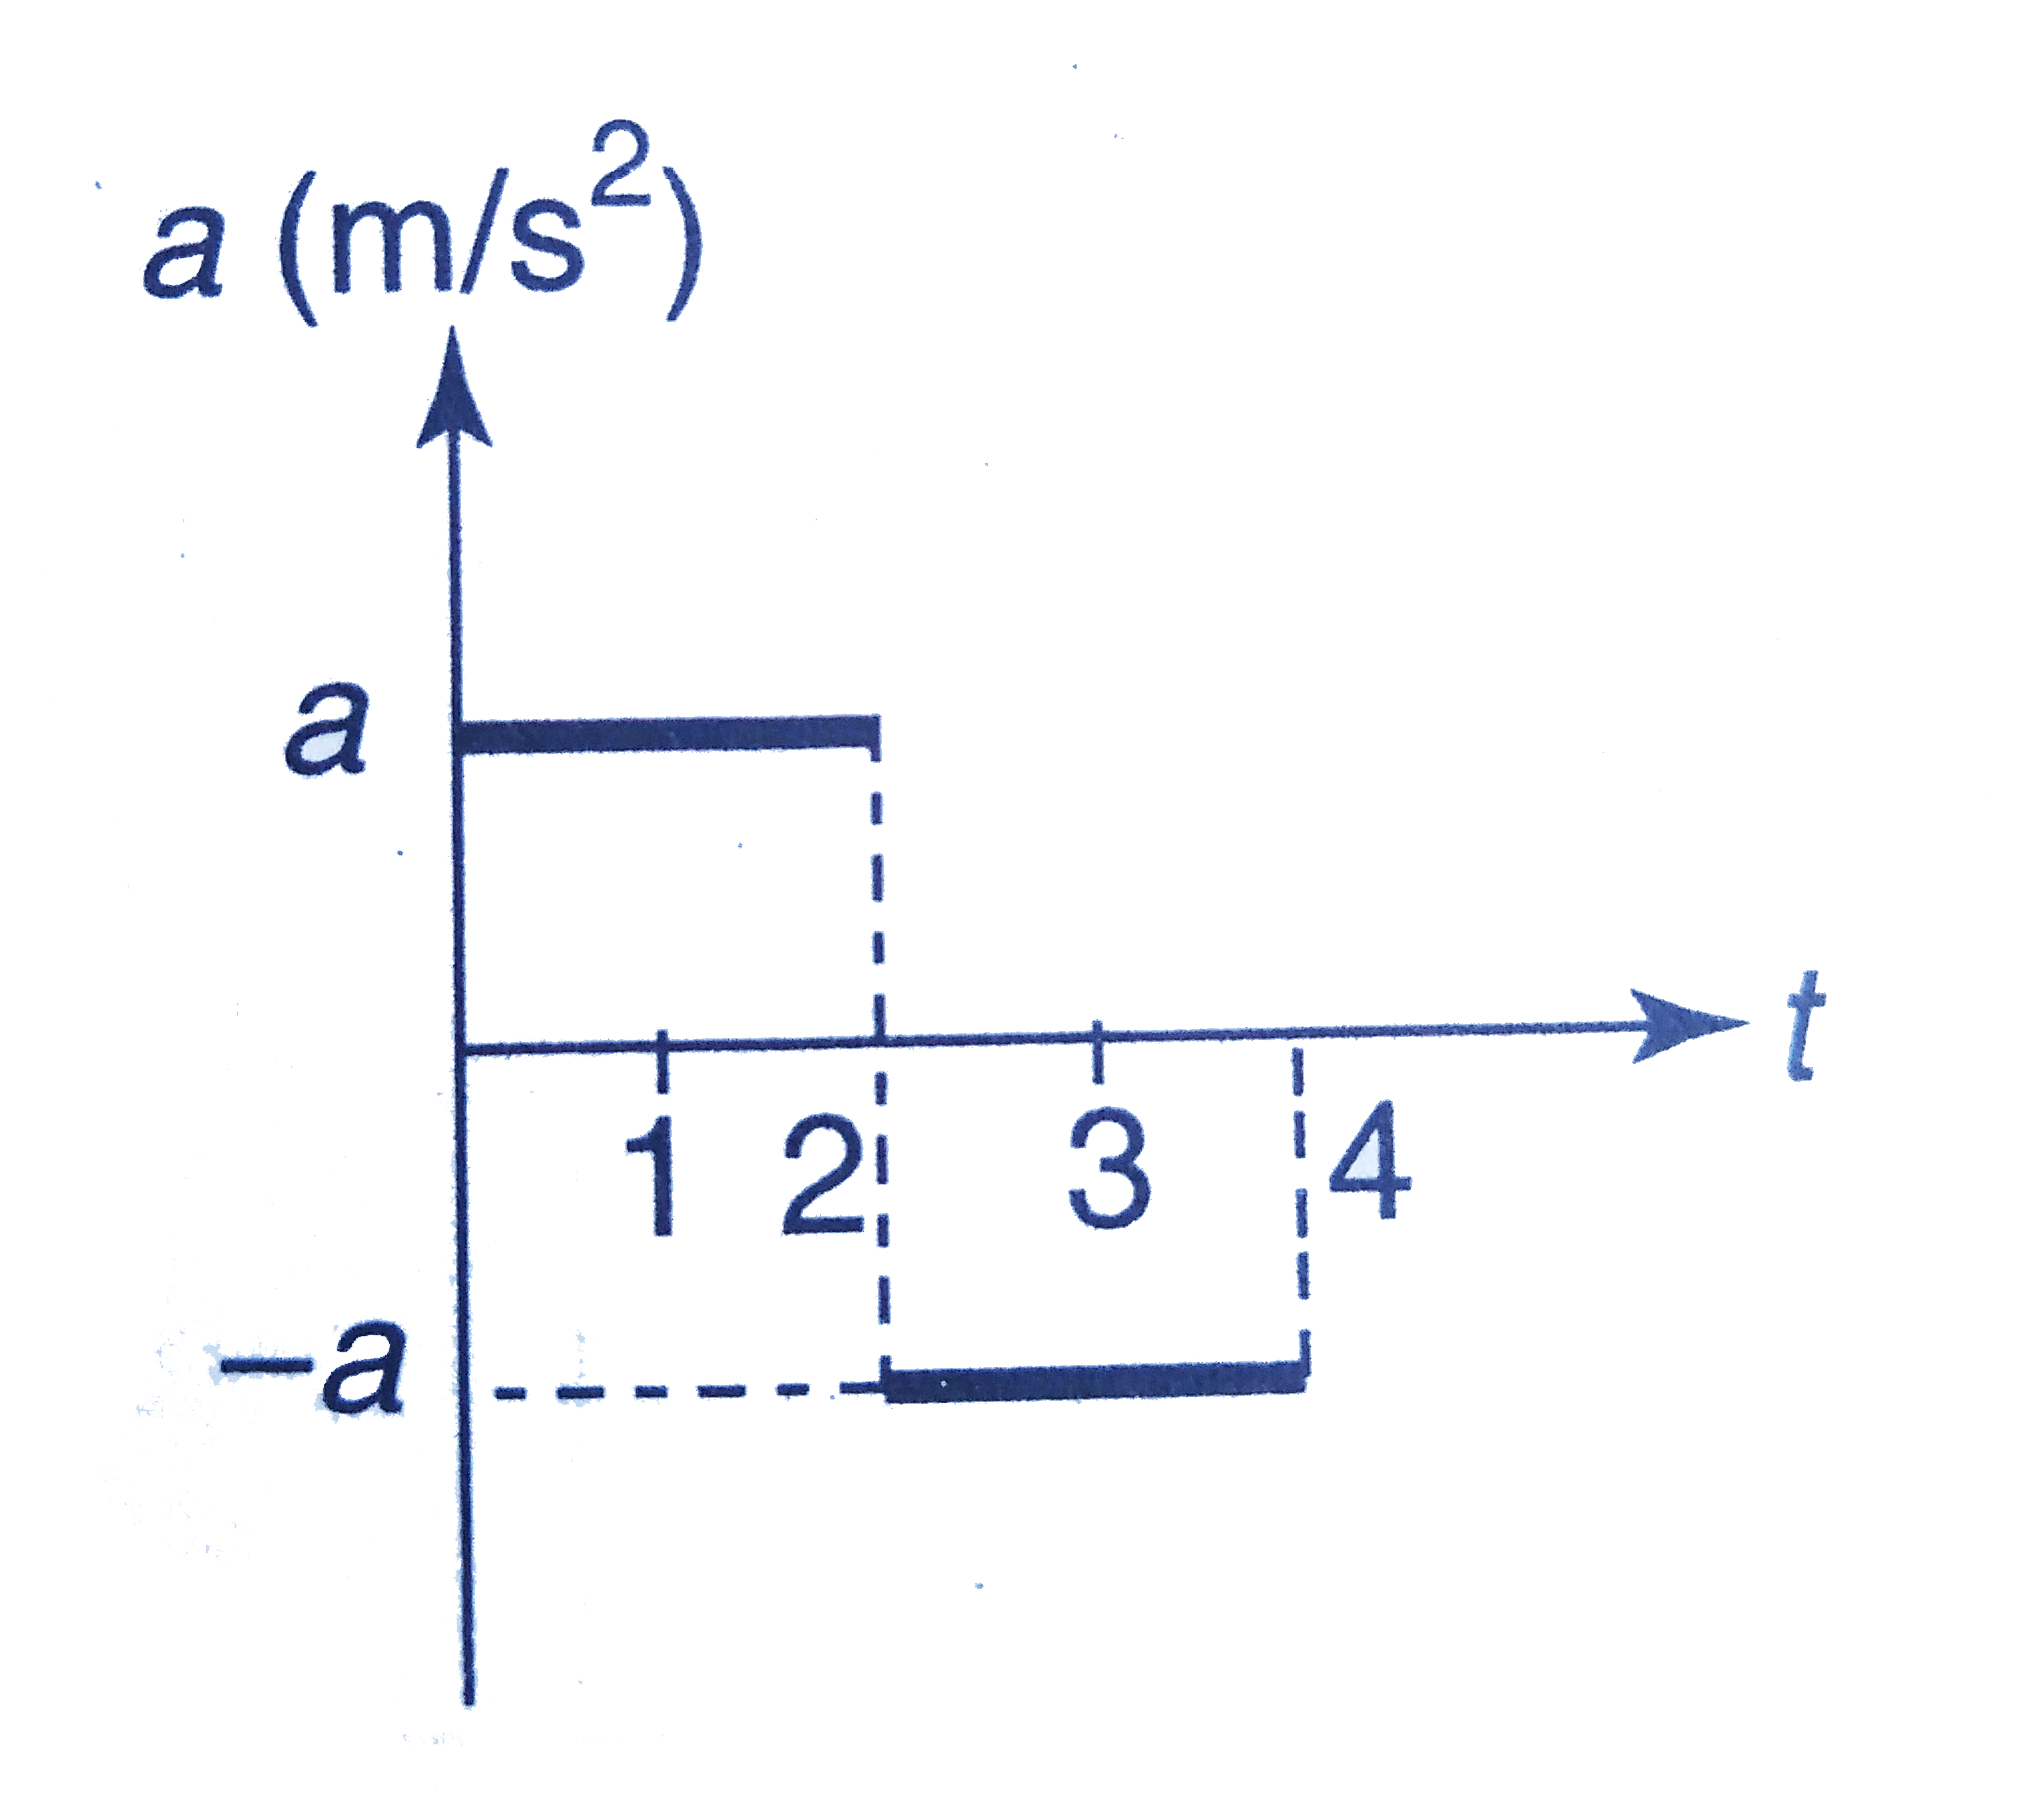
View SolutionThe acceleration-time graph of a particle moving in a straight line is as shown in figure. The velocity of the particle at time `t = 0` is `2 m//s`. The velocity after `2` seconds will be
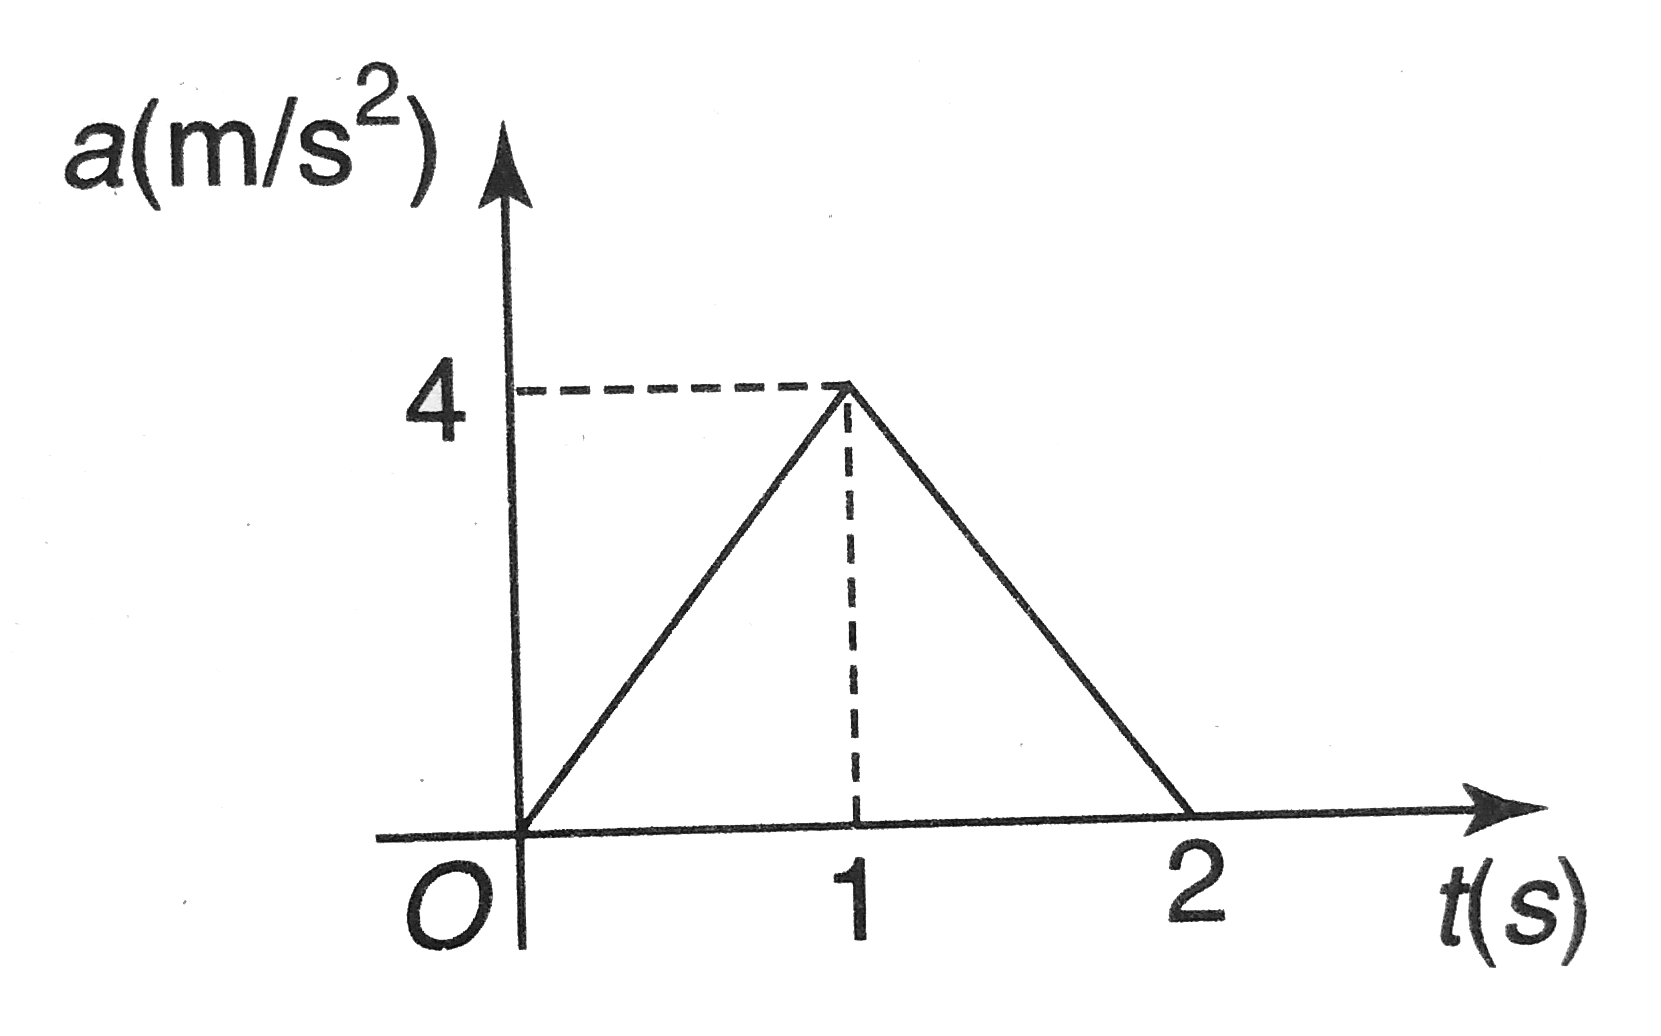
View SolutionThe graph of displacement versus time is shown. Its corresponding velocity-time graph will be.
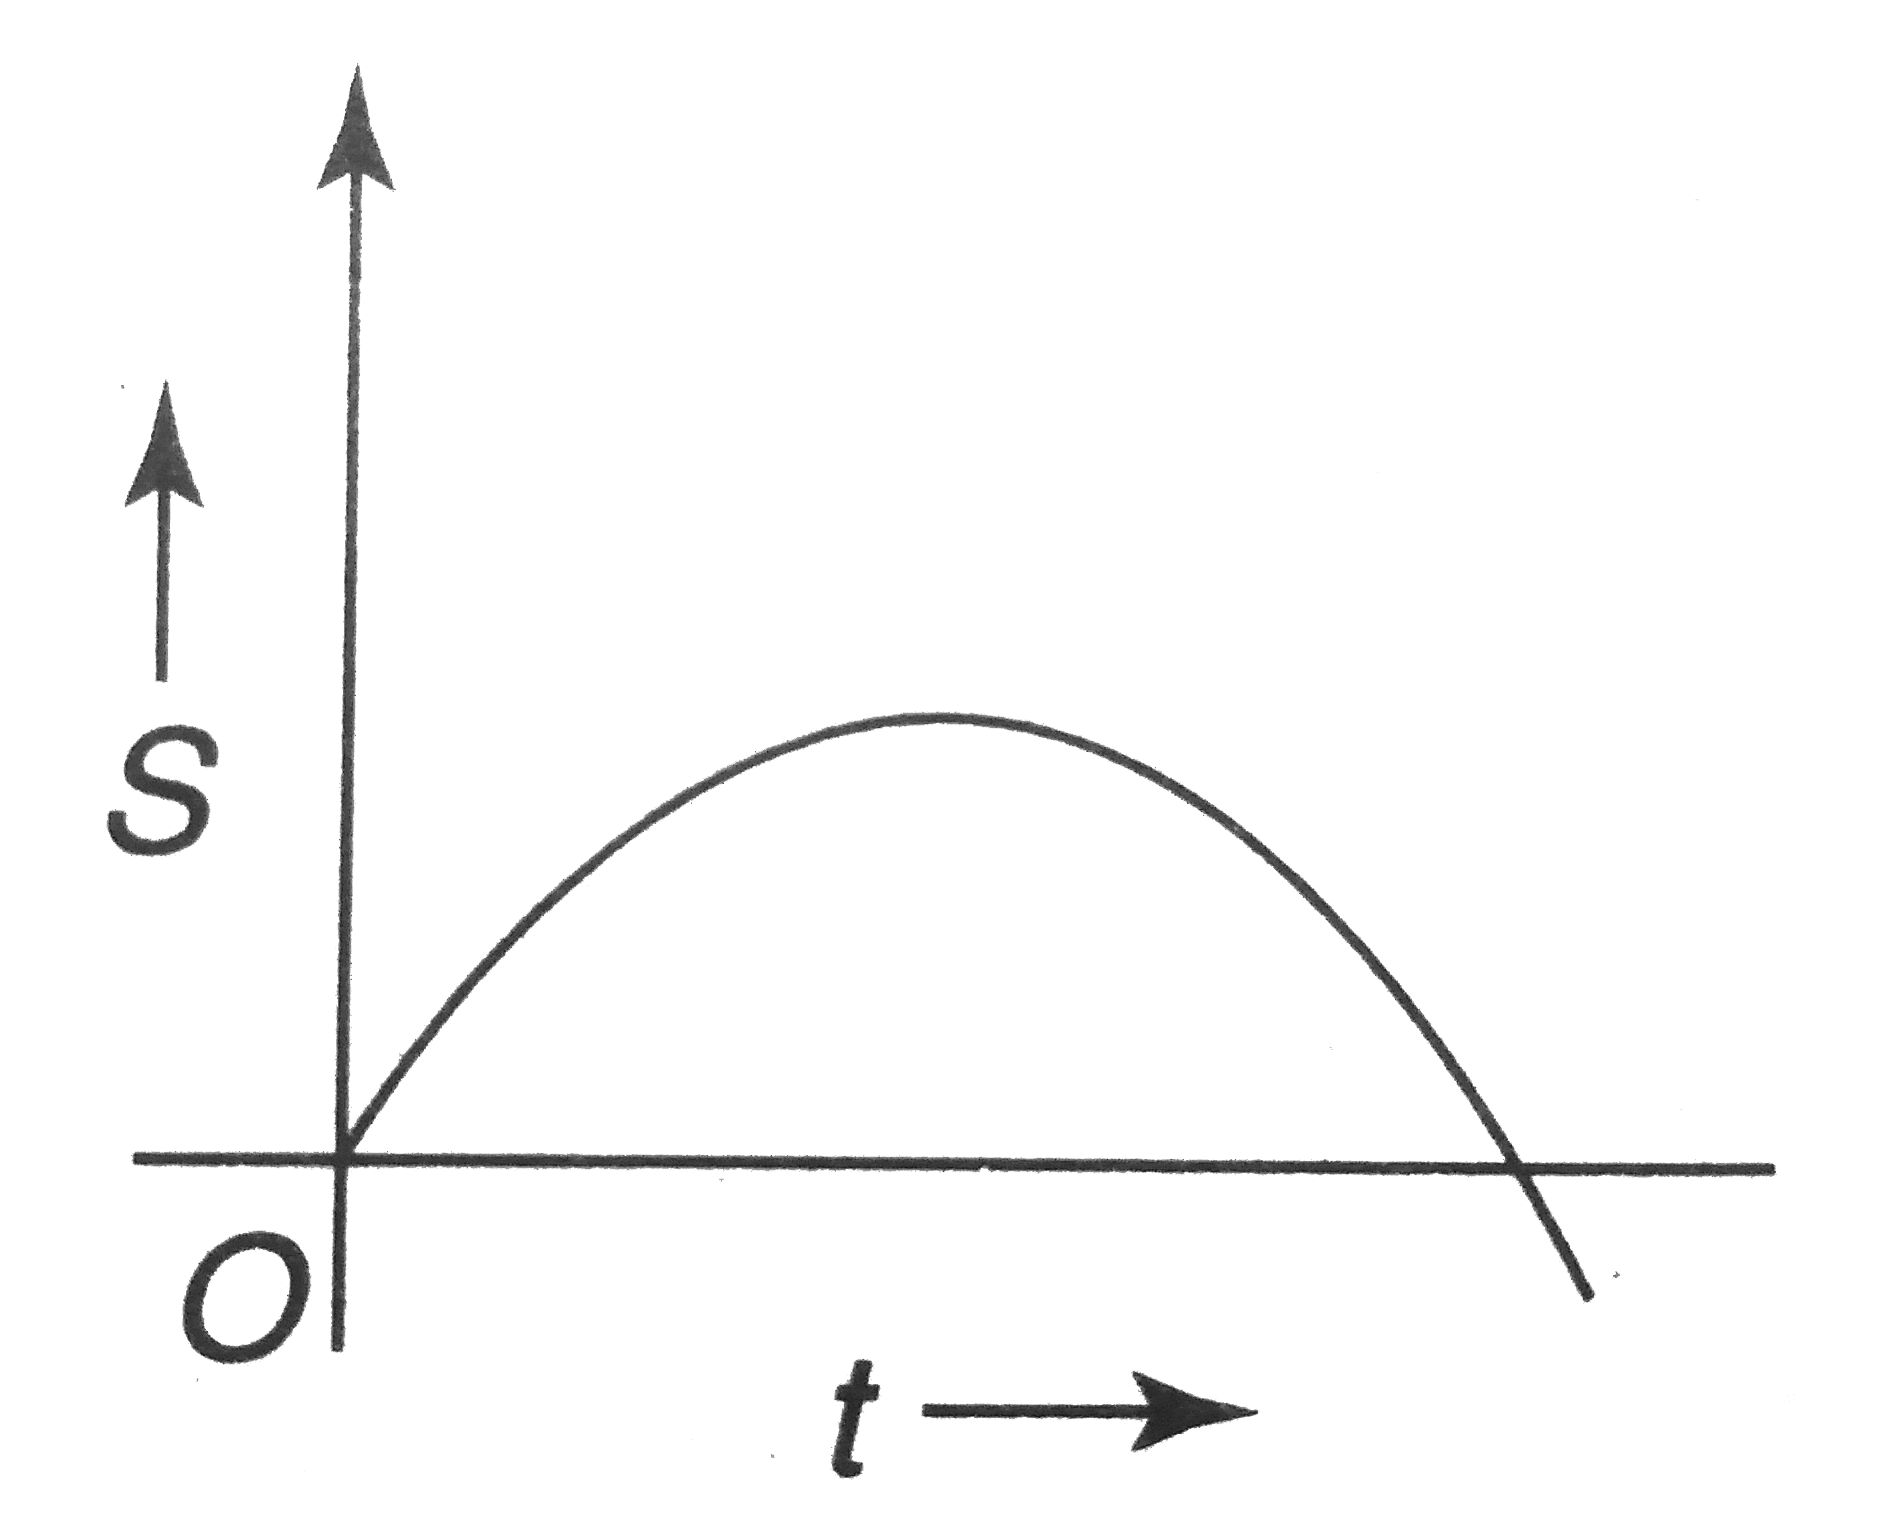
View SolutionThe graph shown the variation of velocity of a rocket with time. Then, the maximum height attained by the rocket is.
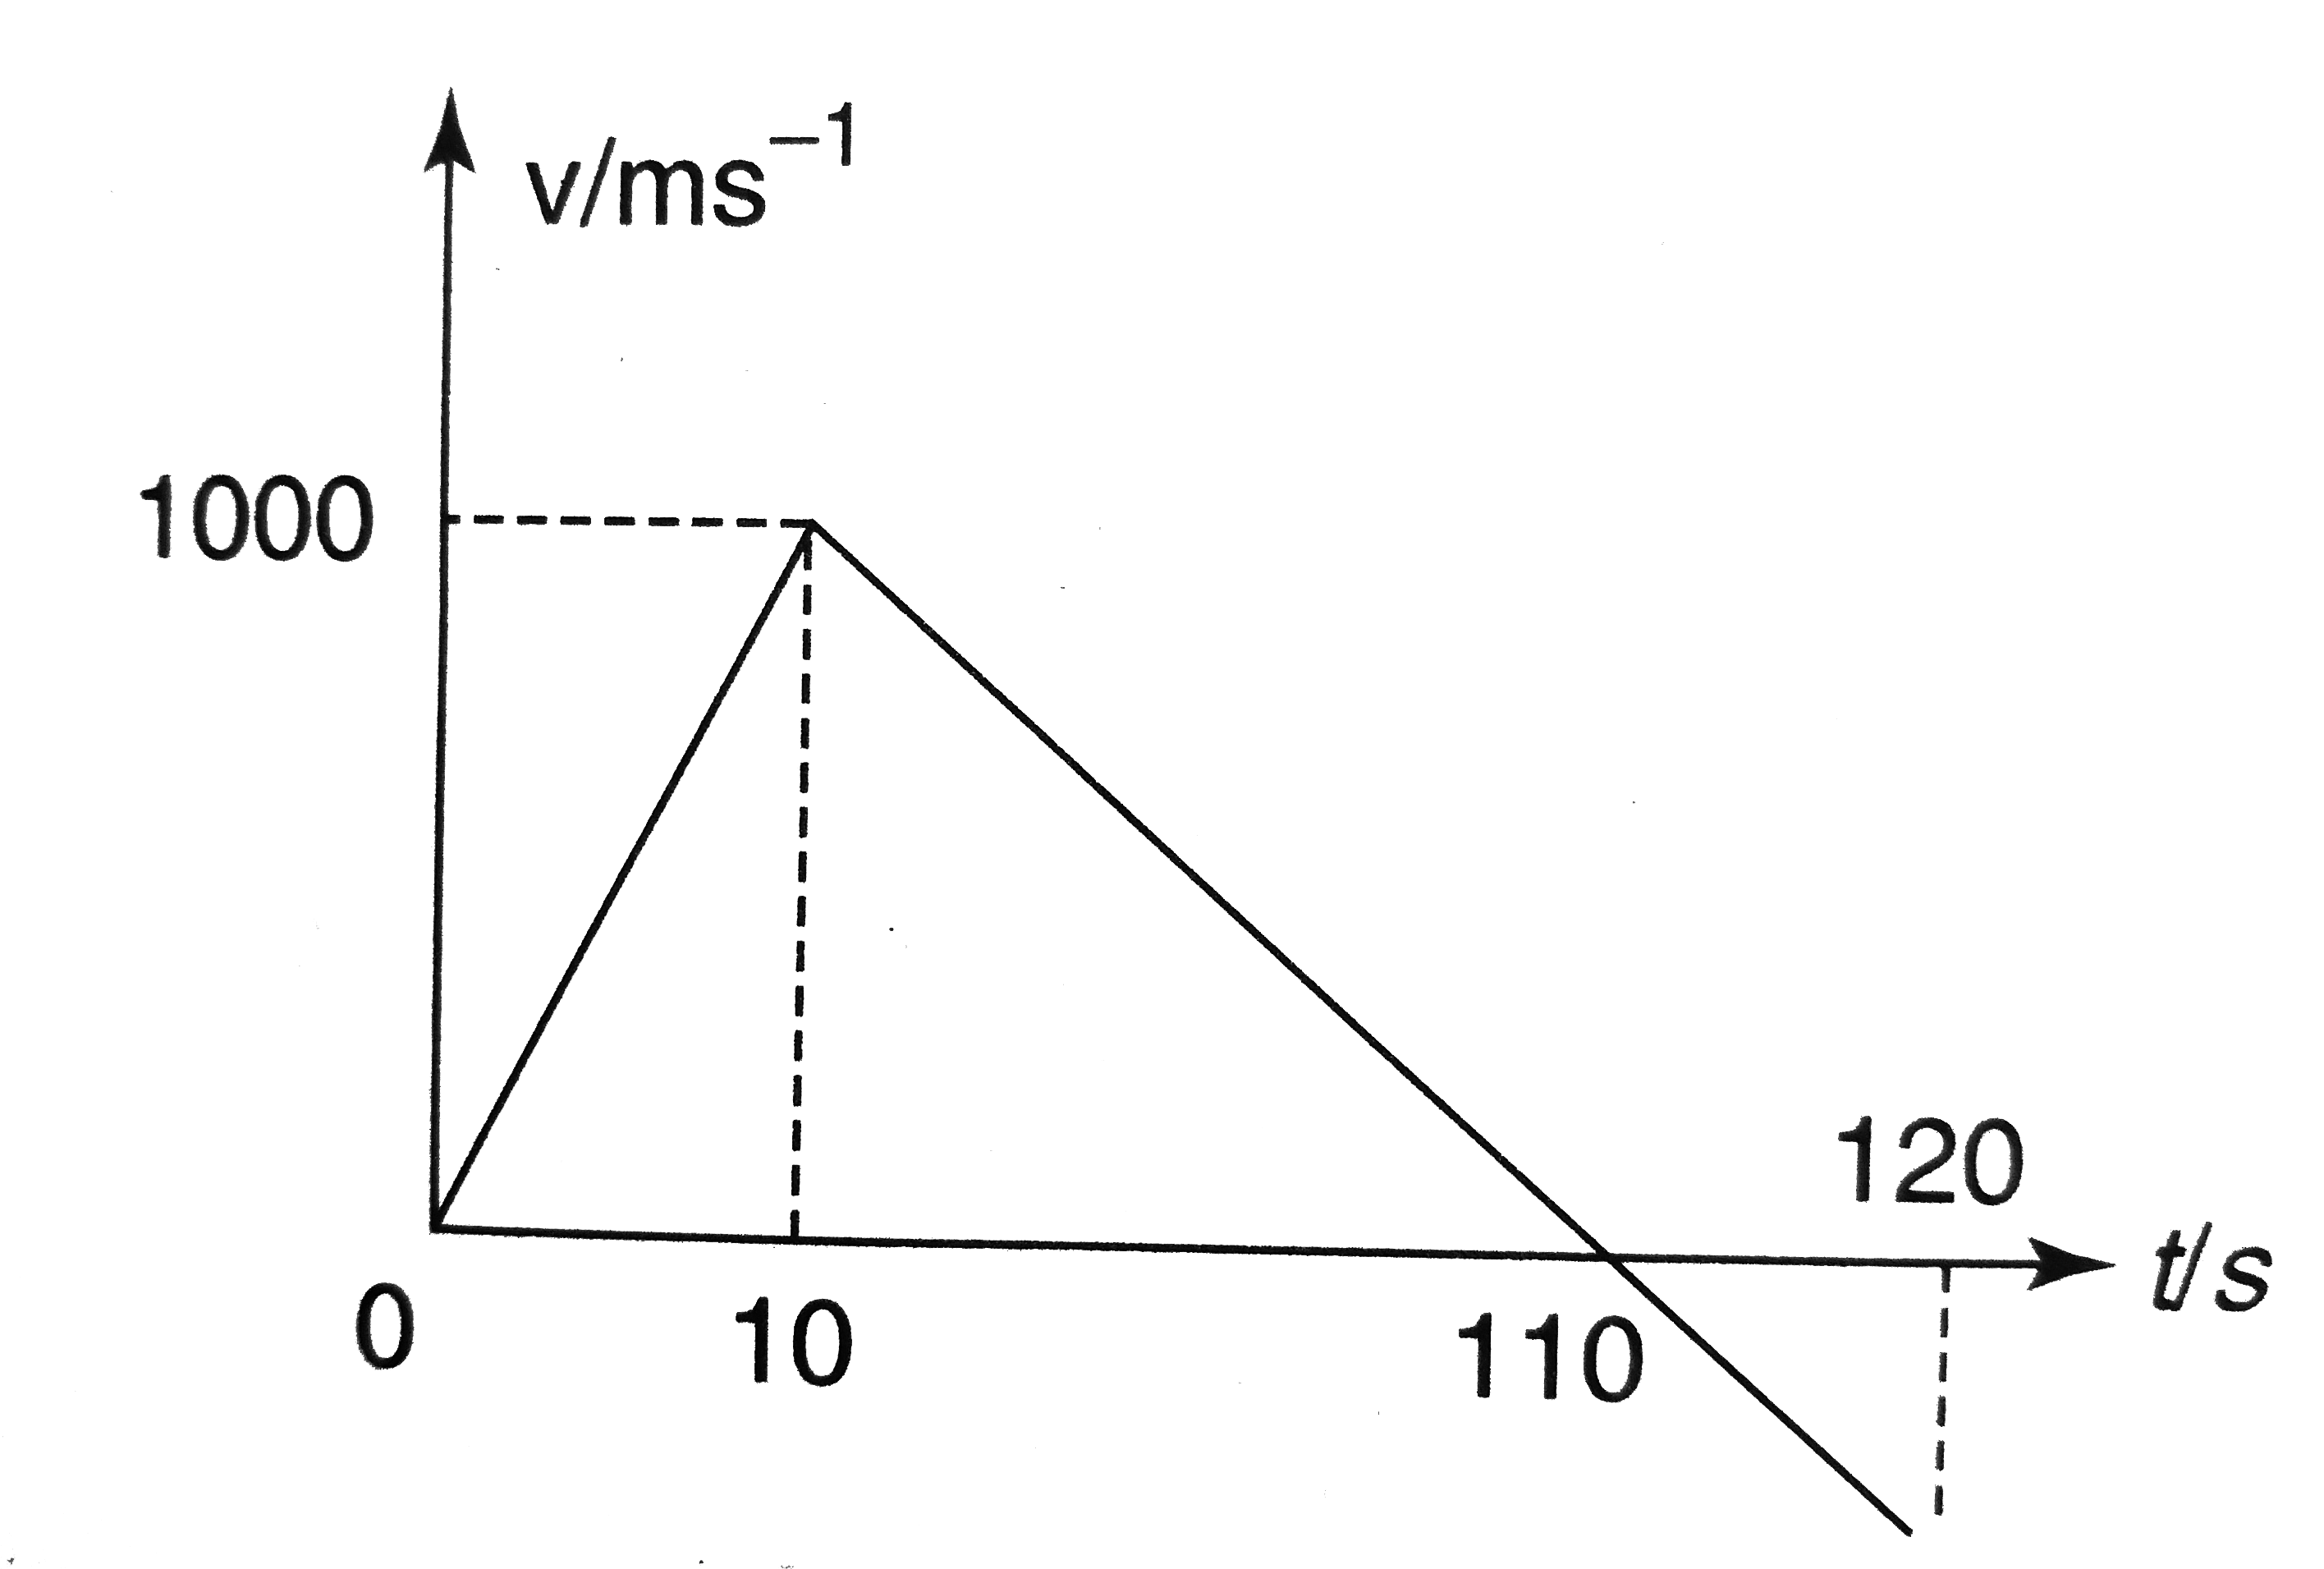
View SolutionThe acceleration of a particle starting from rest and travelling along a straight line is shown in figure. The maximum speed of the particle is
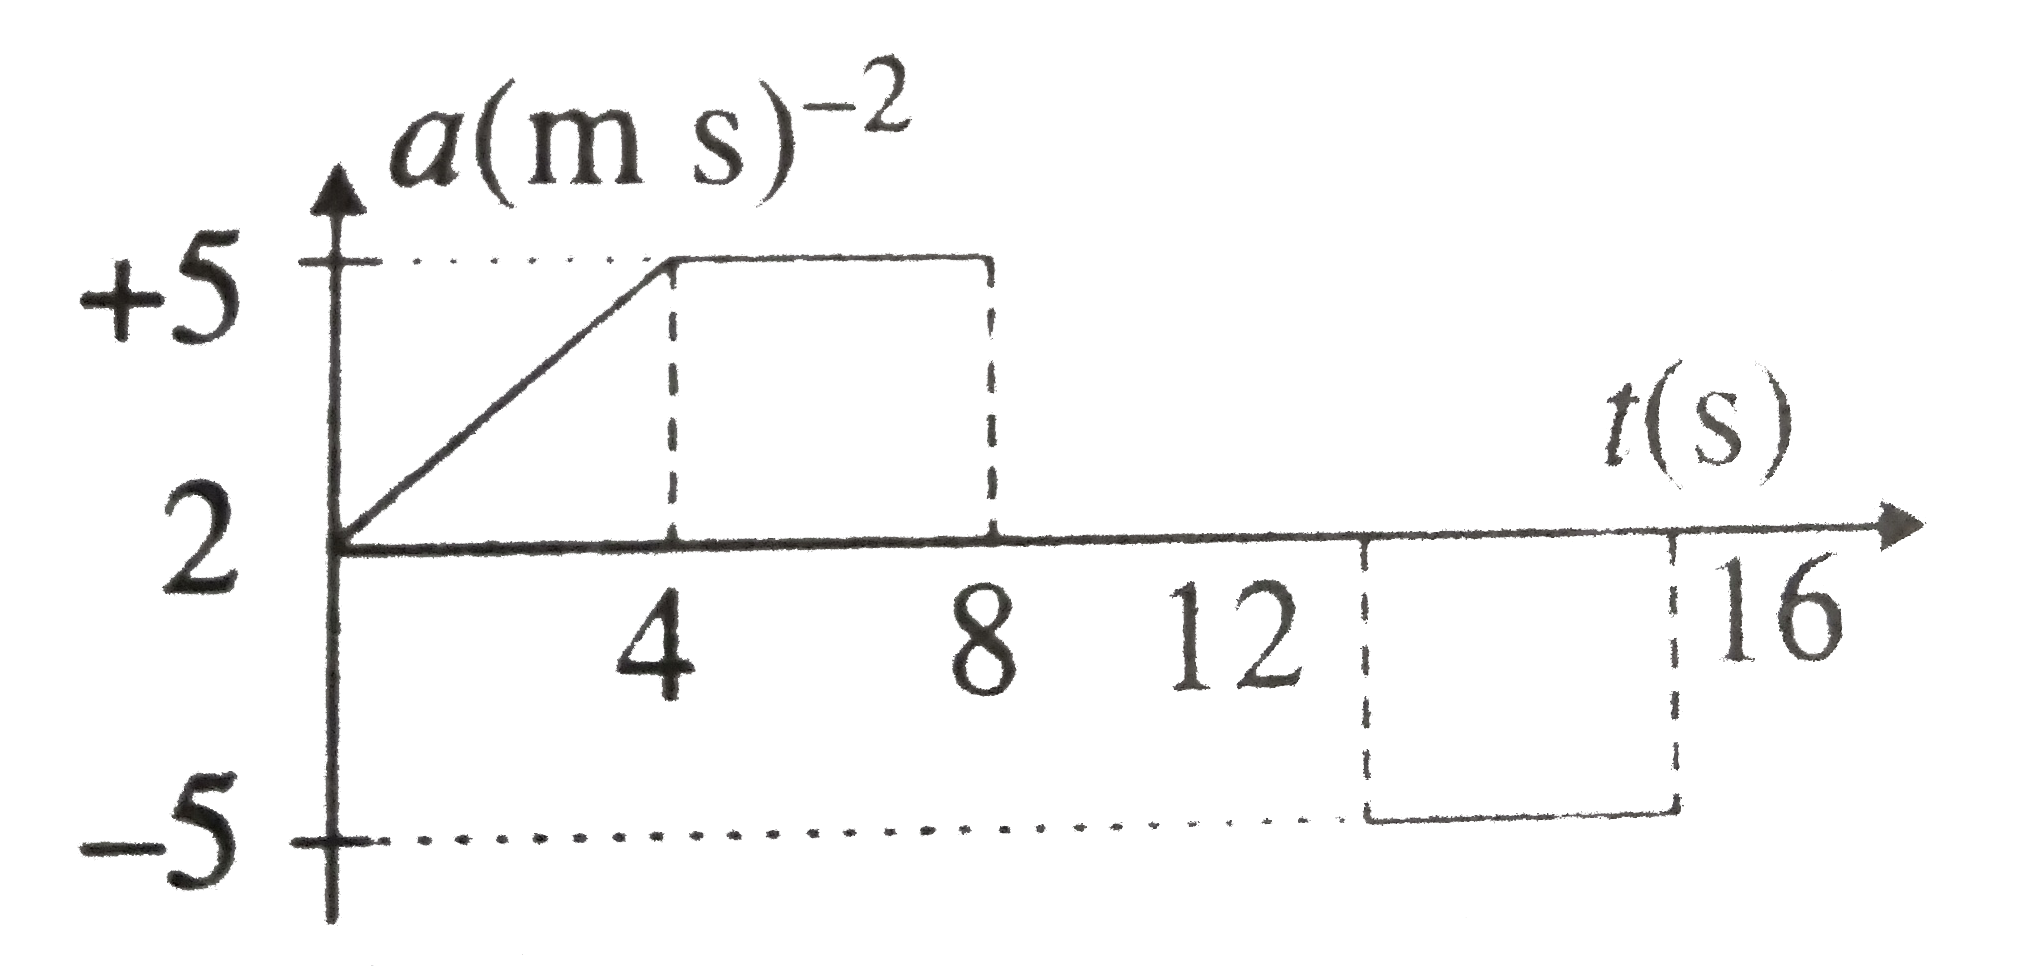
View SolutionA particle starting from rest. Its acceleration (a) versus time (t) is as shown in the figure.
The maximum speed of the particle will be.
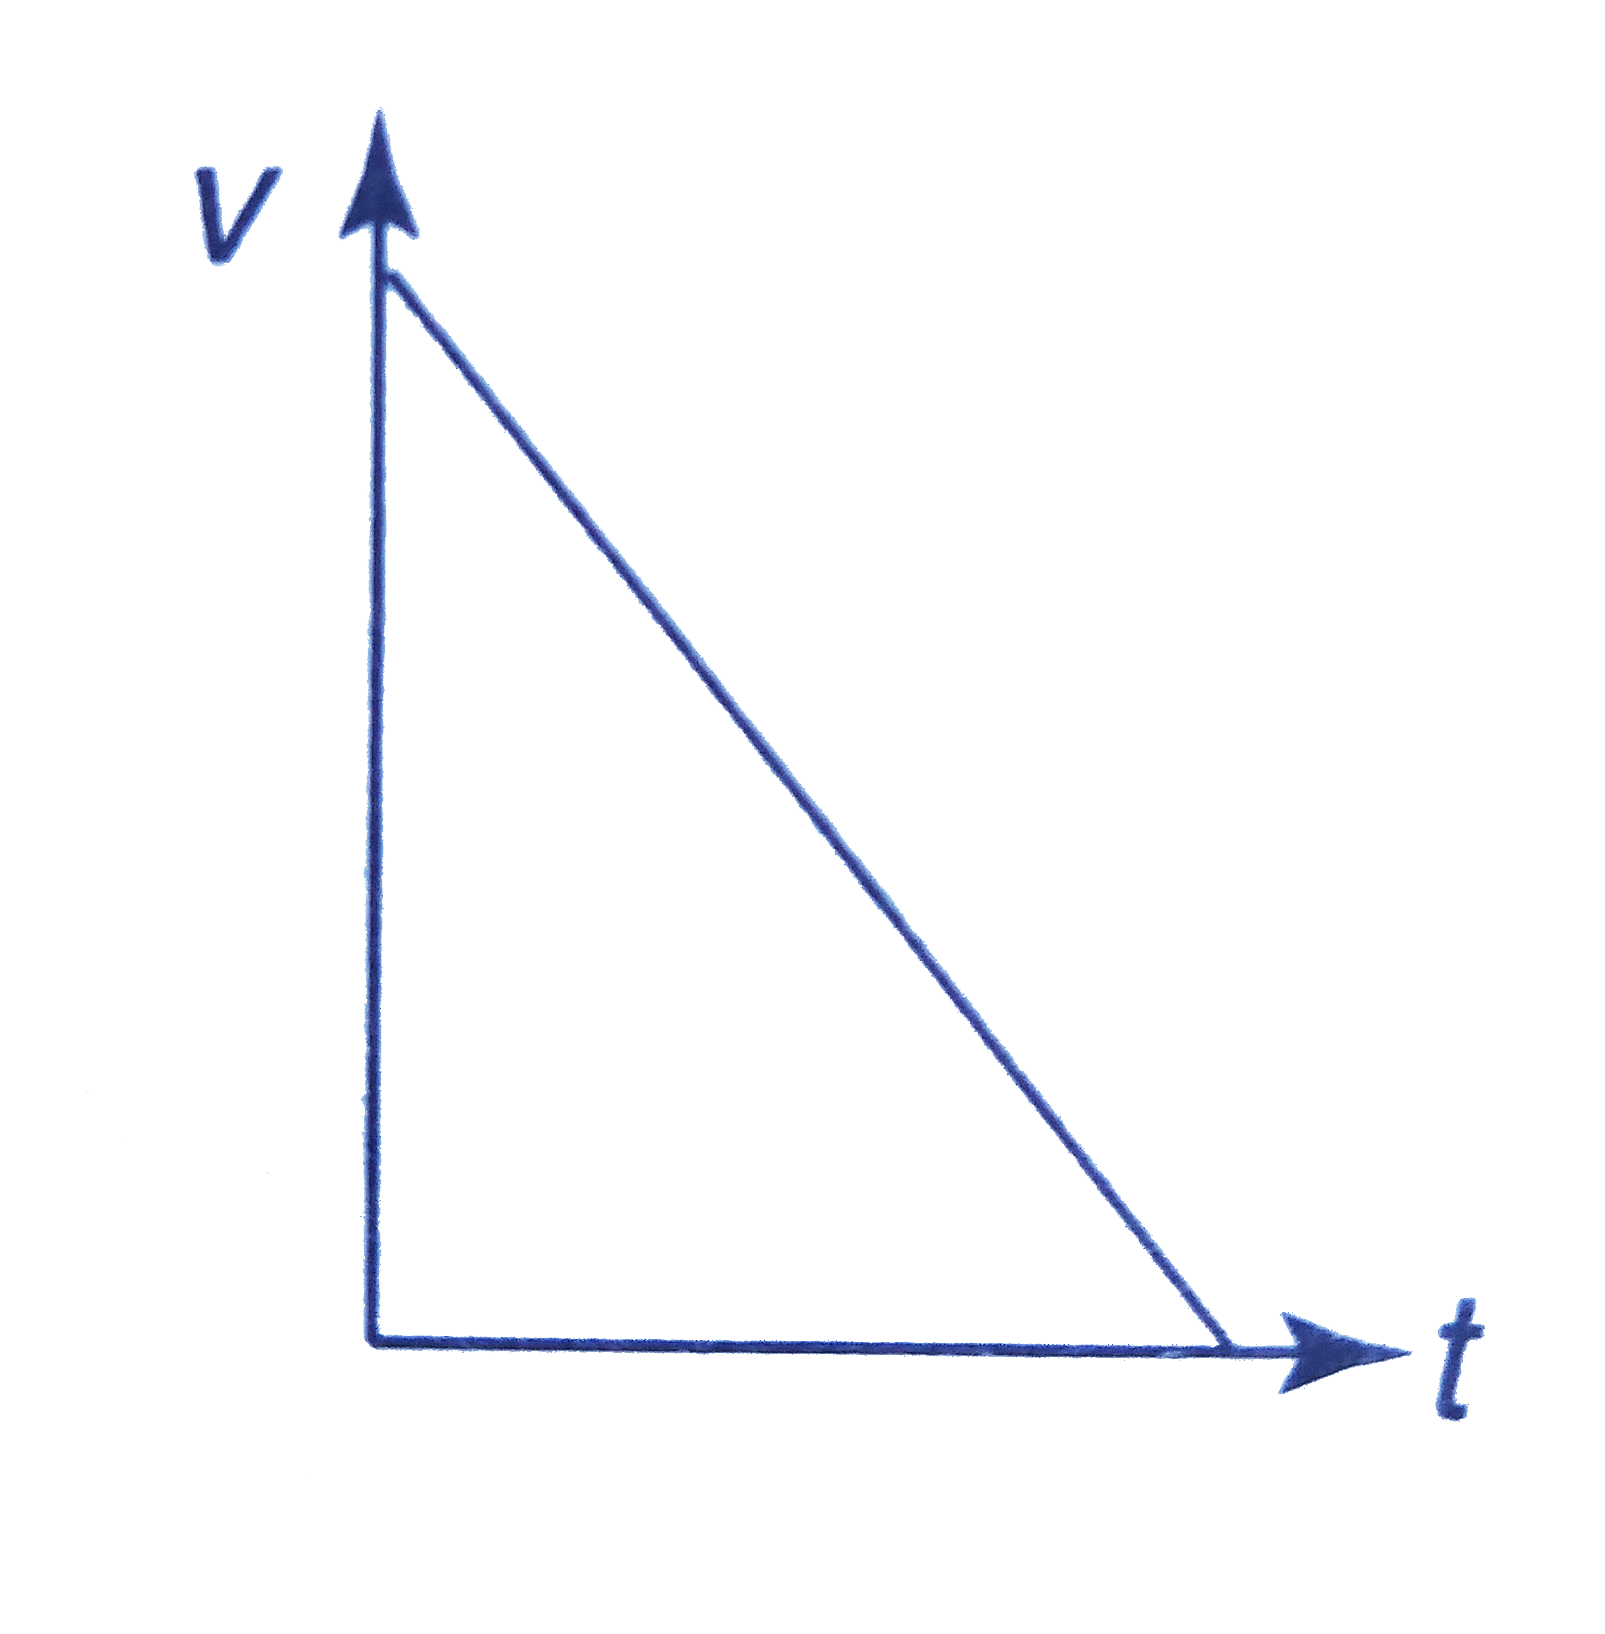
View SolutionFigure gives the velocity-time graph. This shows that the body is.
View SolutionA ball is thrown straight up with a velocity at `t = 0` and returns to earth at `t = t_1`. Which graph shows the correct motion ?
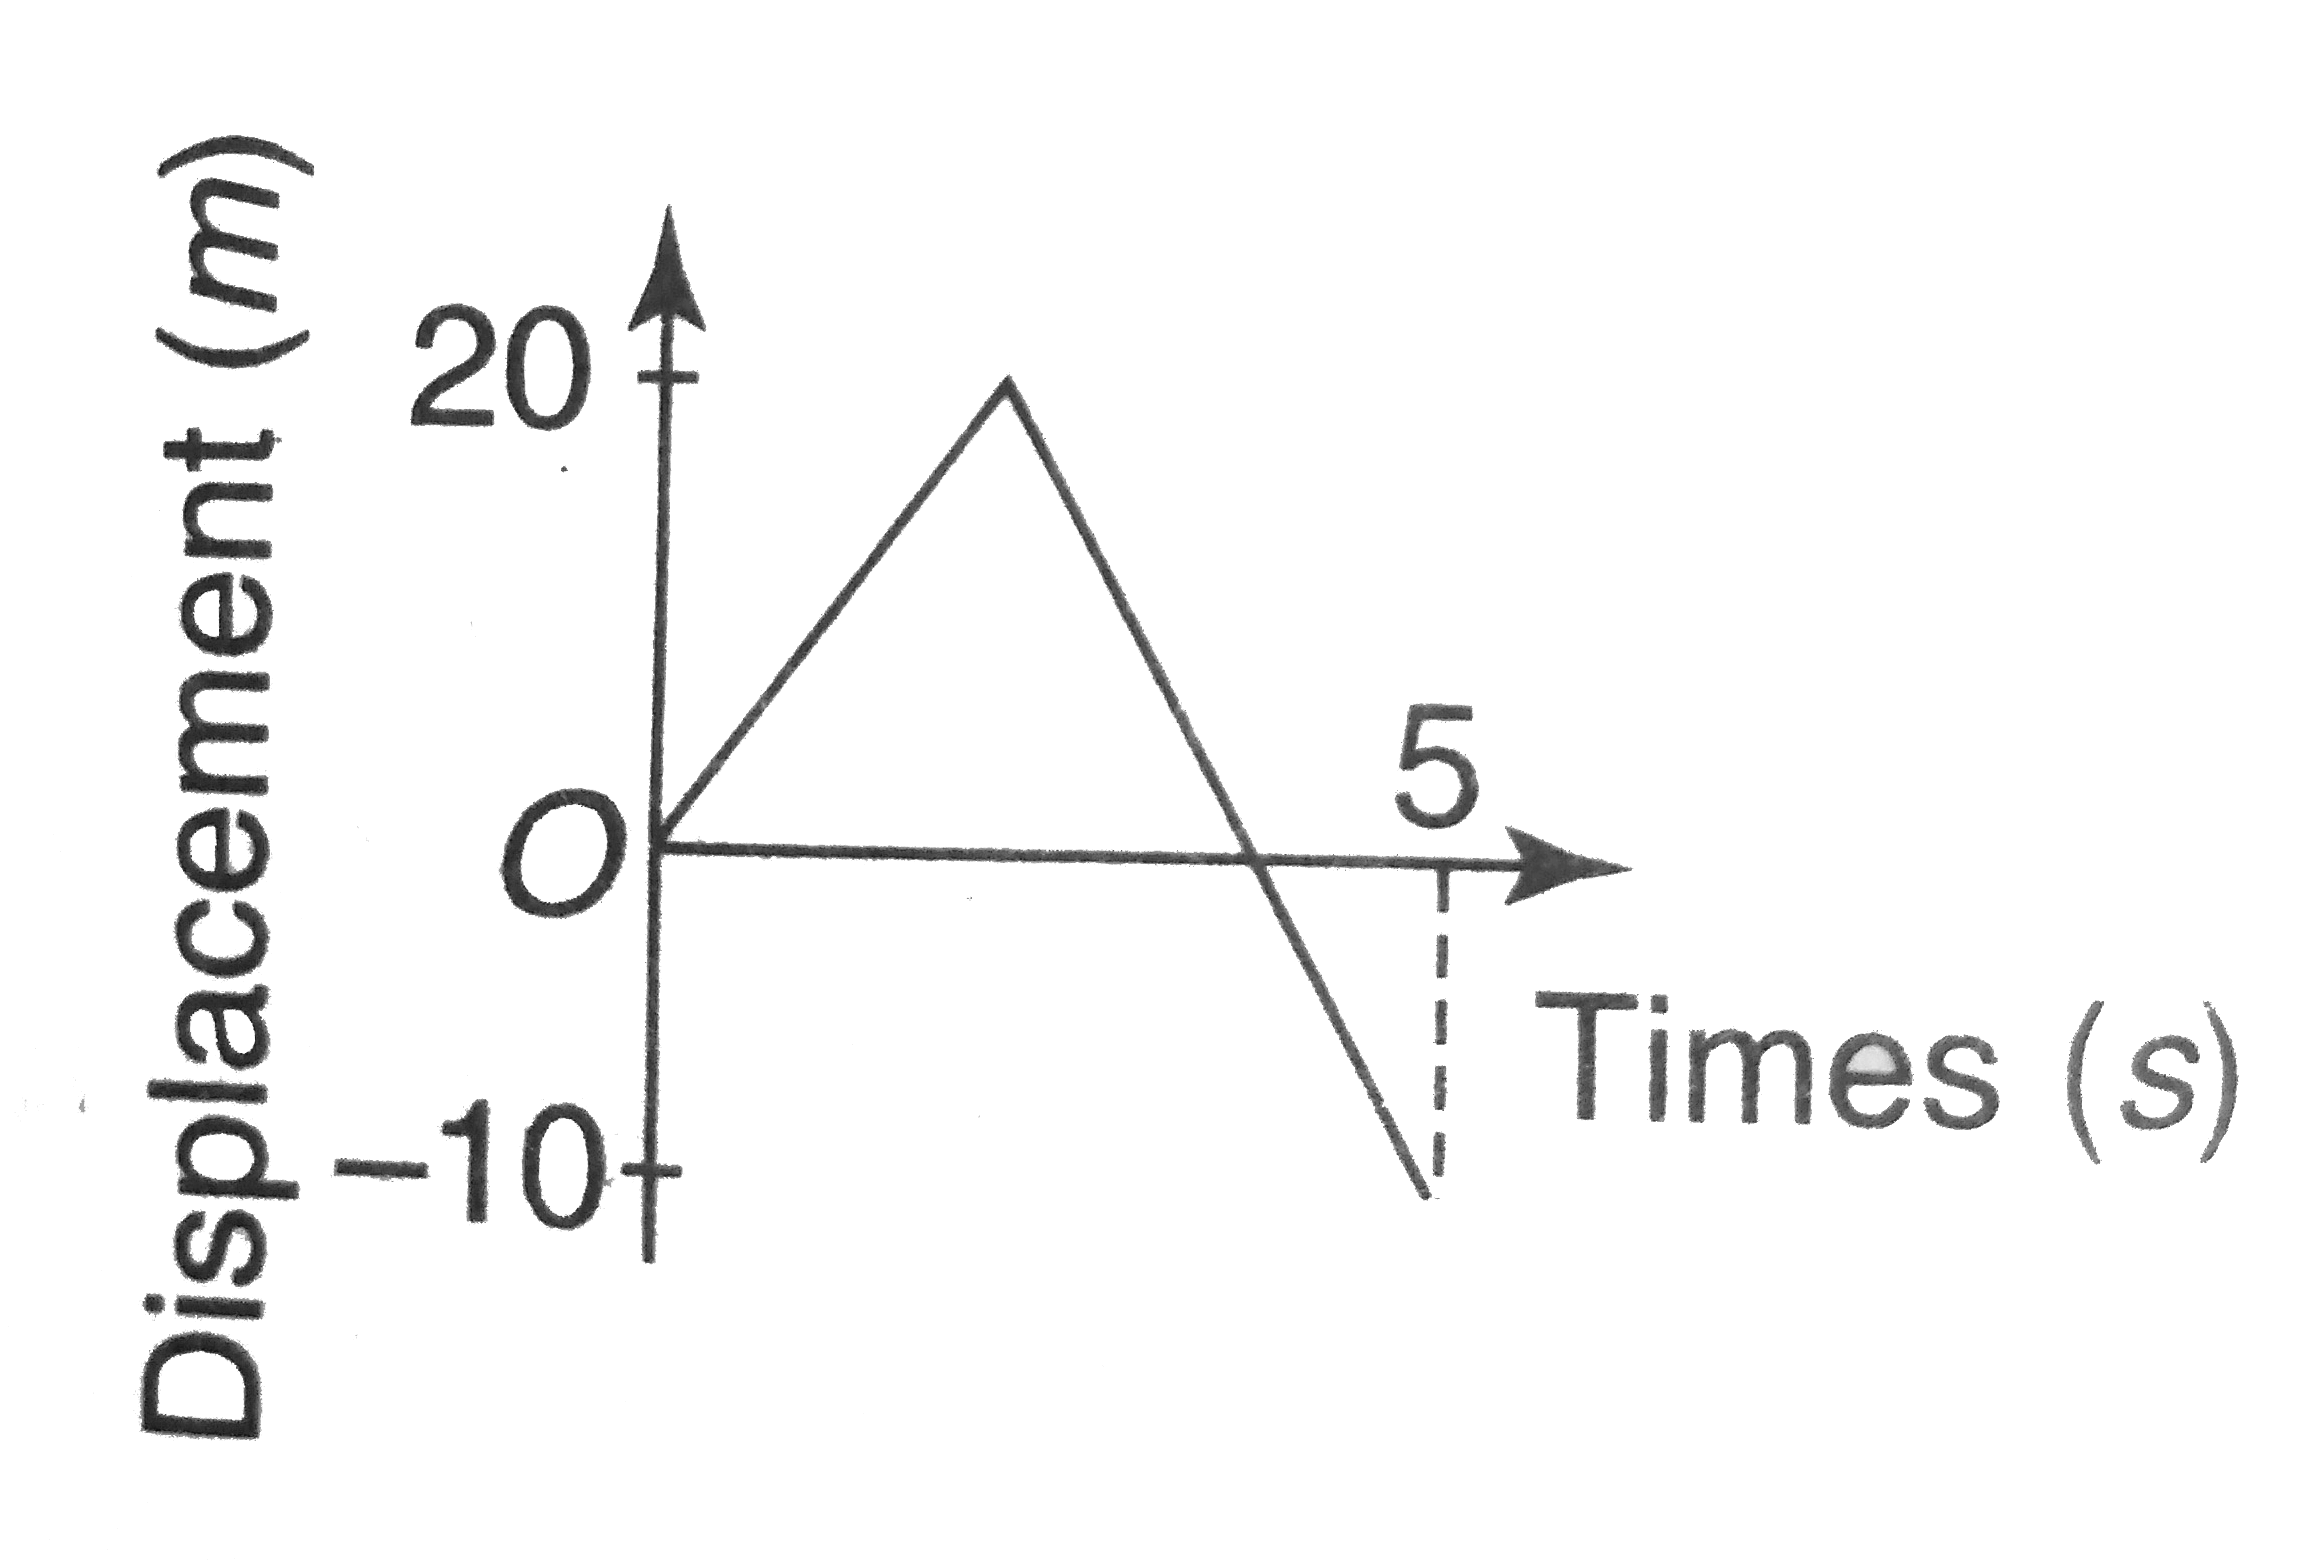
View SolutionThe diagram shows the displacement-time graph for a particle moving in a straight line. Find the average velocity for the interval from `t = 0` to `t = 5 s`.
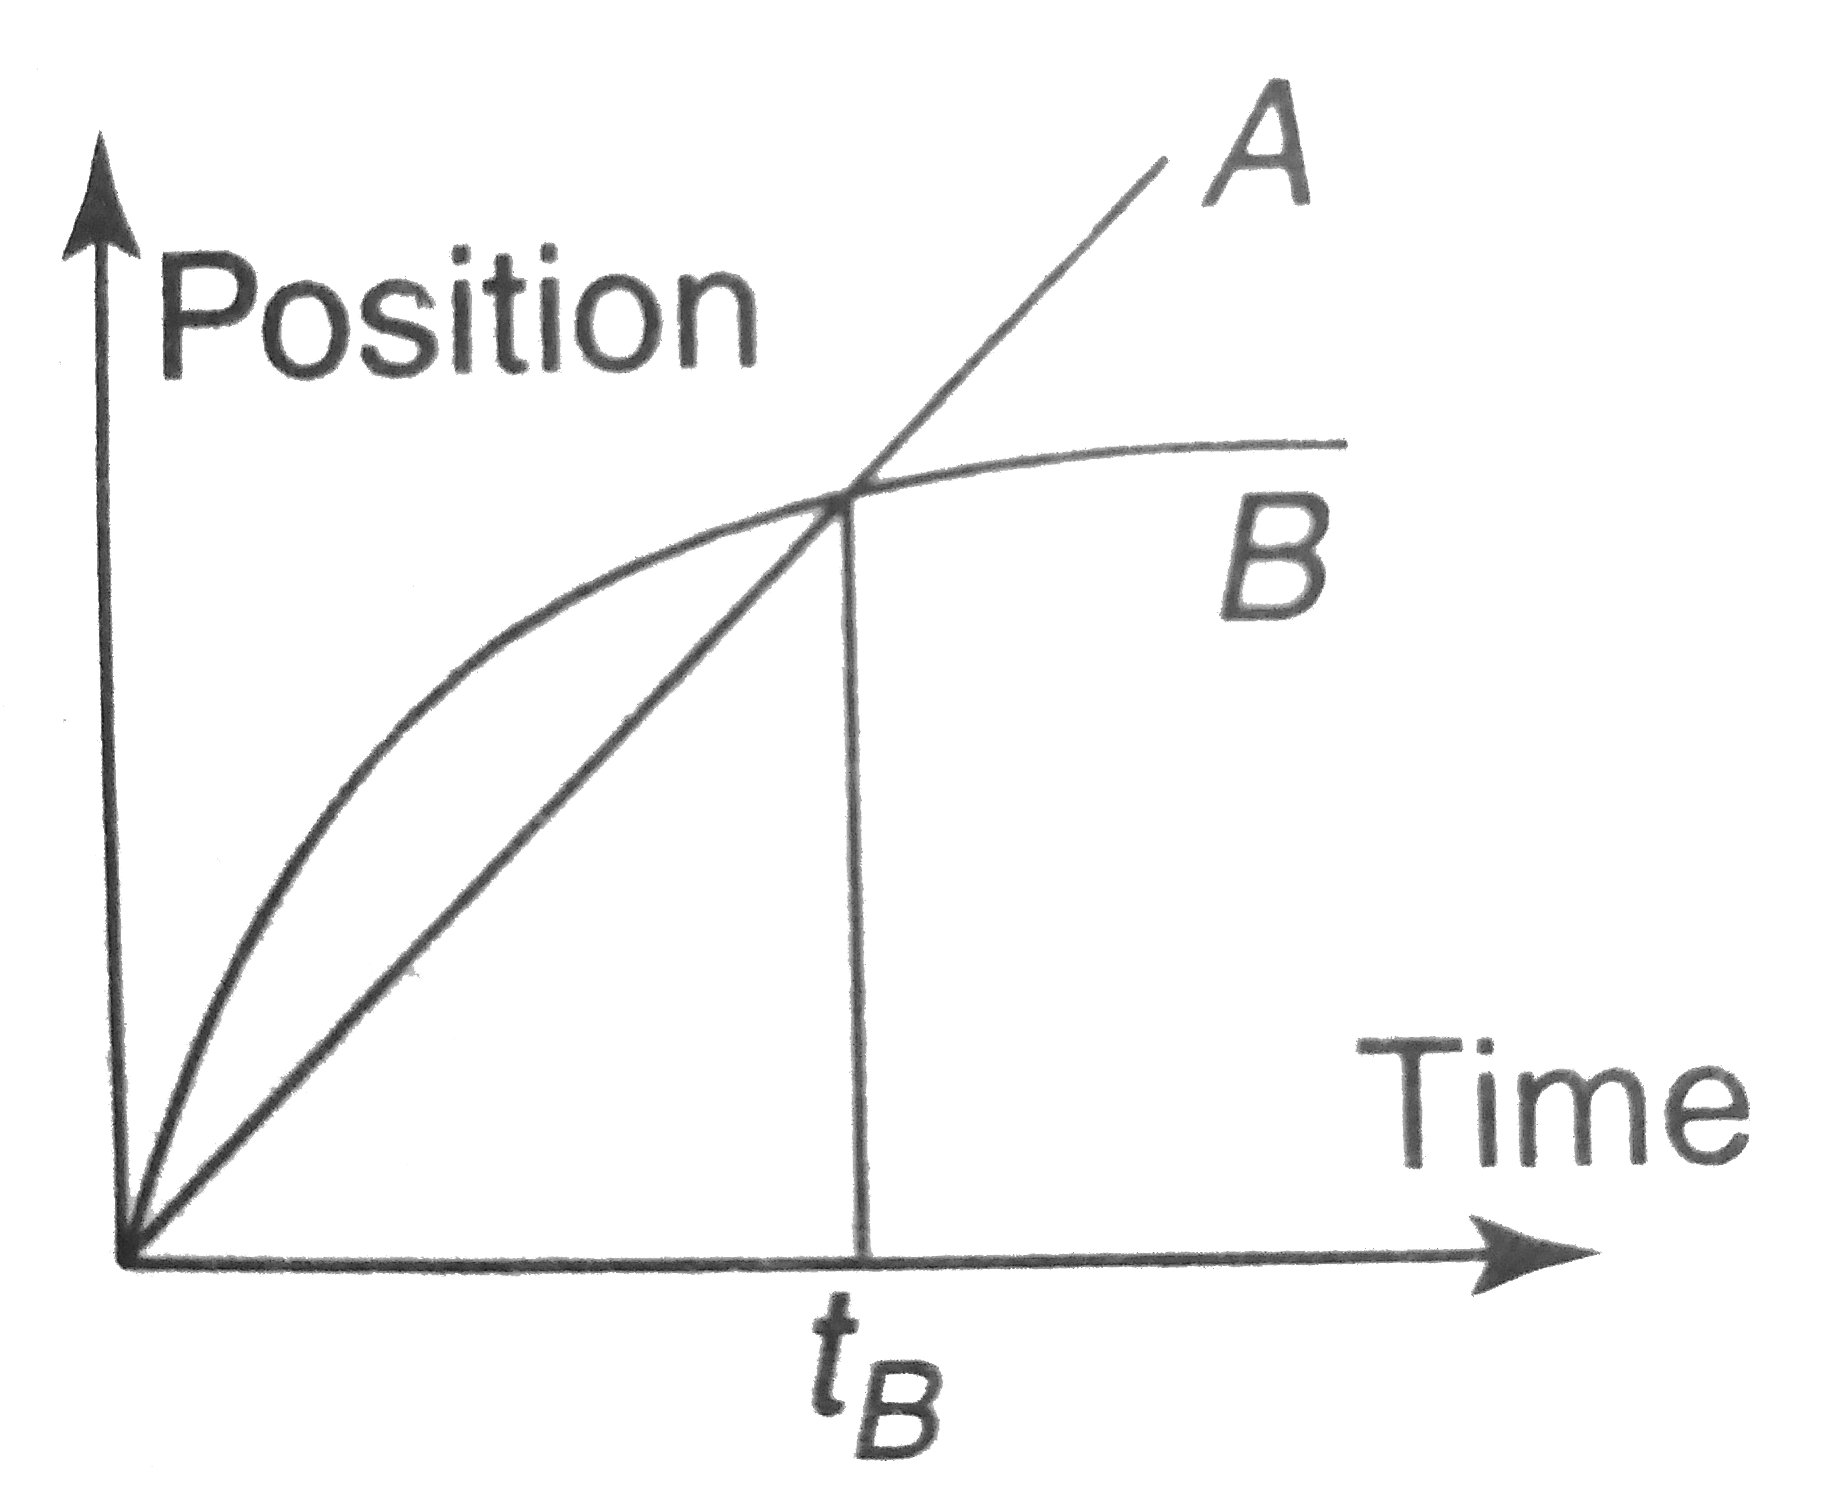
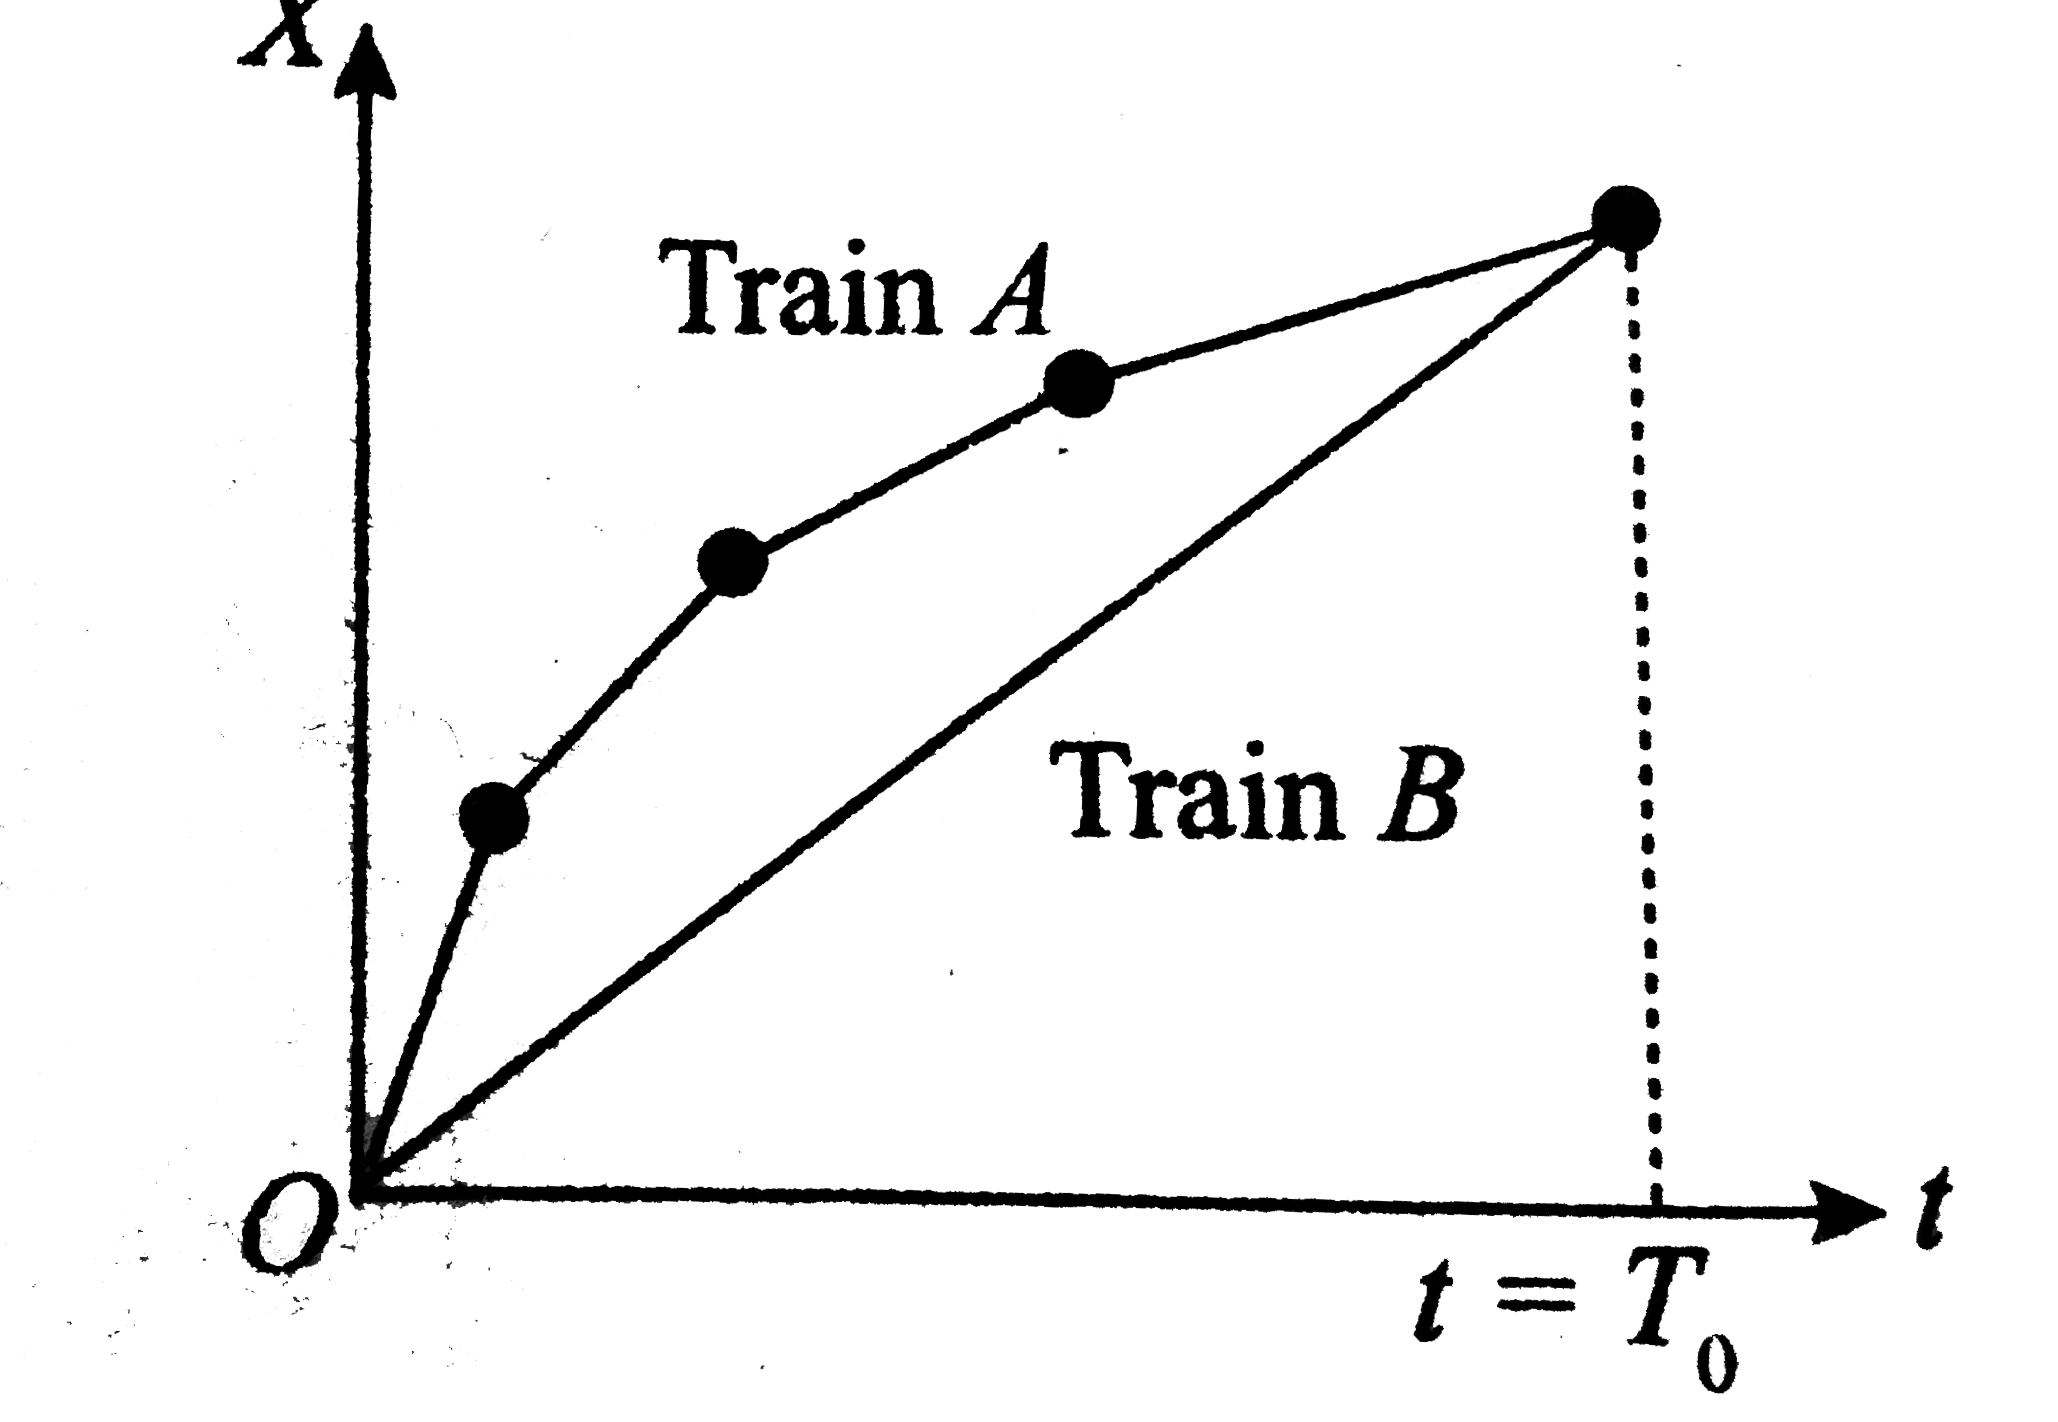
View SolutionThe graph shows position as a function of time for two trains running on parallel tracks. Which statement is true ?
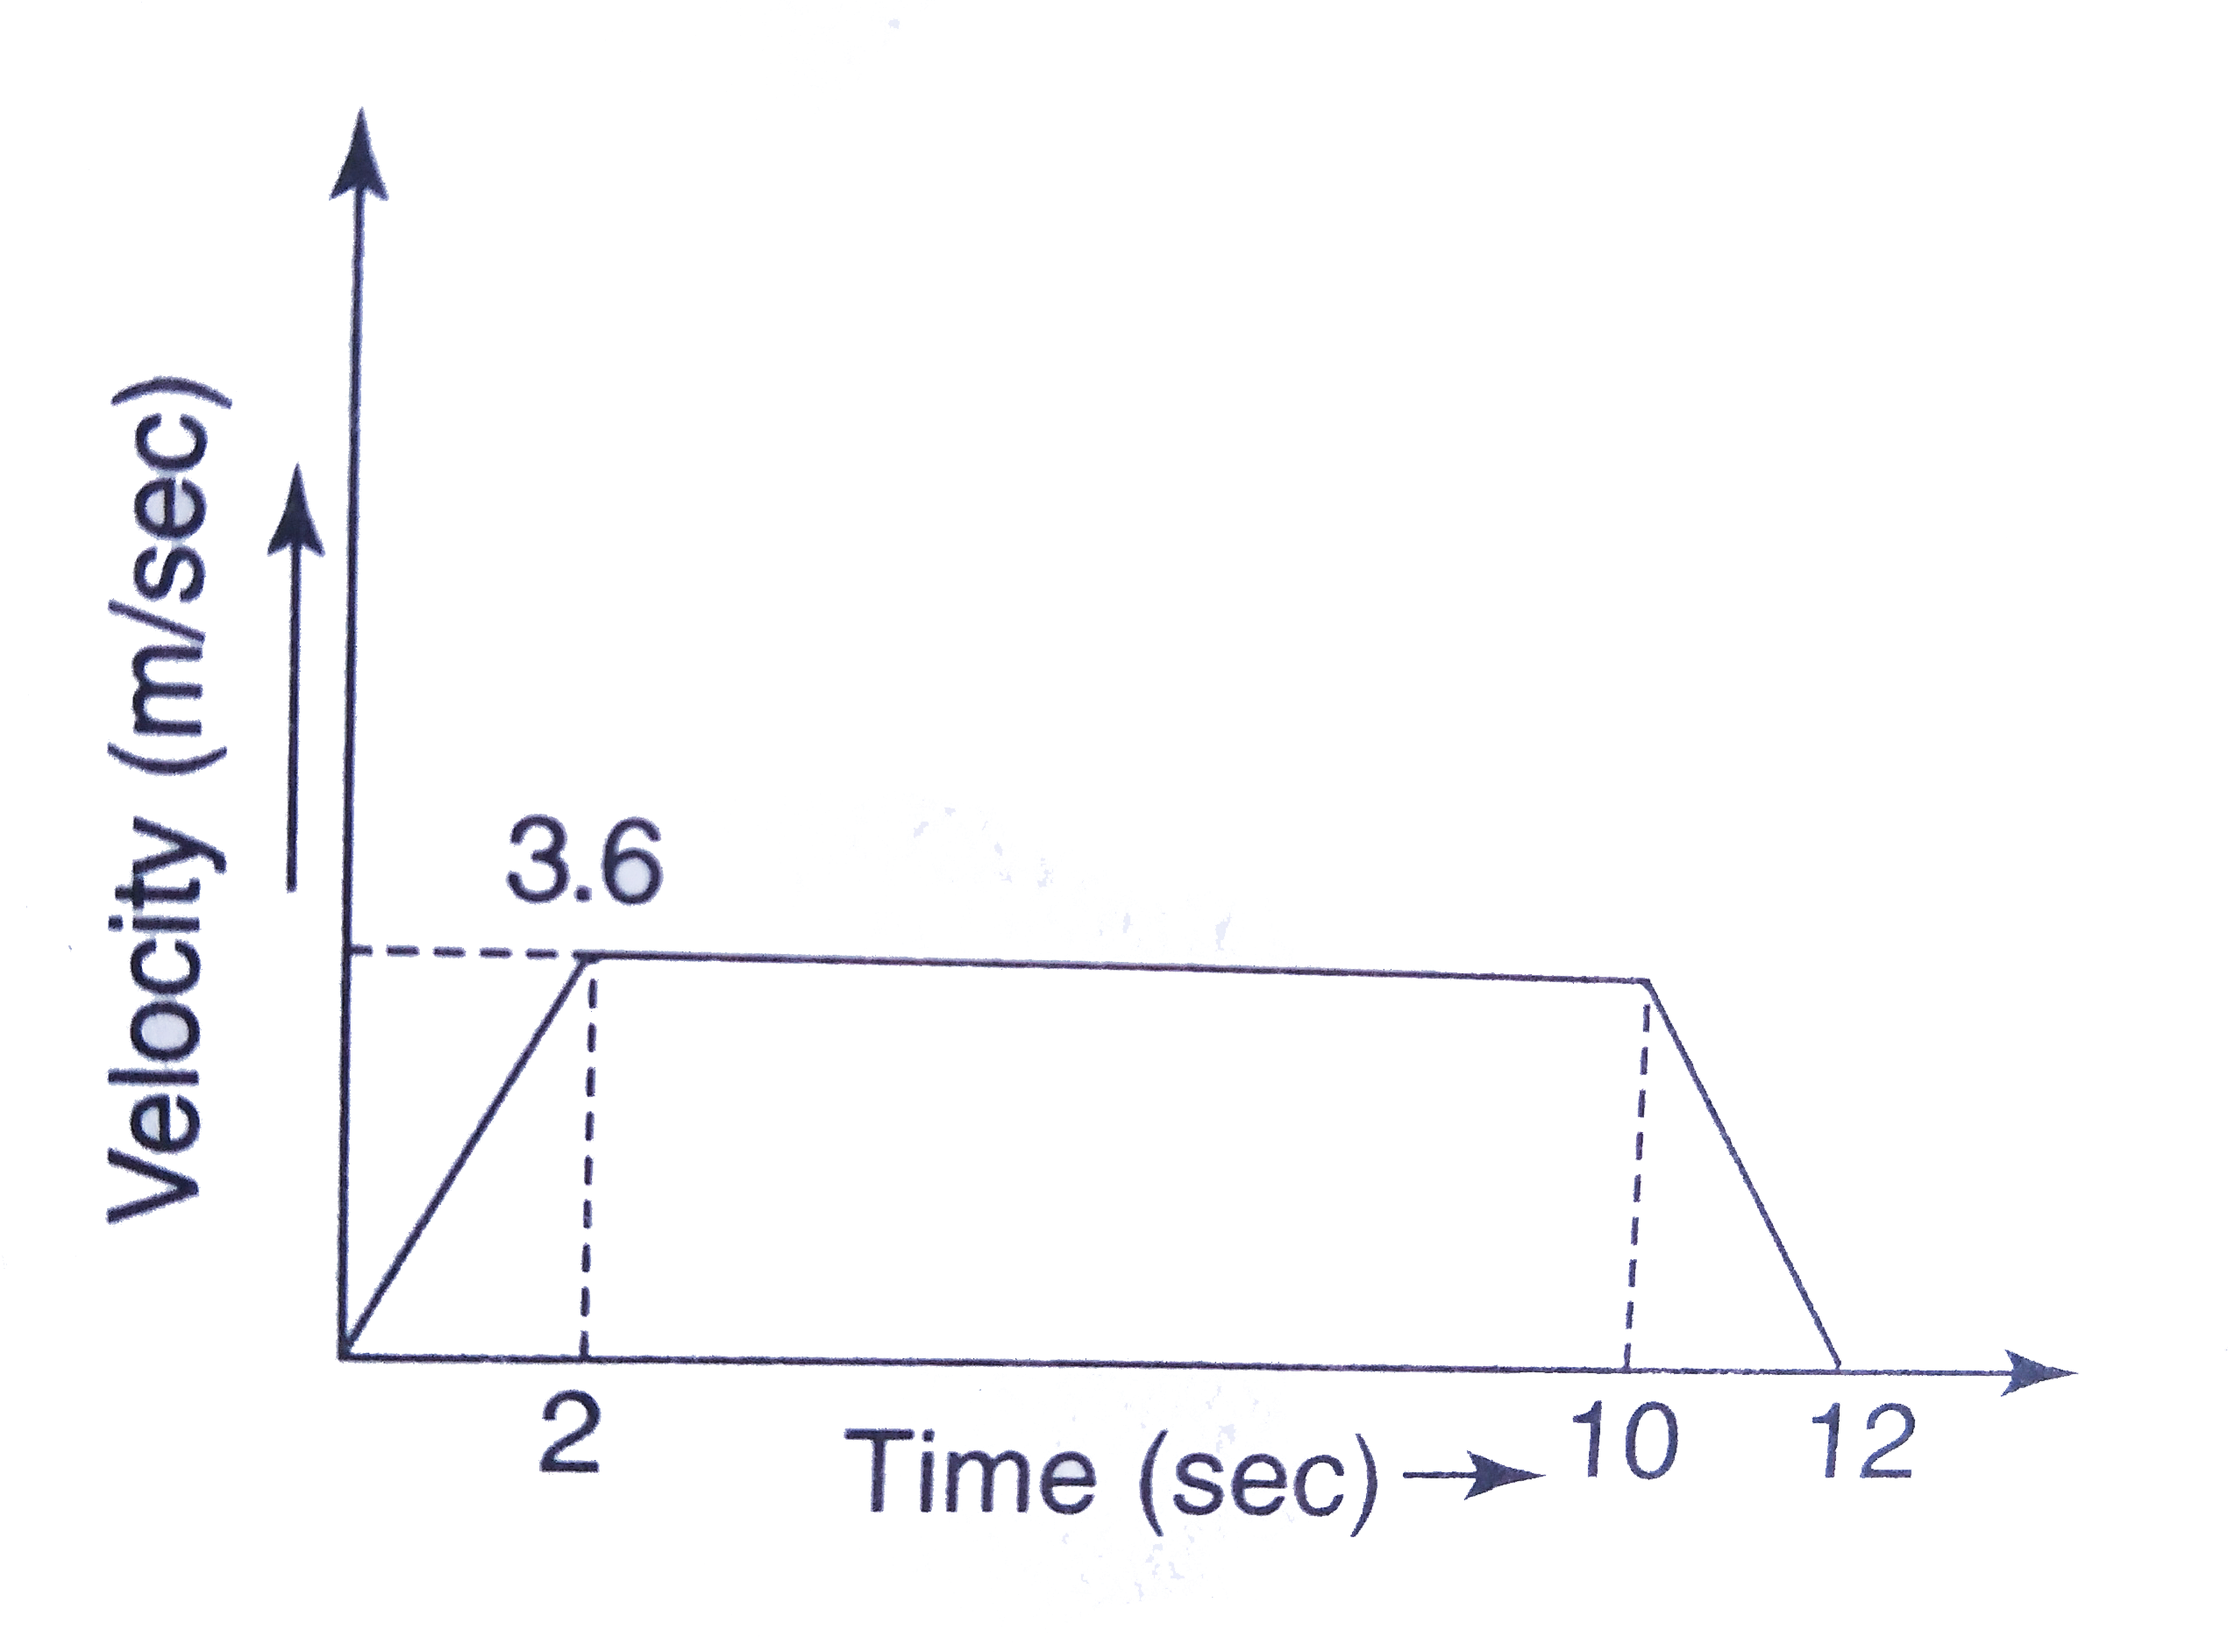
View SolutionA lift is going up. The variation in the speed of the lift is as given in the graph in the graph. What is the height to which the lift takes the passengers ?
View SolutionAcceleration versus time graph for four objects are shown below. All axes have the same scale. Which object had the greatest change in velocity during the interval ?
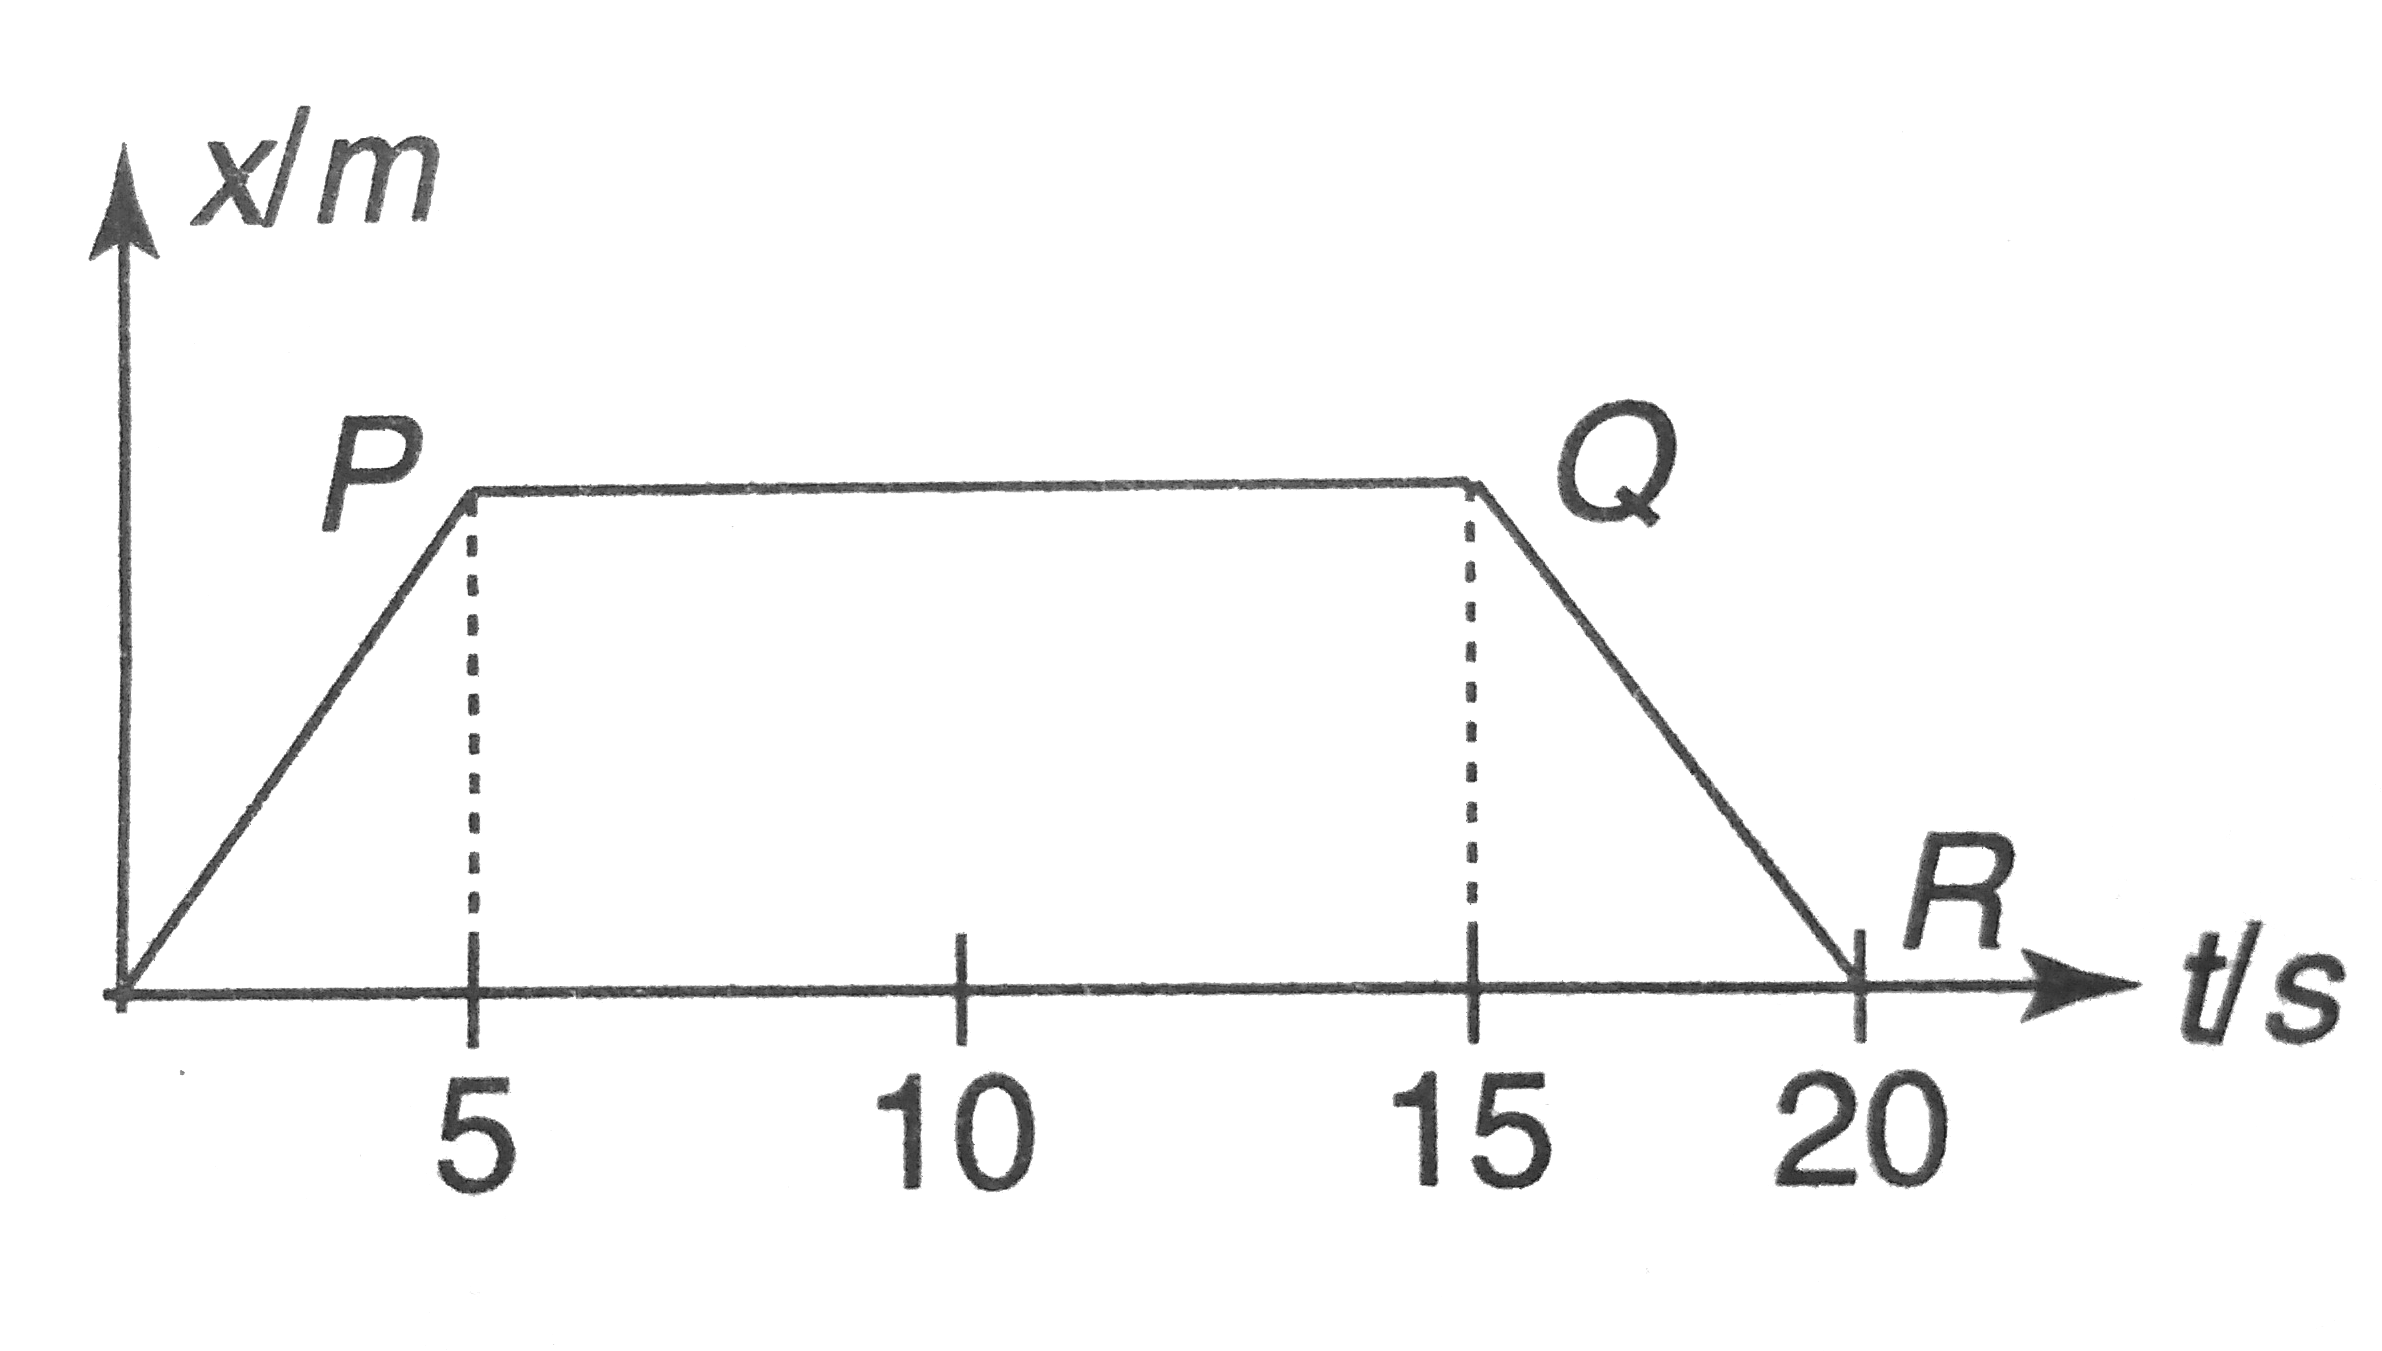
View SolutionFigure shows the position the graph for a particle in one dimensional motion. Which of the graphs in fugure represent the variation in the velocity of the particle with time ?
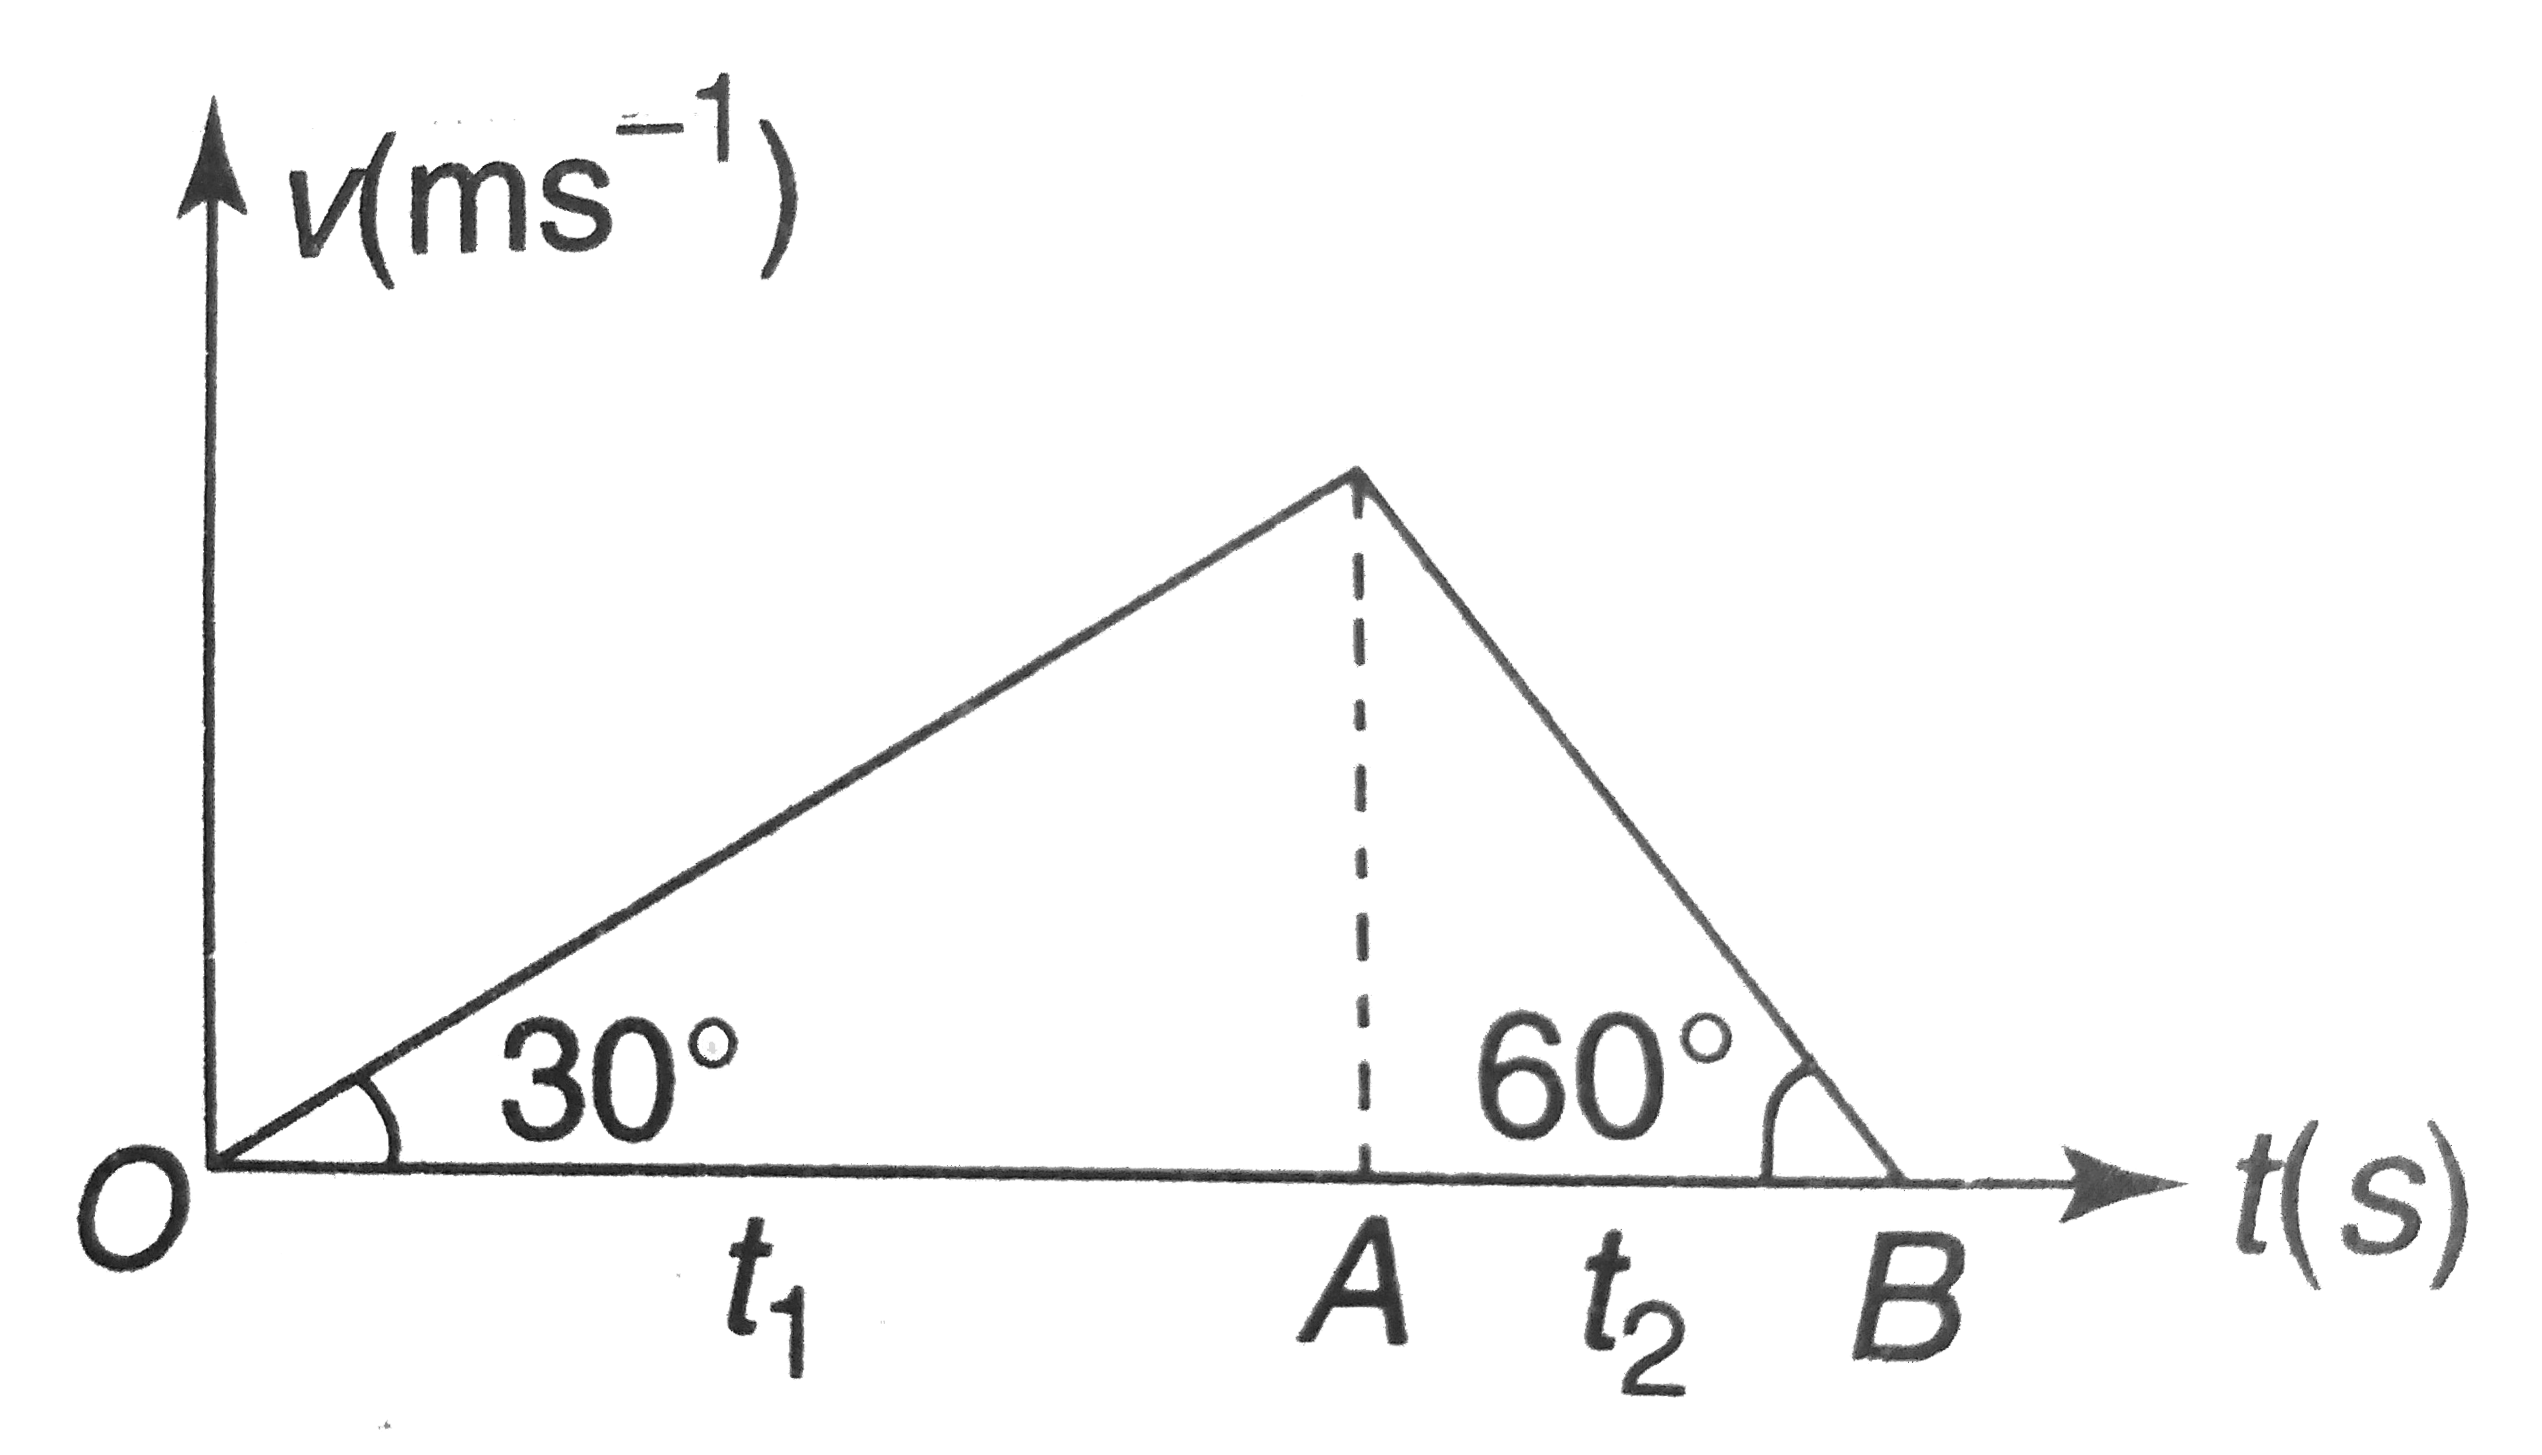
View SolutionThe velocity time graph of a body moving along a straight line is shown in figure. The ratio of the average velocities during the time `t_1` and `t_2` is.
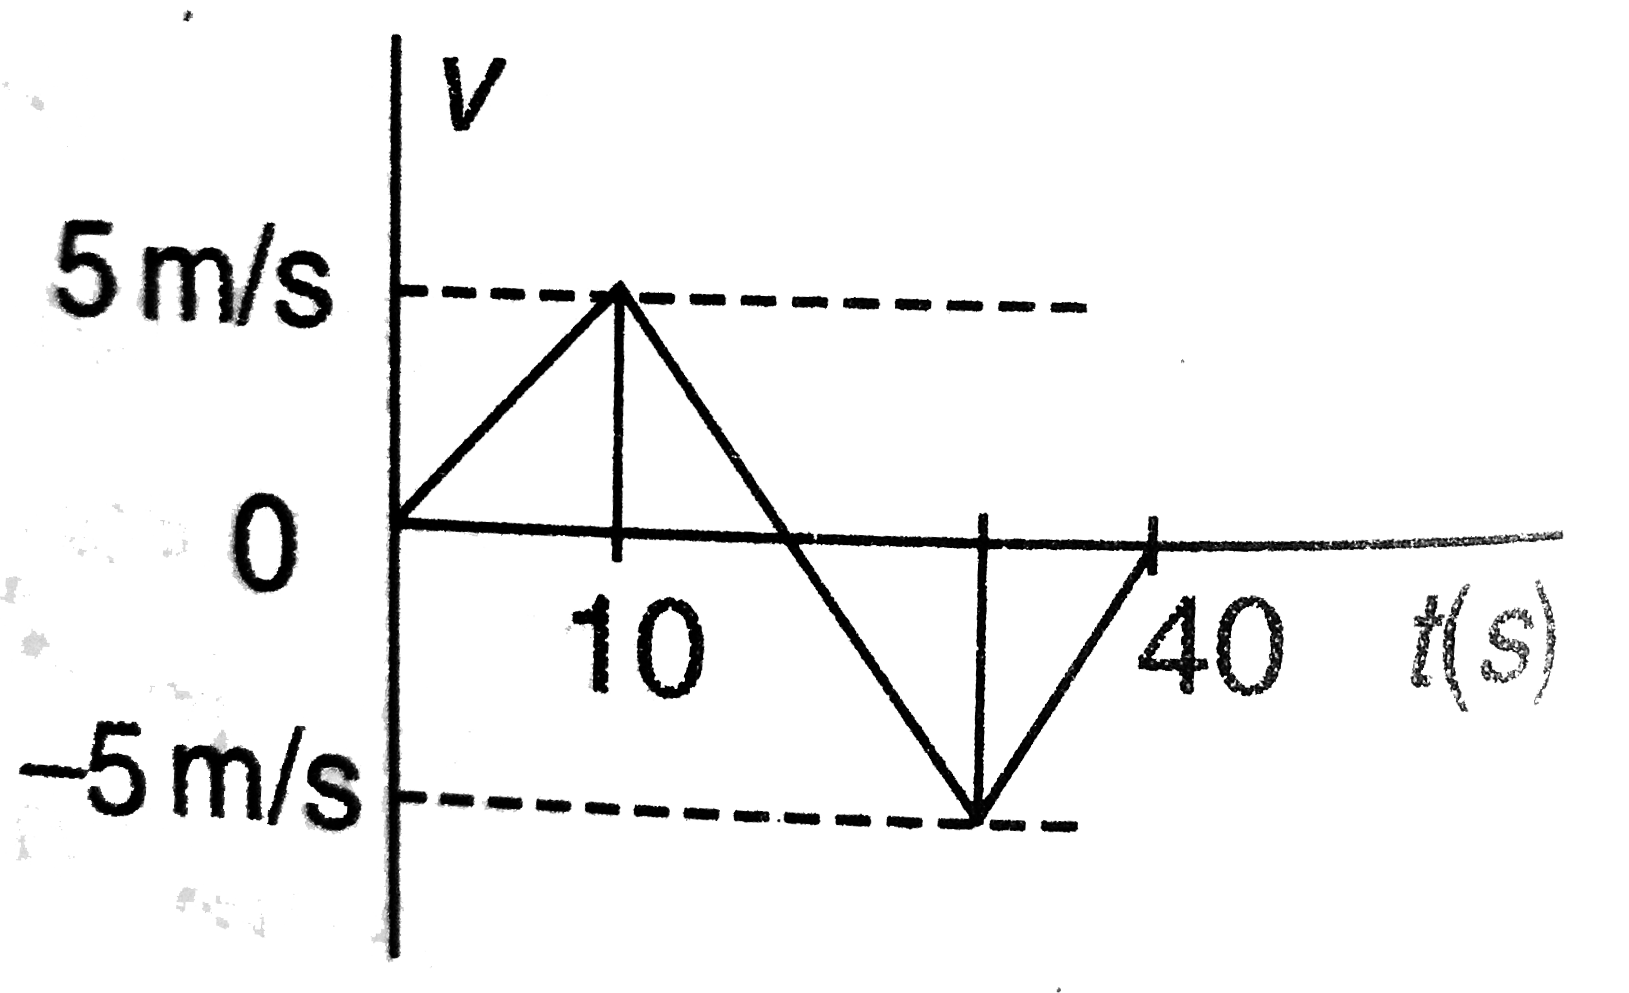
View SolutionThe velocity-time plot is shown in figure. Find the average speed in time interval `t = 0` to `t = 40 s` during the period.
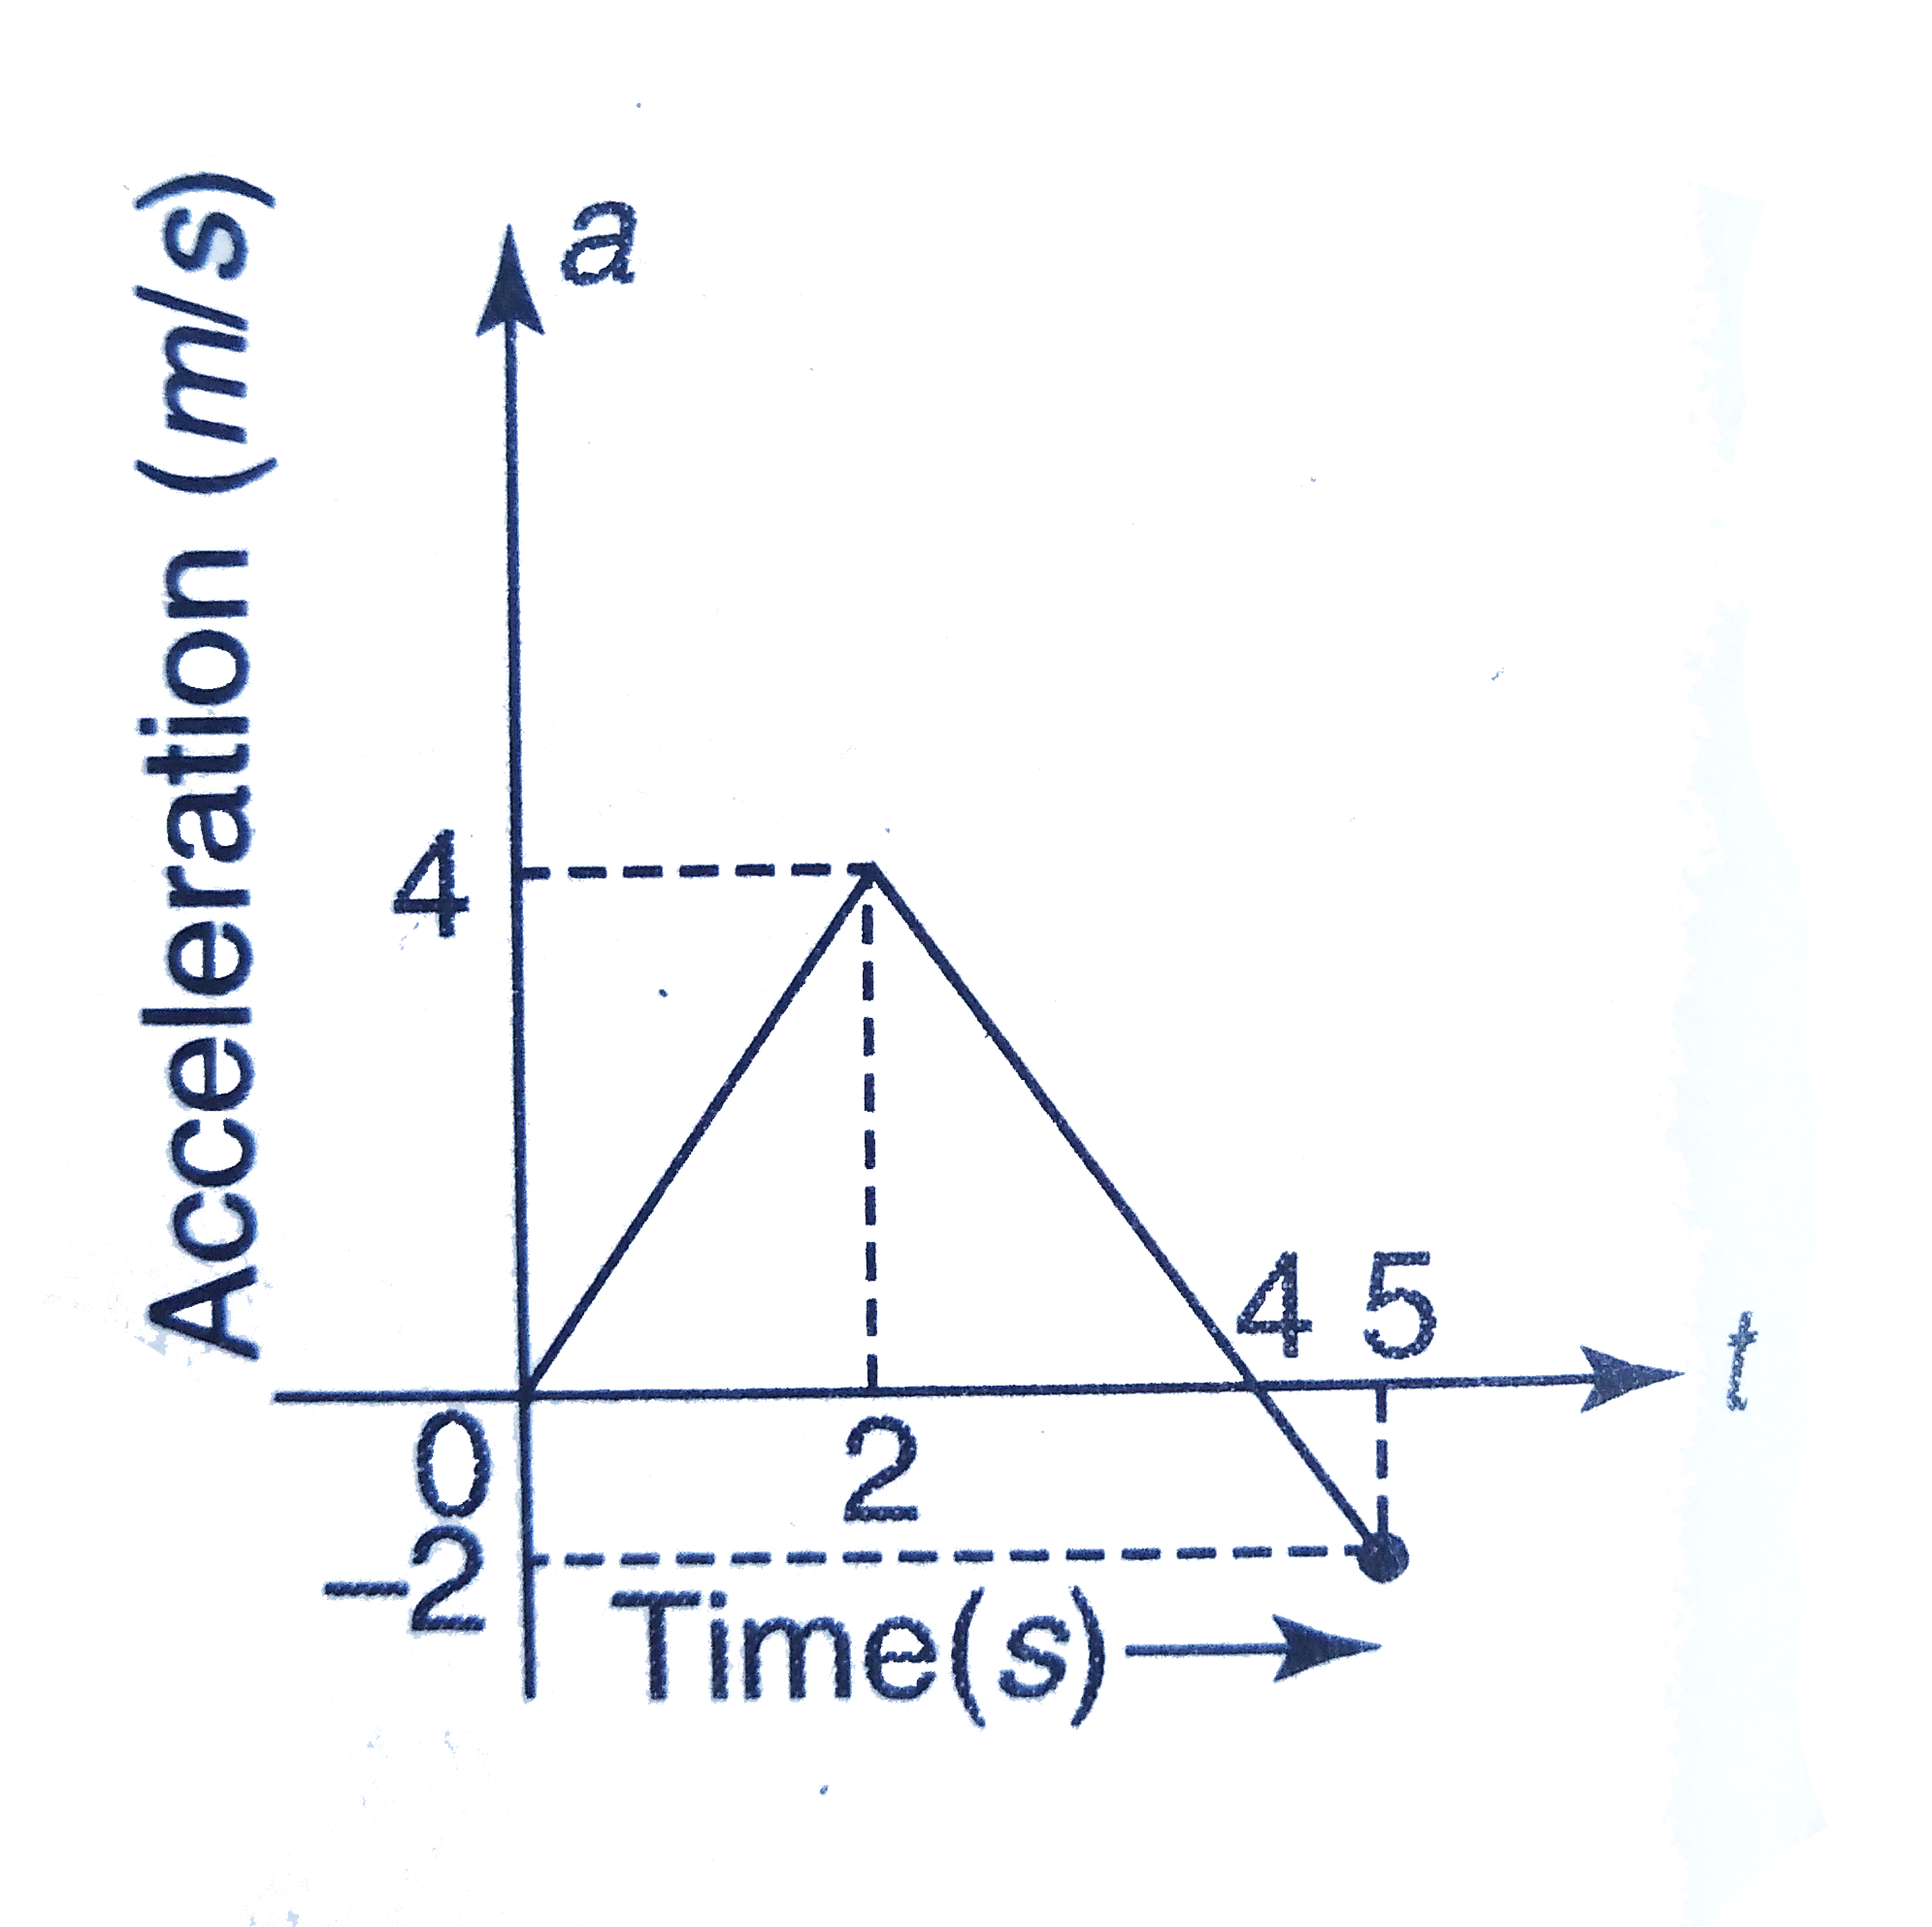
View SolutionFigure shows the graph of acceleration of particle as a function of time. The maximum speed of the particle is (particle starts from rest).
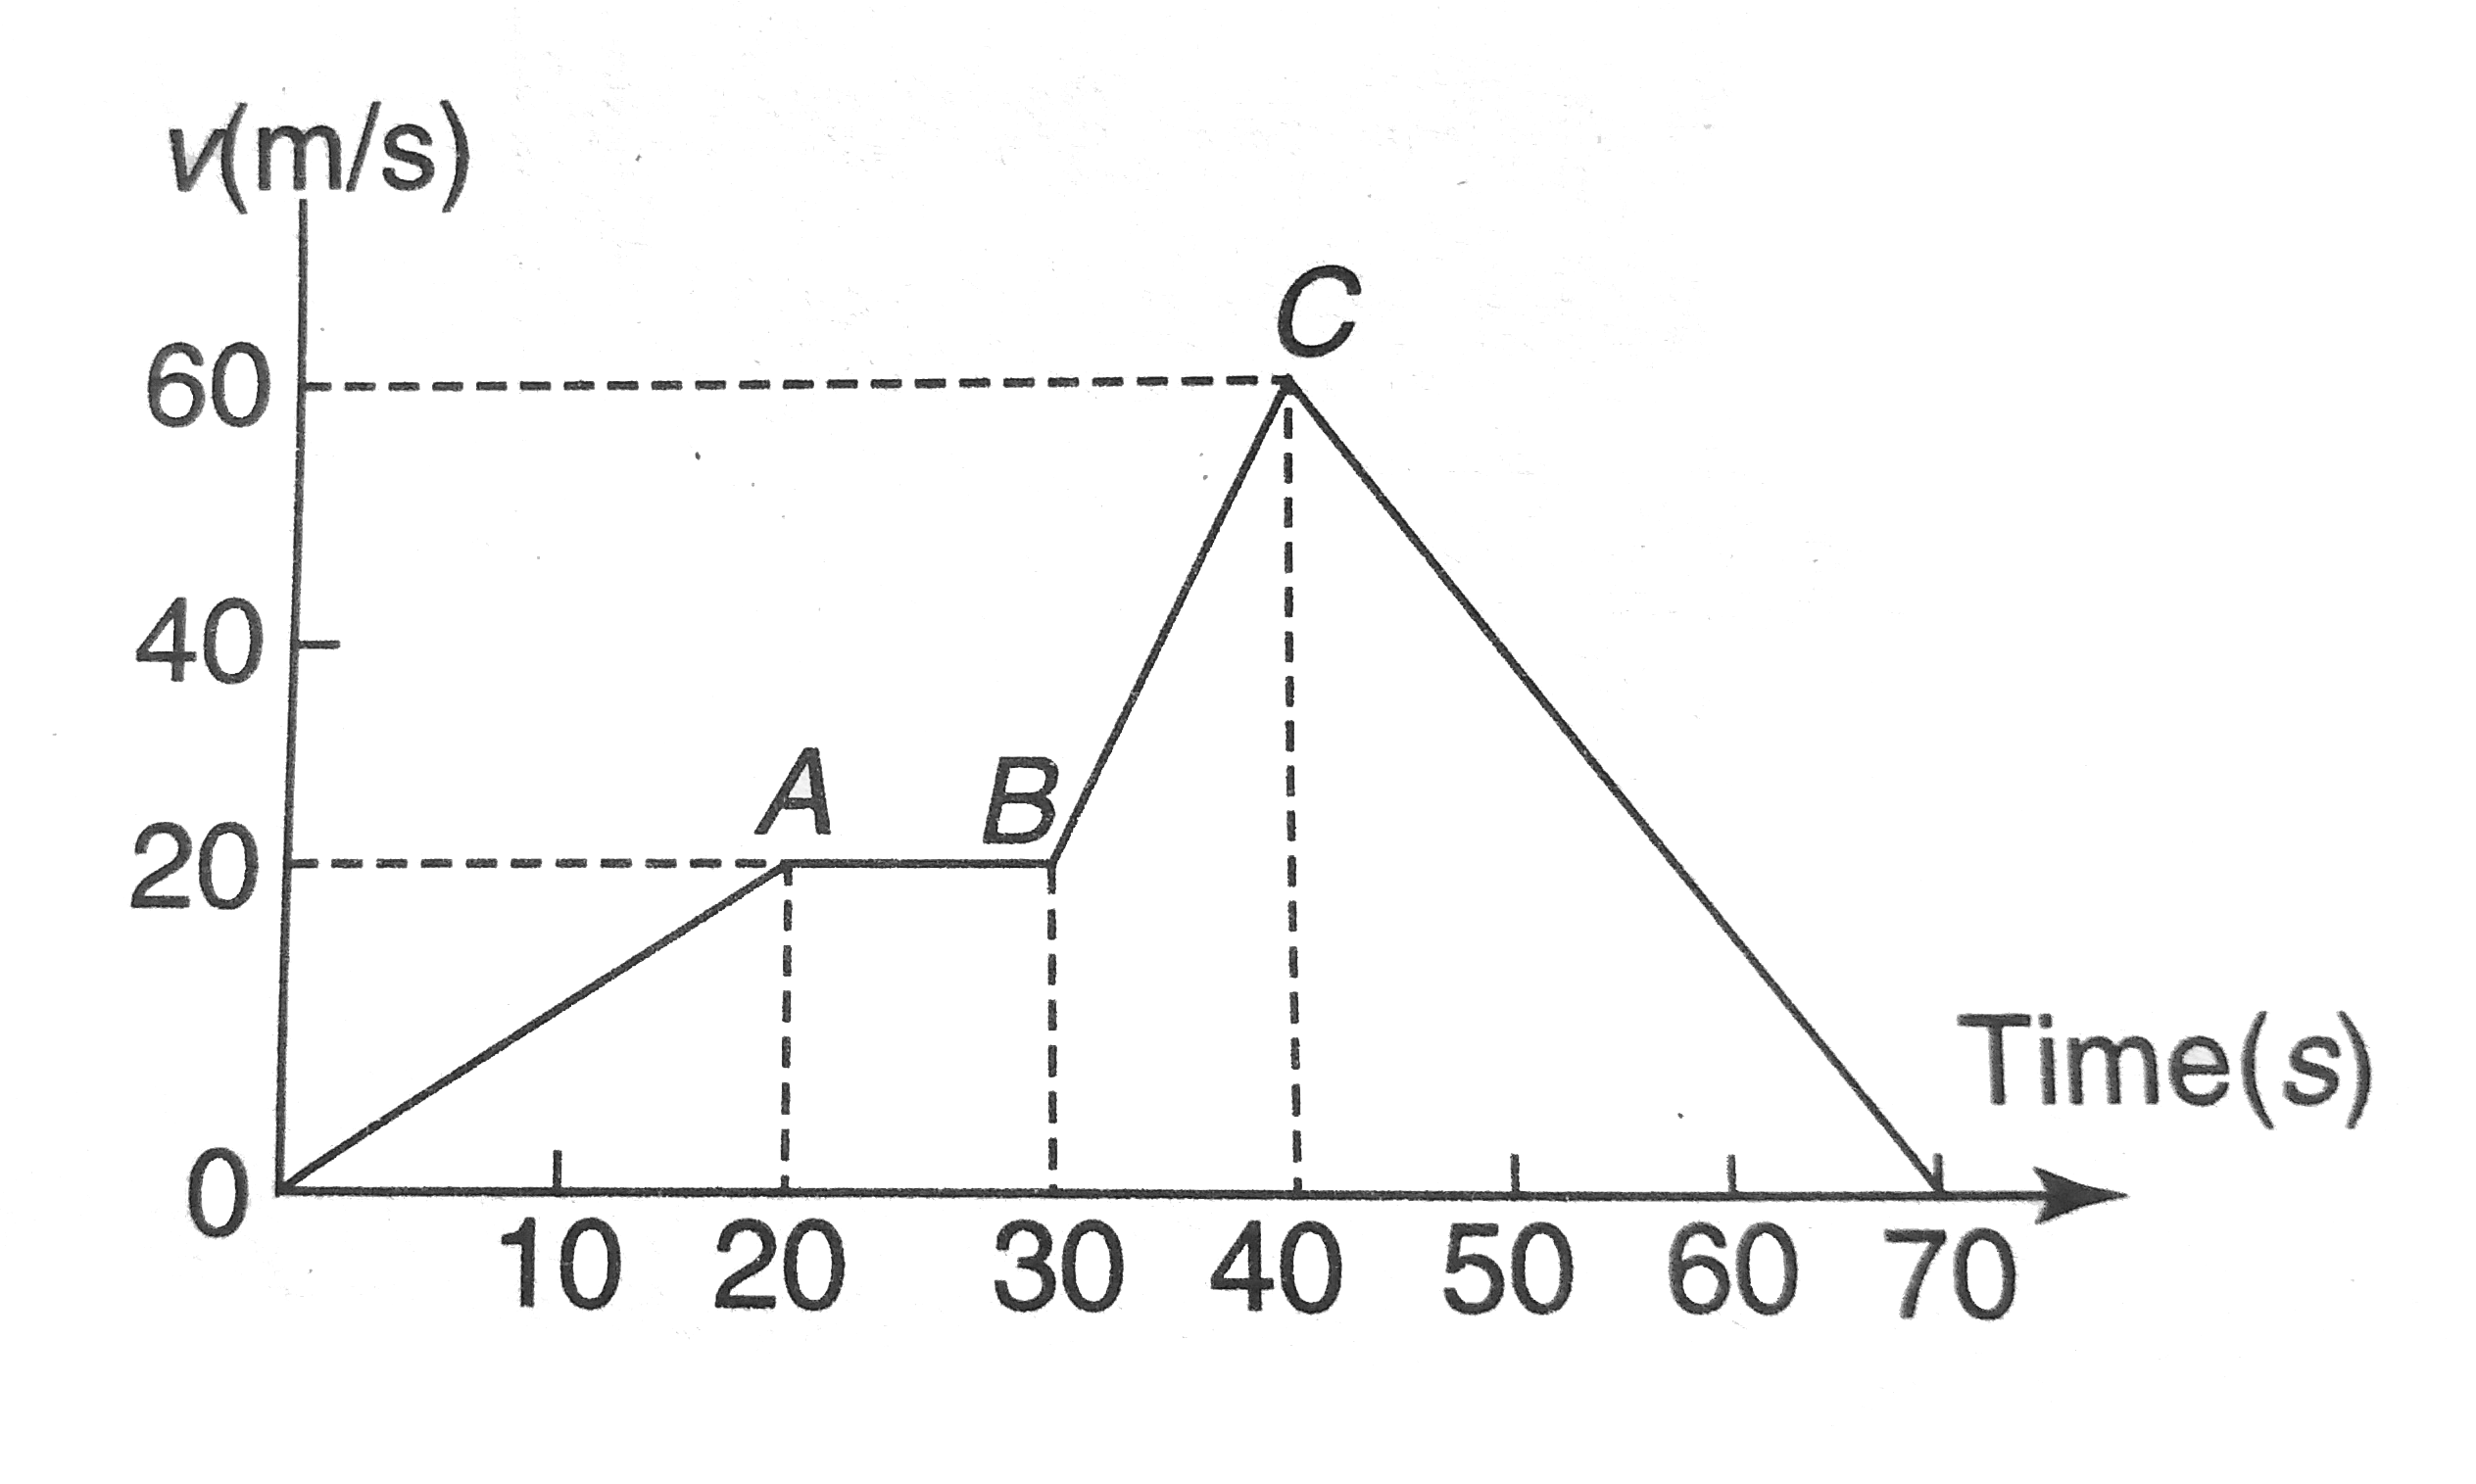
View SolutionThe velocity-time graph of a body is given below. Find the average velocity from `t = 0` to `t = 40 s`.
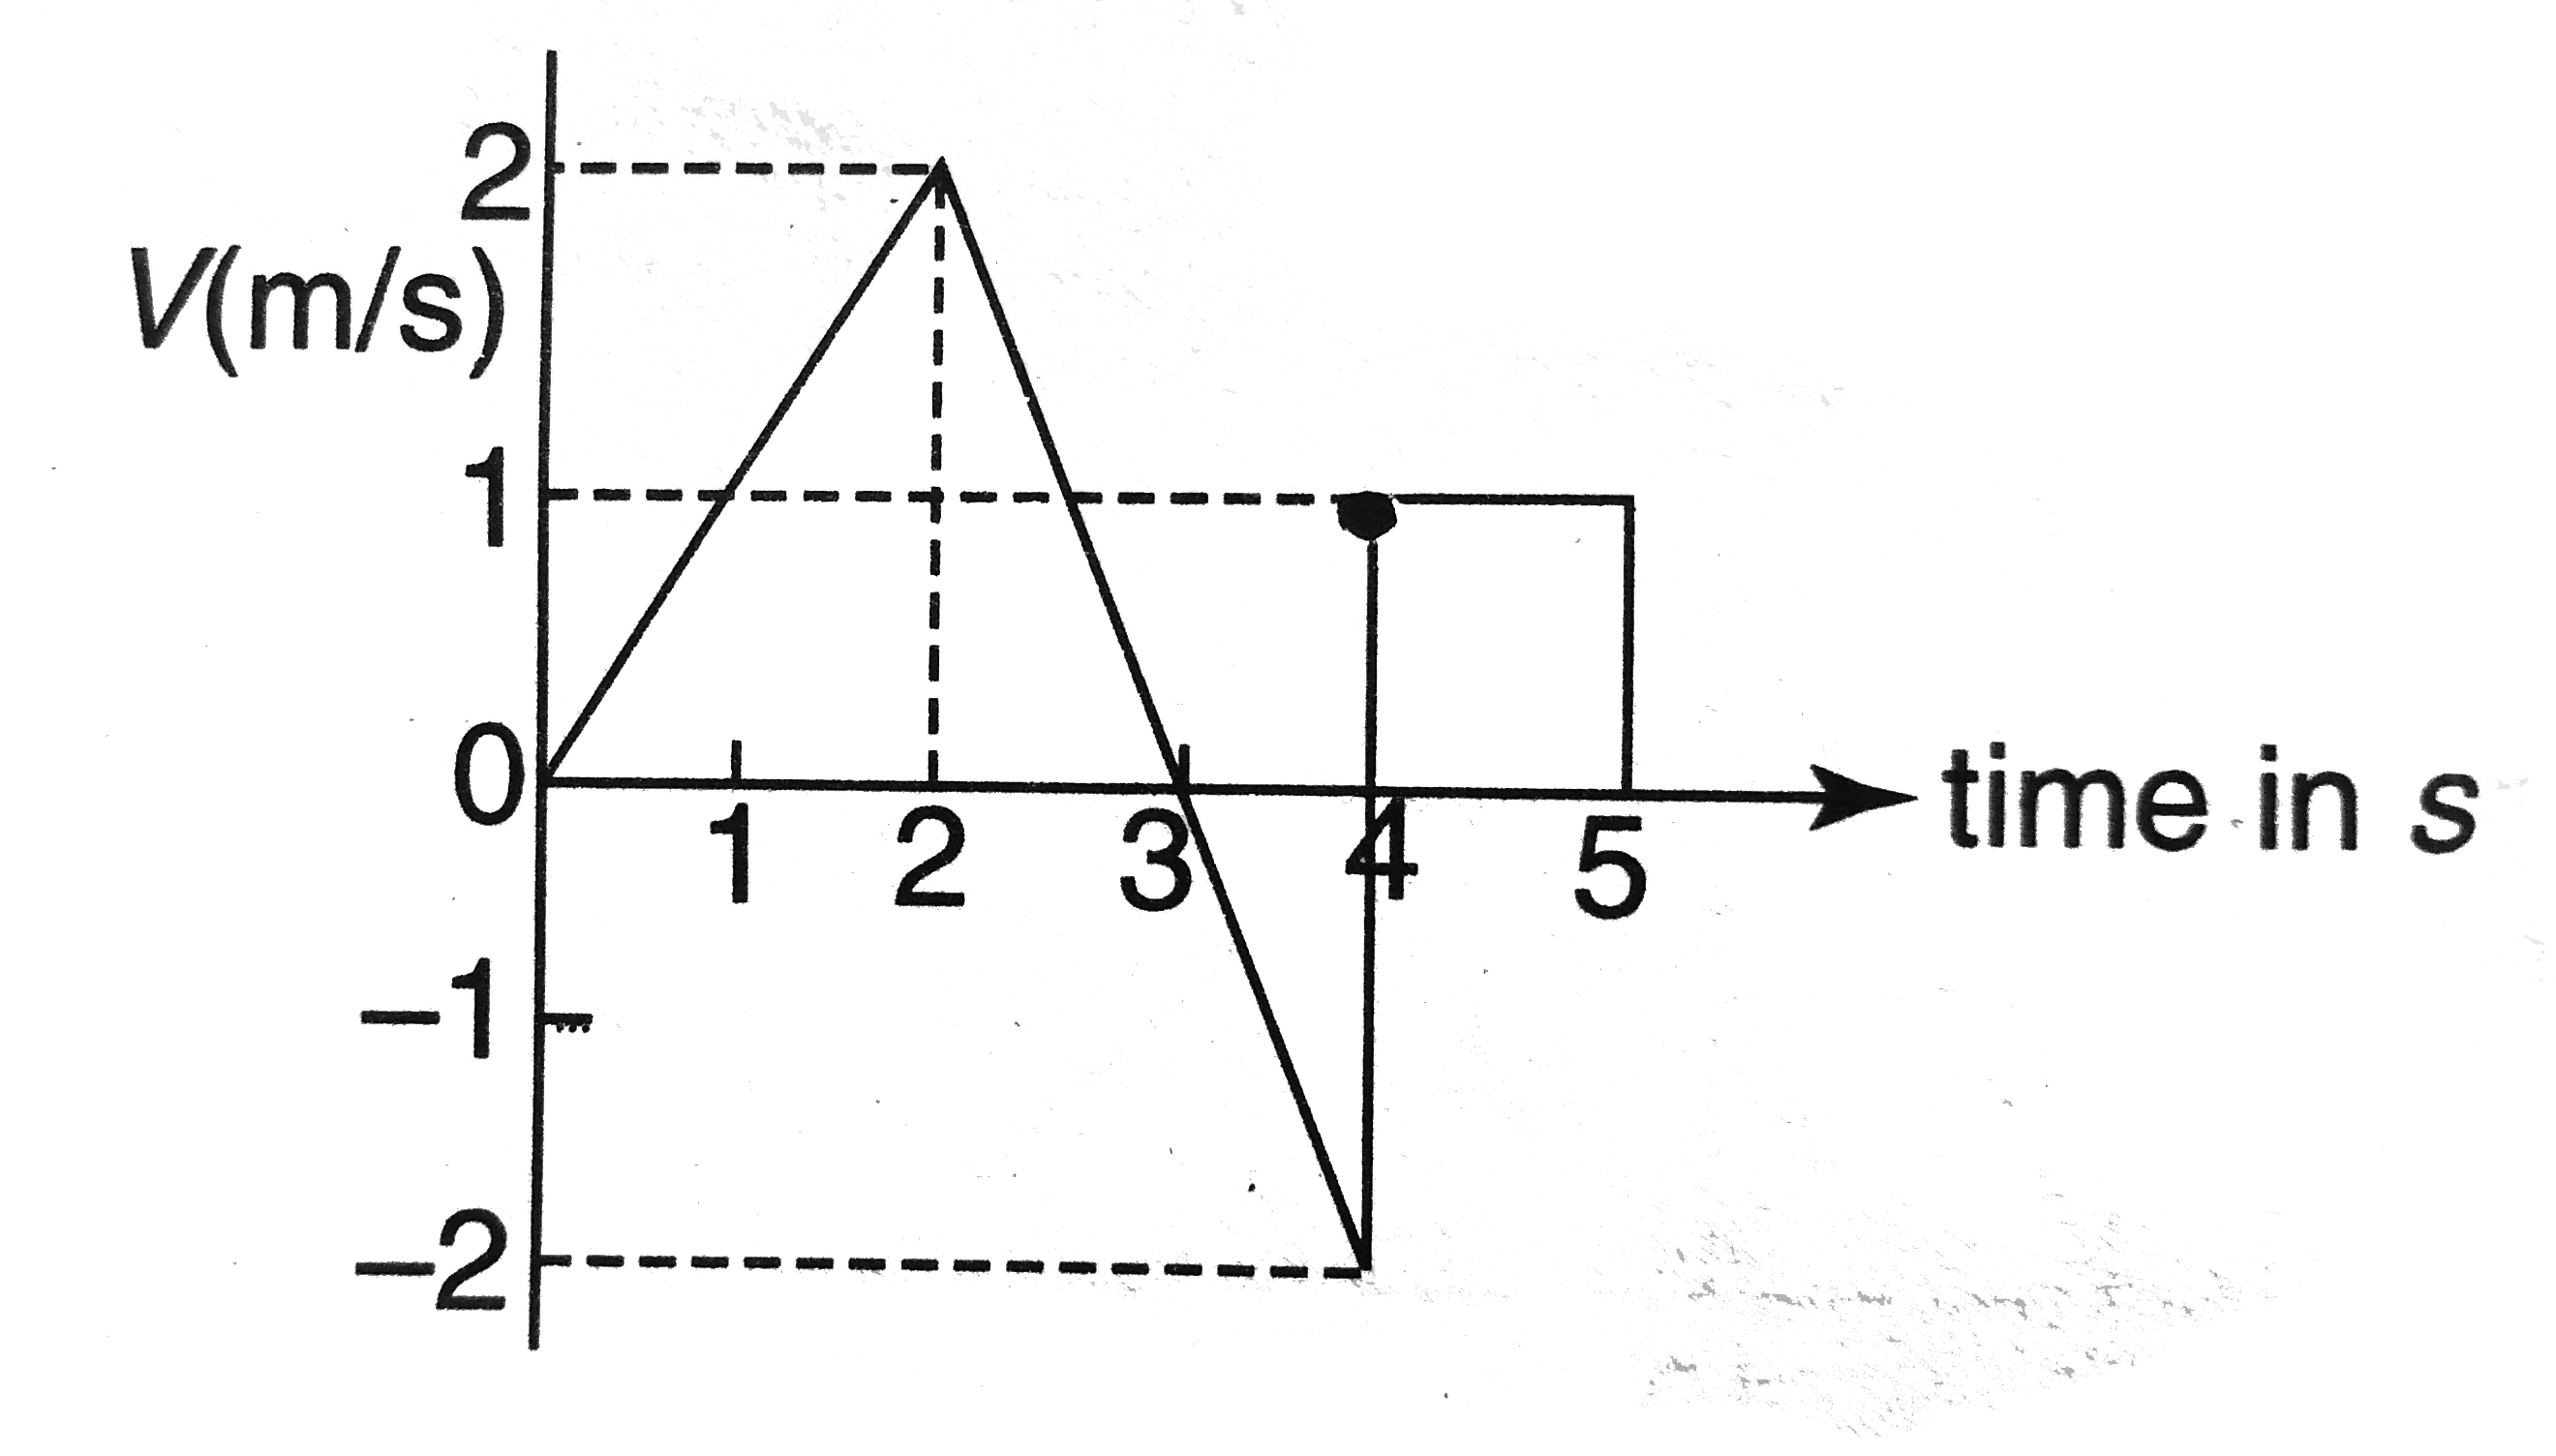
View SolutionThe velocity-time graph of a body moving along straight line is as follows :
The displacement of the body in 5 s is
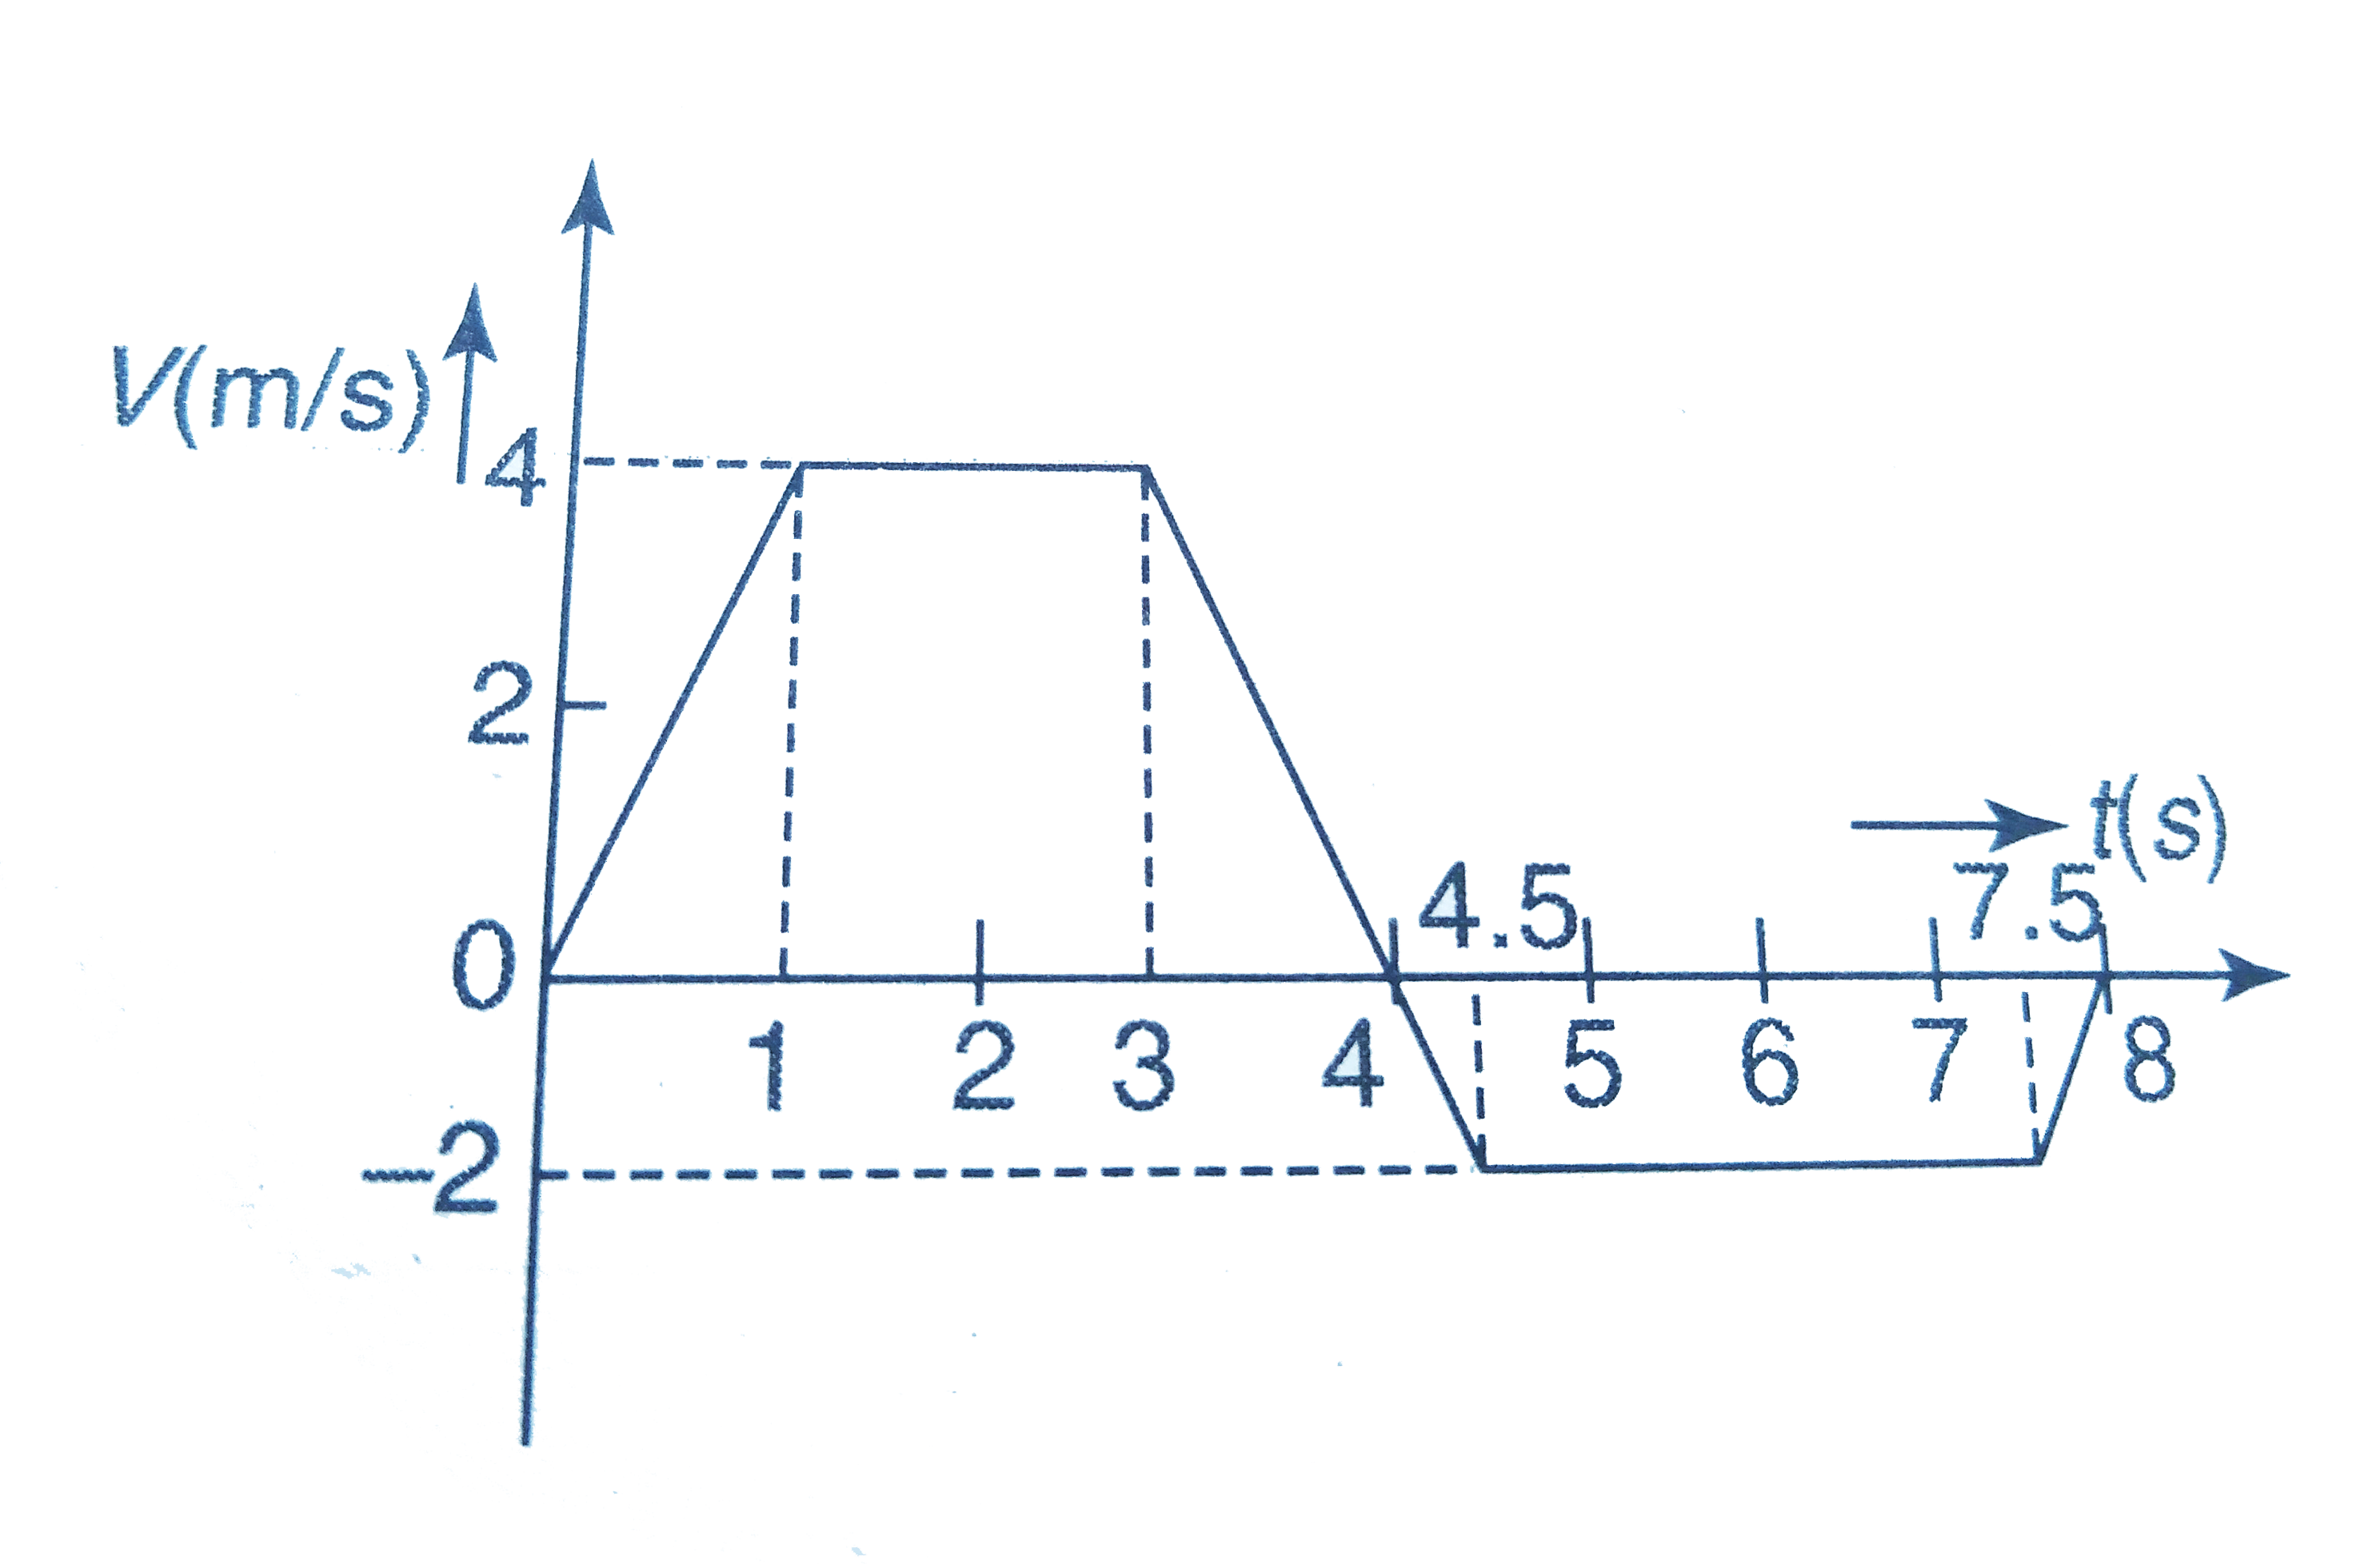
View SolutionThe velocity-time graph of a linear motion os shown figure. The distance from the starting point after `8 sec` is.
View SolutionA particle starts from rest and undergoes an acceleration as shown in figure. The velocity-time graph from figure will have a shape.
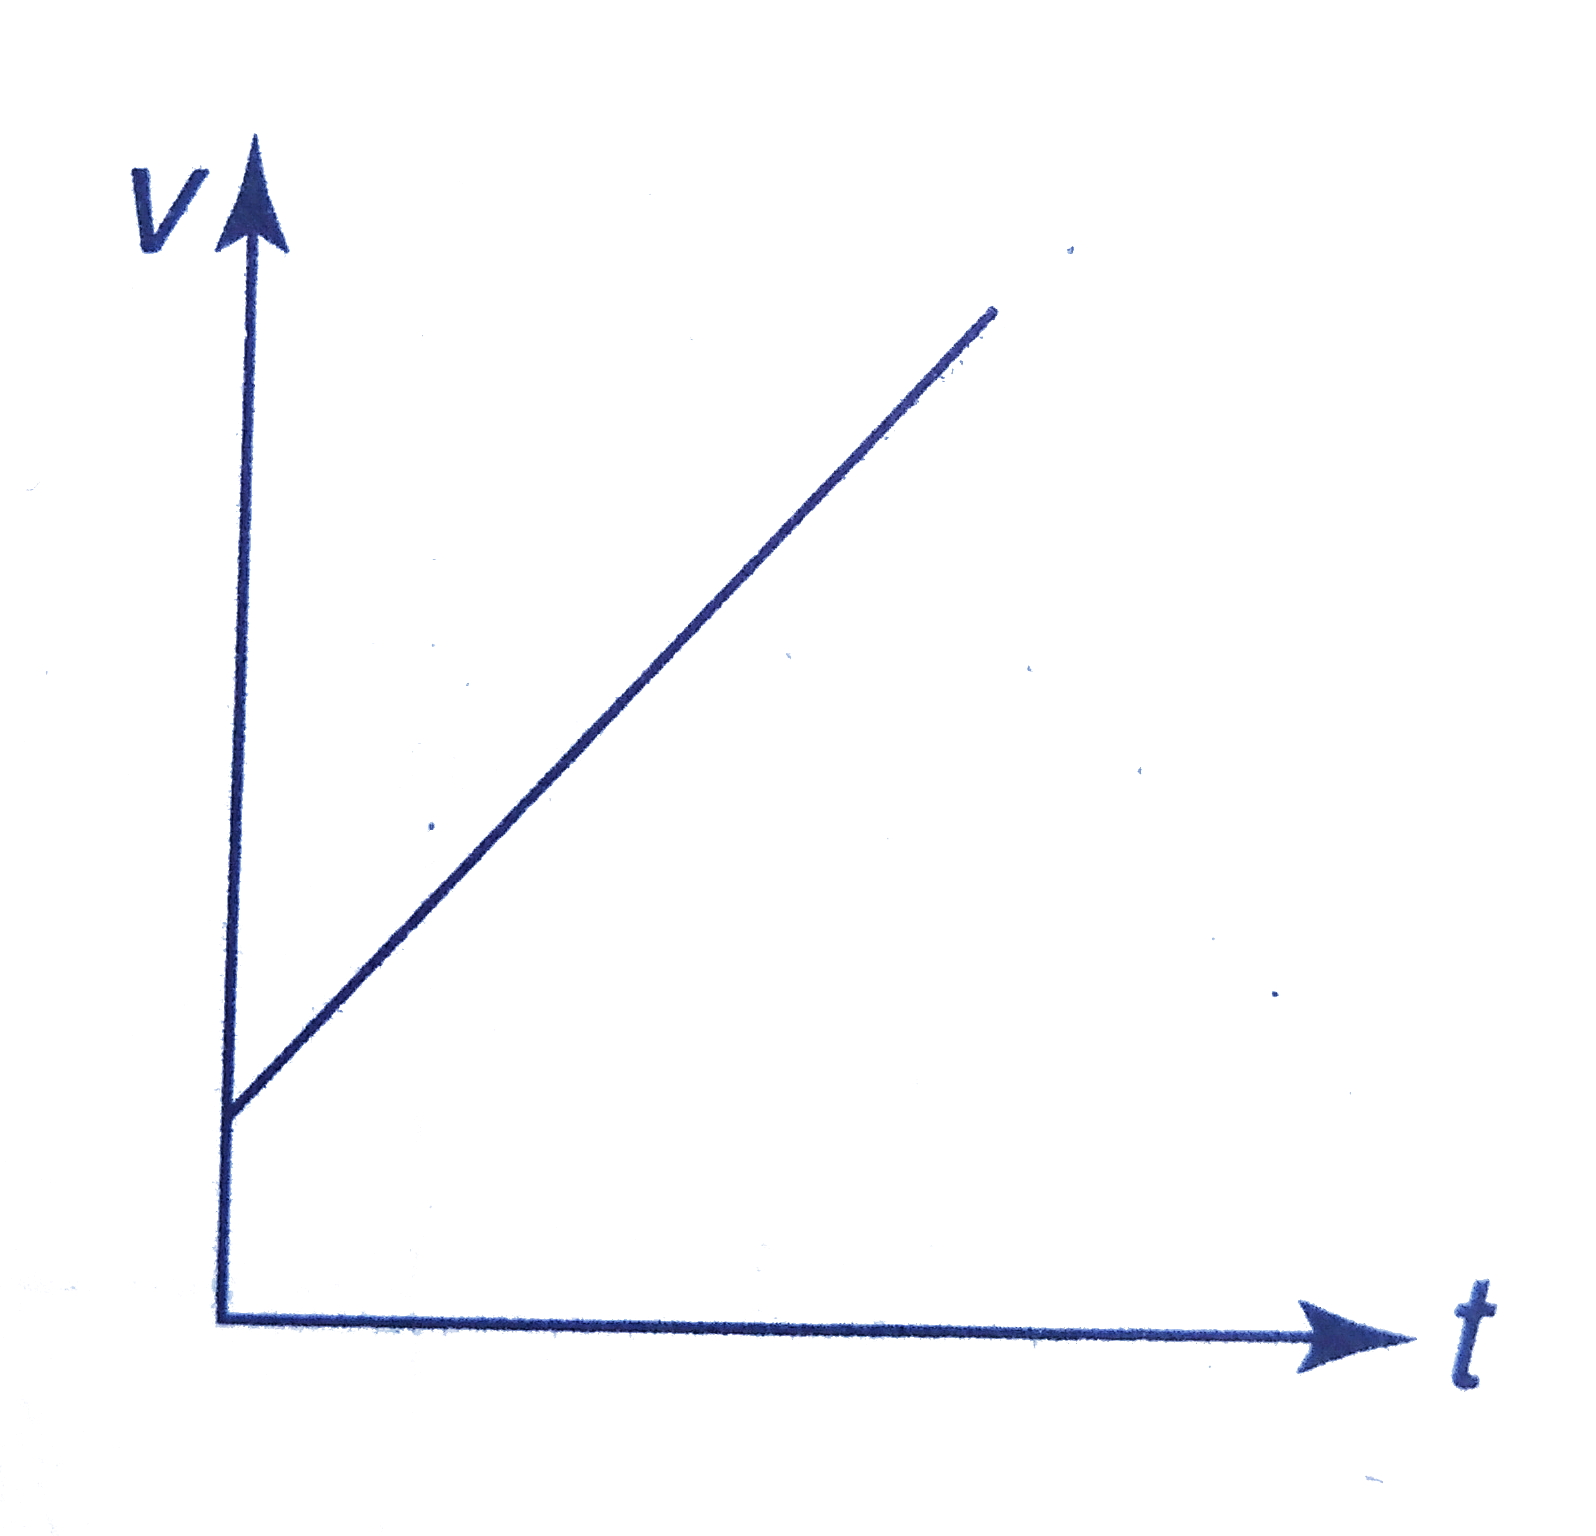
View SolutionWhich of the following graphs show the `v - t` graph of a ball thrown upwards ?
View SolutionFigure shows a velocity-time graph. This shows that.
View SolutionA paratrooper id dropped from an airplane. After some time his parachute opens and he reaches the ground with almost zero speed. This speed of fall (v) versus time (t) grapg will look like :
View SolutionThe plot shows the position (`x`) as a function of time (`t`) for two trains that run on a parallel track. Train `A` is next to train `B` at `t=0` and at `t=T_(0)`.
View SolutionThe graph to the right is a plot of position versus time. For which lebeled region is the velocity positive and the acceleration negative ?
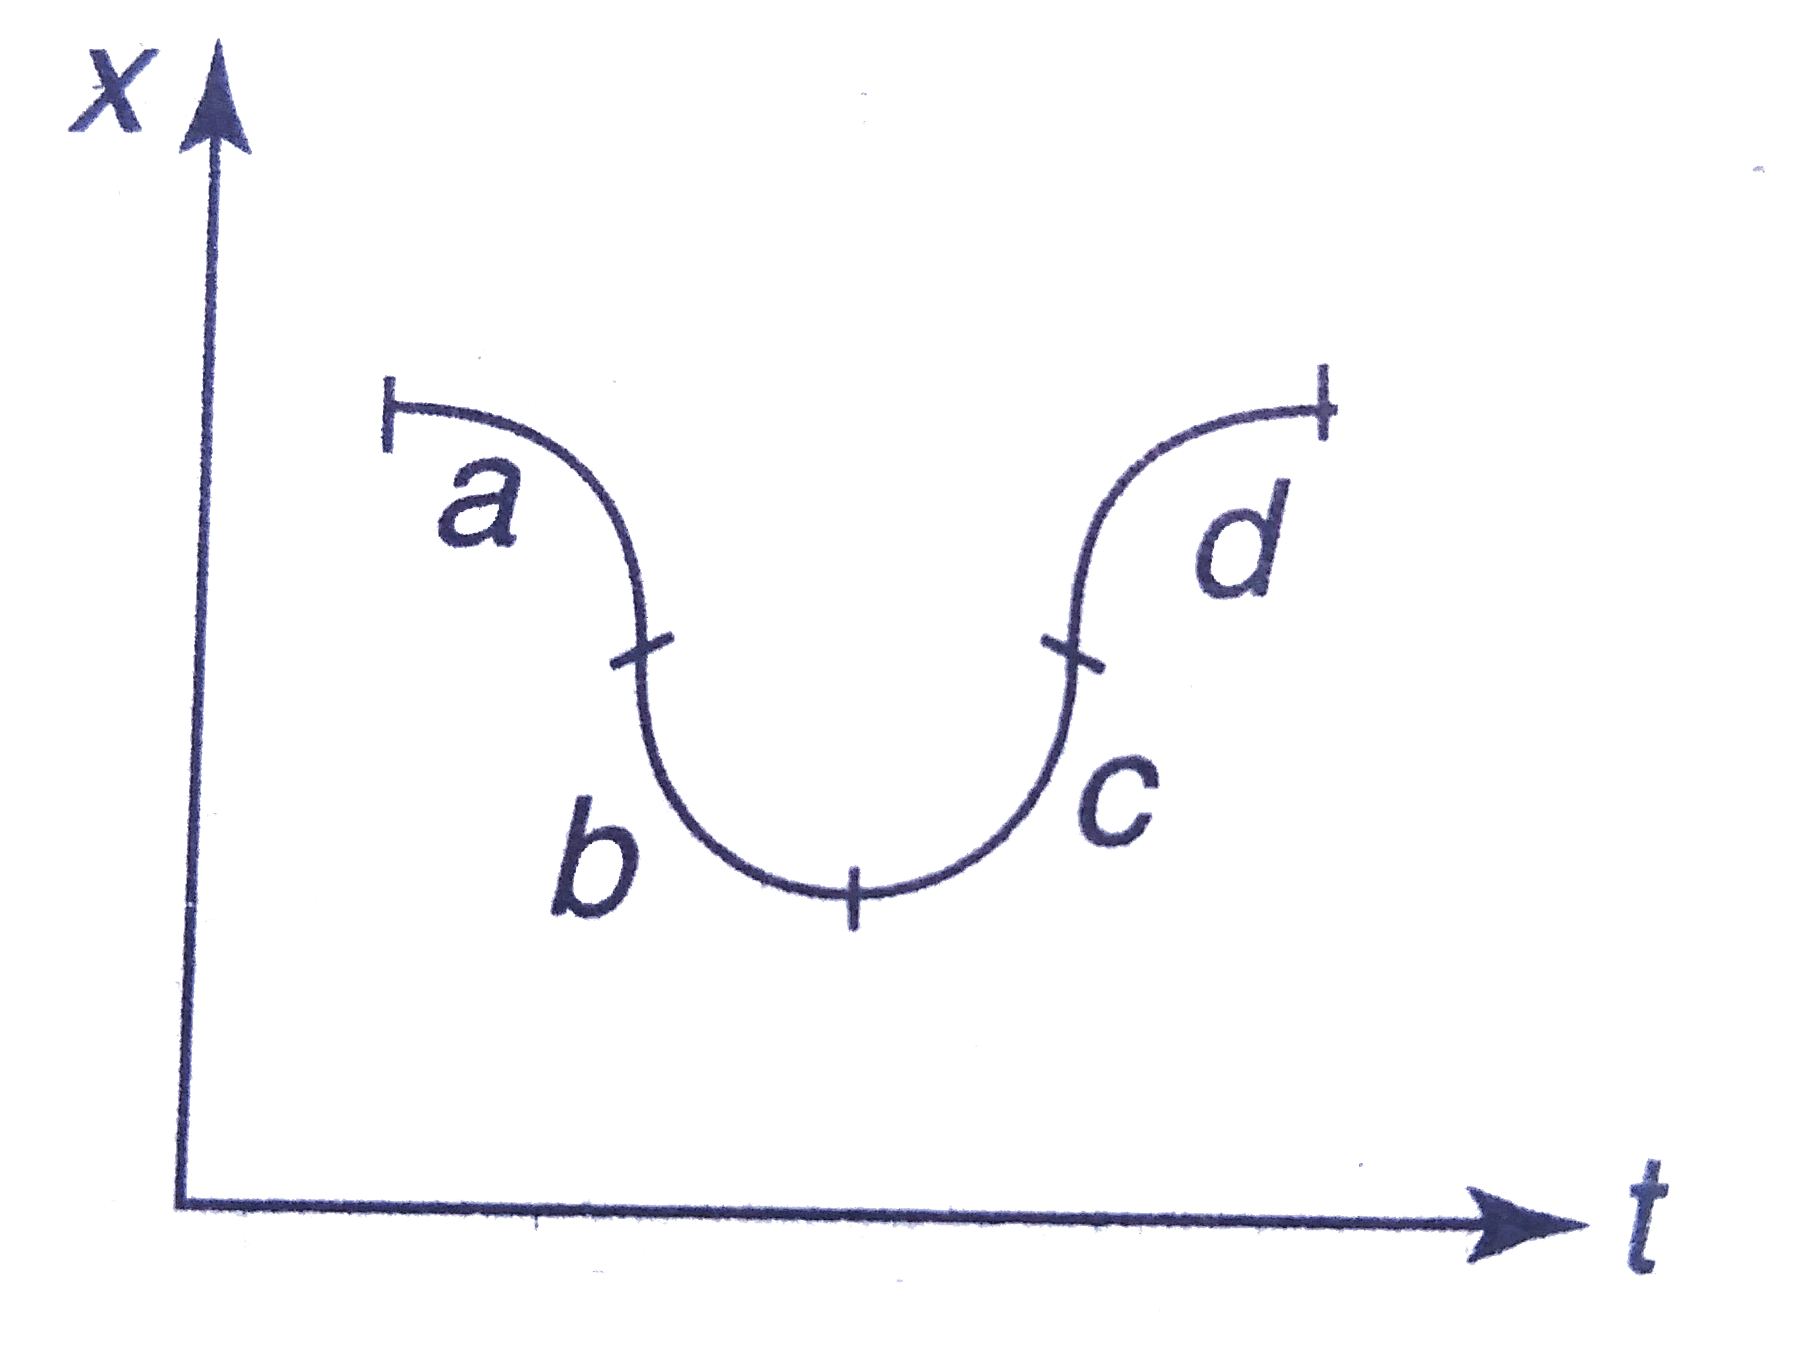
View SolutionFigure shows the position of a particle moving on the x-axis as a function of time, Choose the WRONG statement.
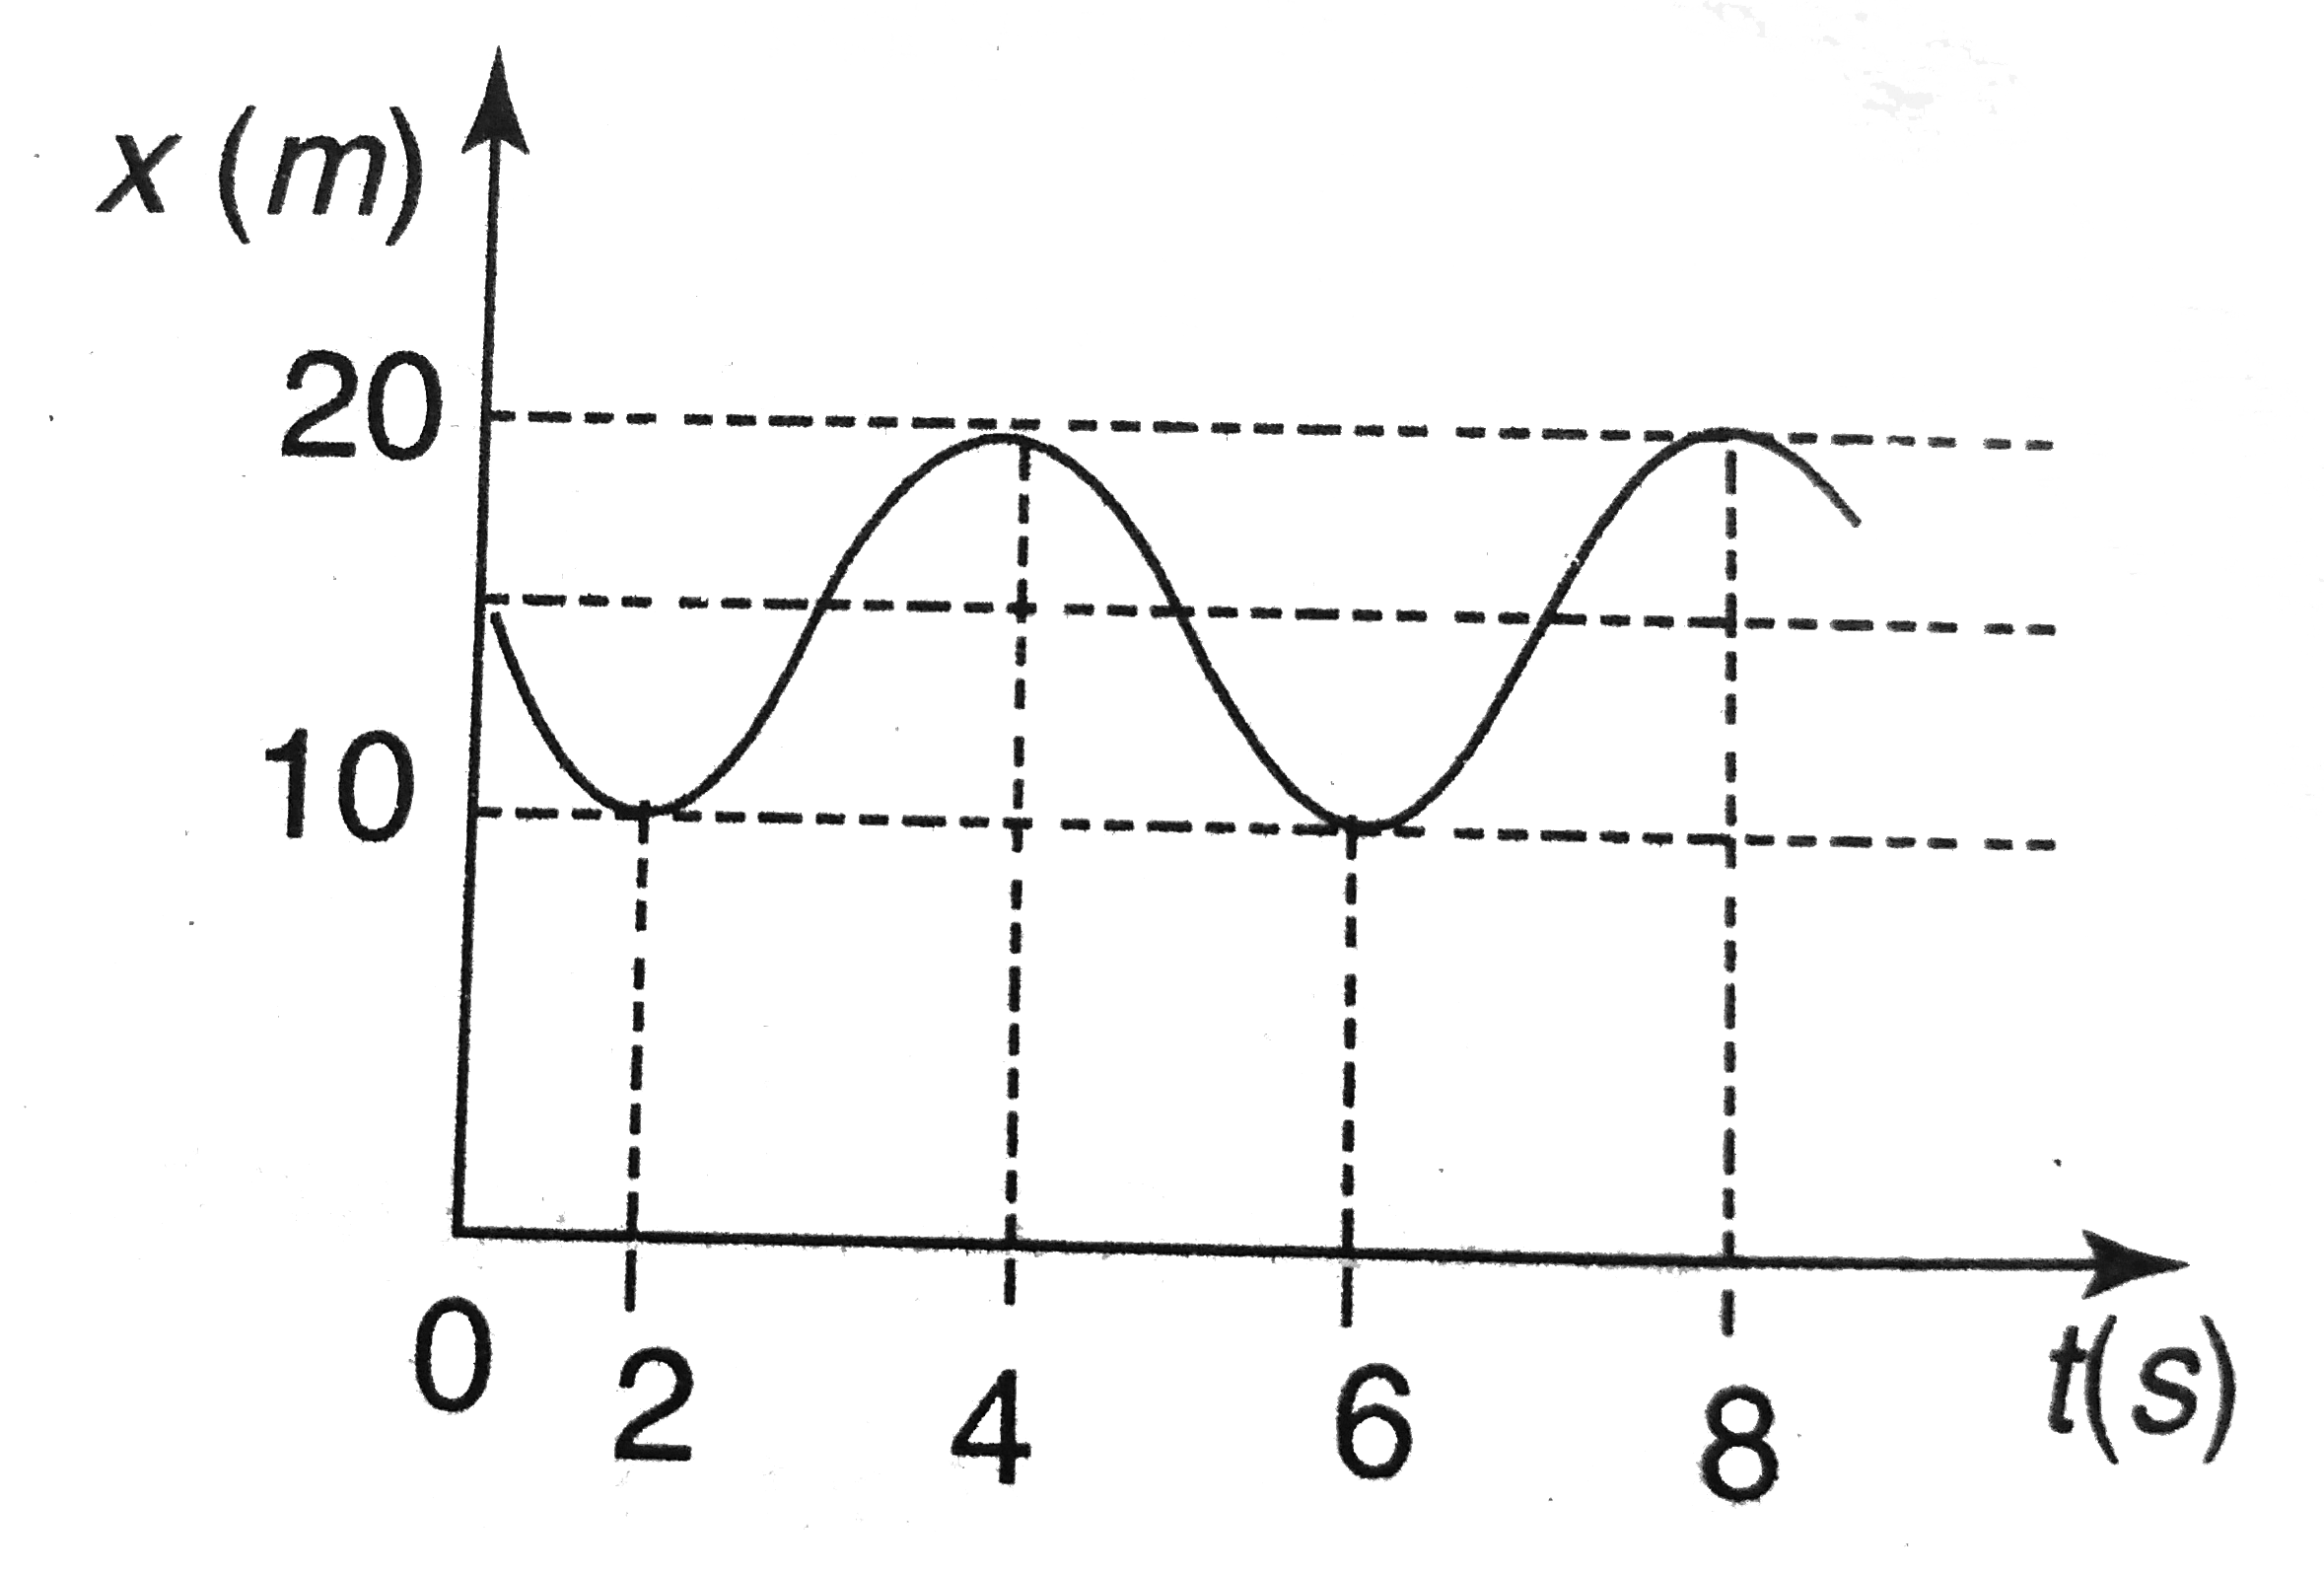
View SolutionA particle moves rectilinearly with a constant acceleration `1 m//s^2`. Its speed after `10` seconds is `5 m//s`. The distance covered by the particle in this duration is.
View SolutionIn figure shown, the graph shows the variation of acceleration of body with time `t`. The velcocity of the body at `t = 0` is zero. The velocity of the body at `t = 30 s` is.
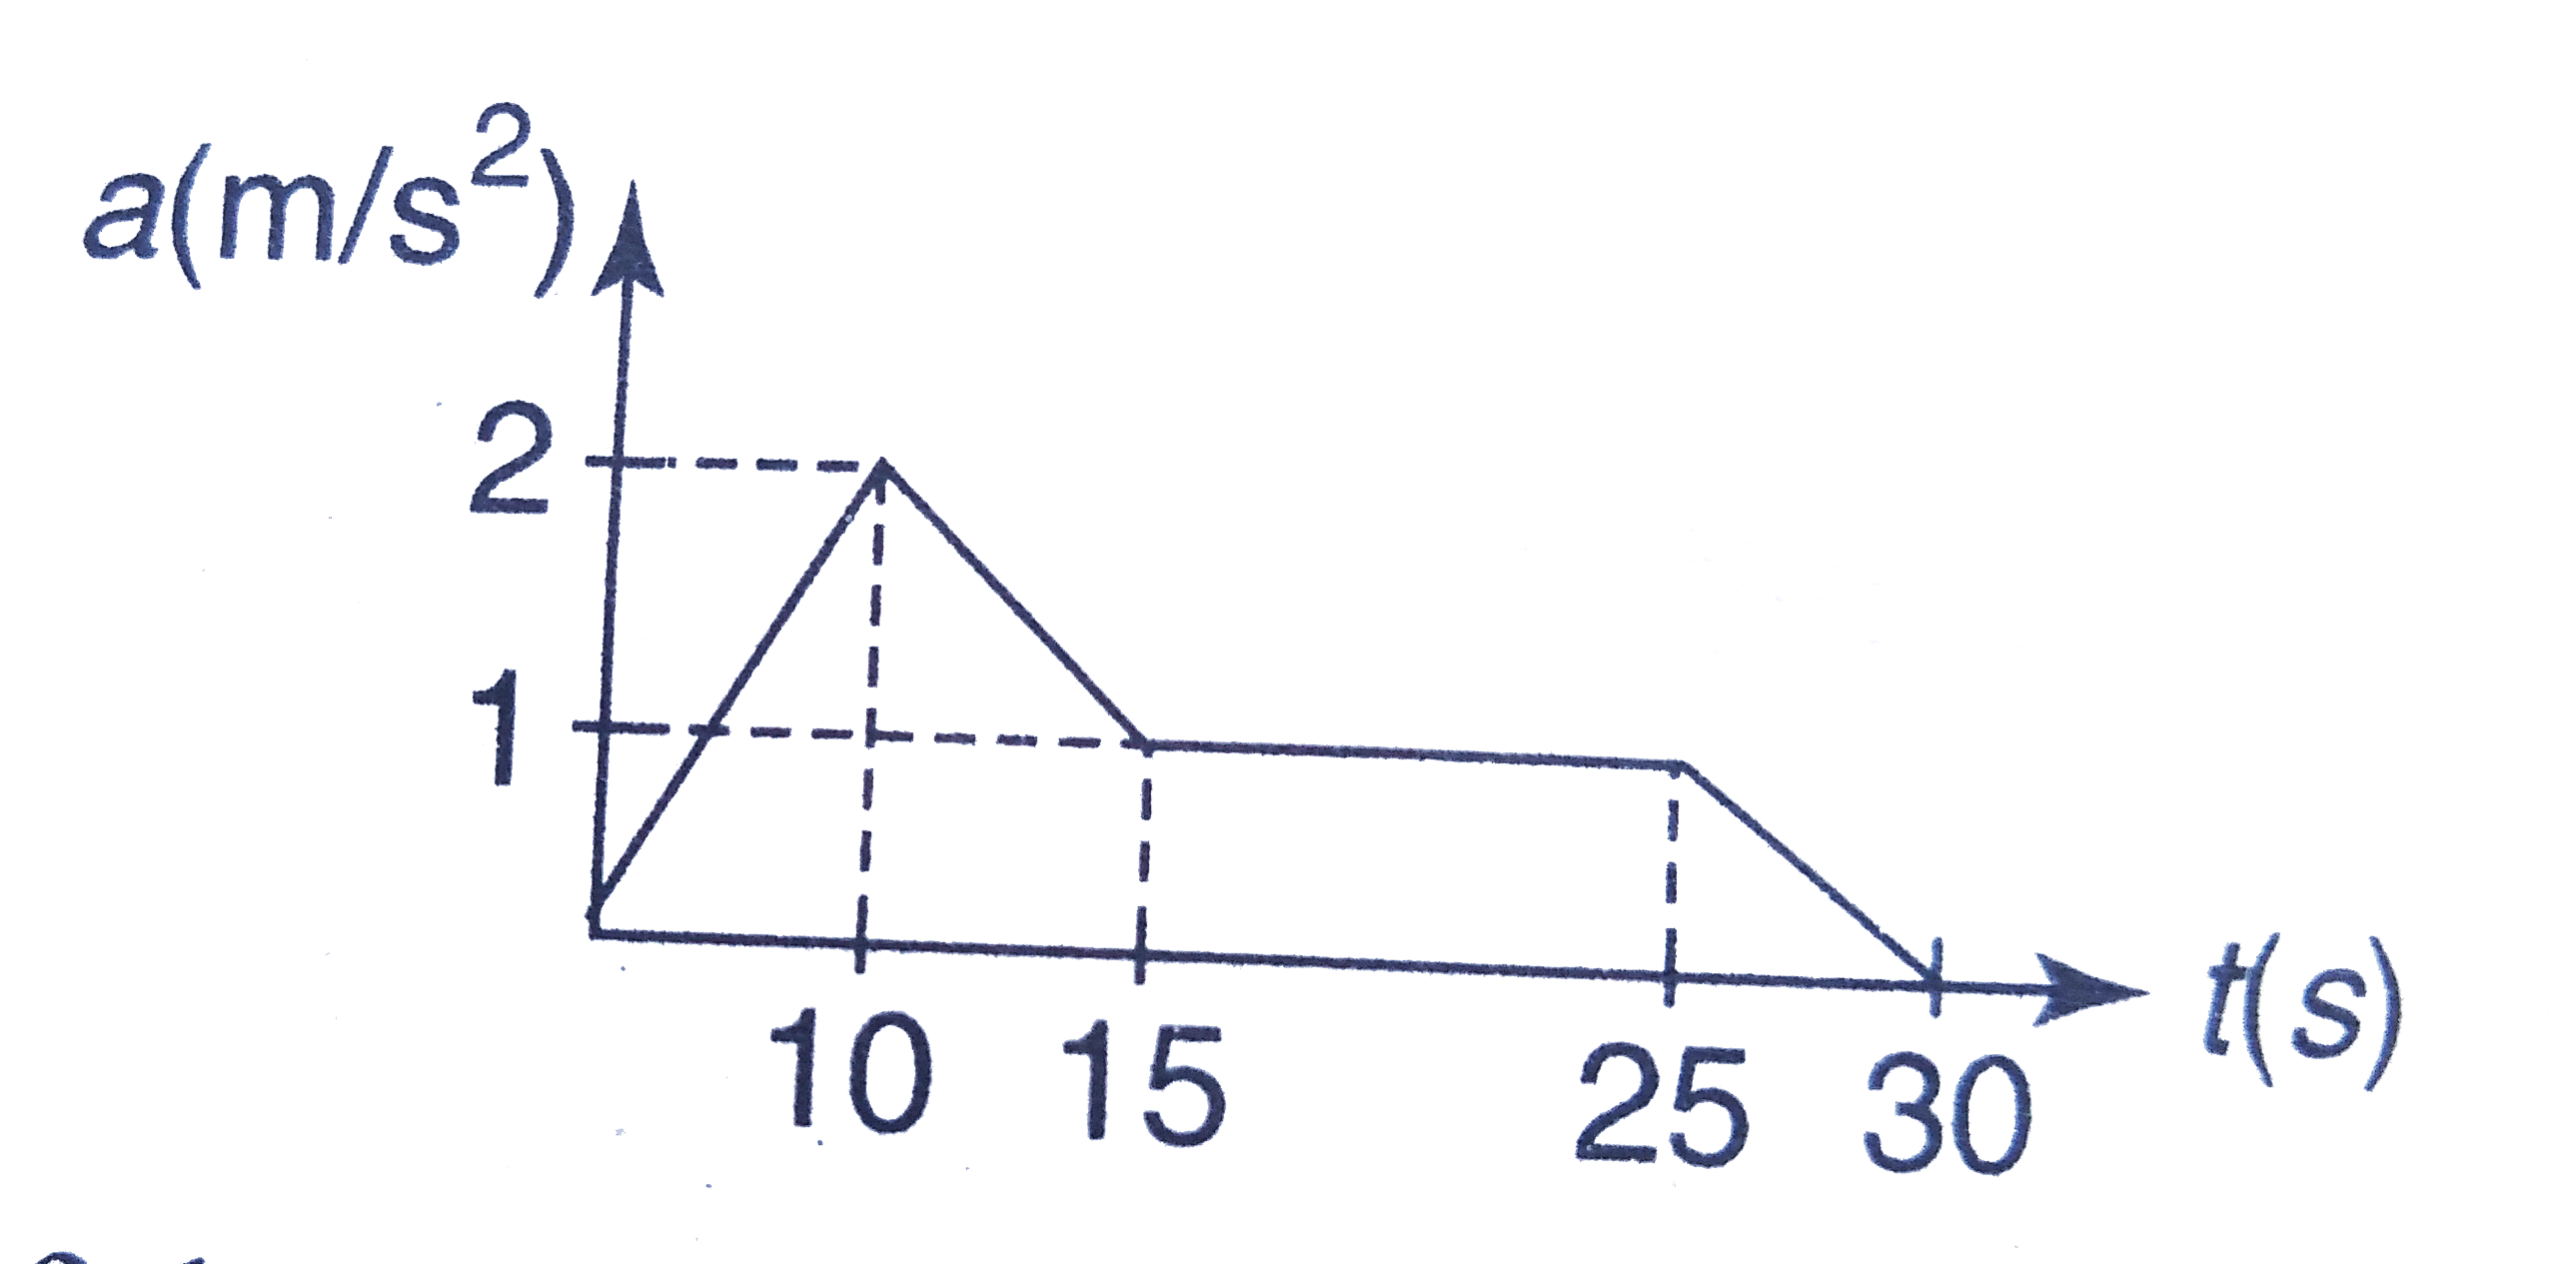
View SolutionRefer `Q.139`. The average acceleration of the body from `t = 0` to `t = 15 s` is.
View SolutionVelocity `v` of a particle moving along x axis as a function of time is given by `v = 2t m//s`. Initially the particle is to the right of the origin and `2 m` away from it. Find the position (distance from origin) of the particle after first `3 s`.
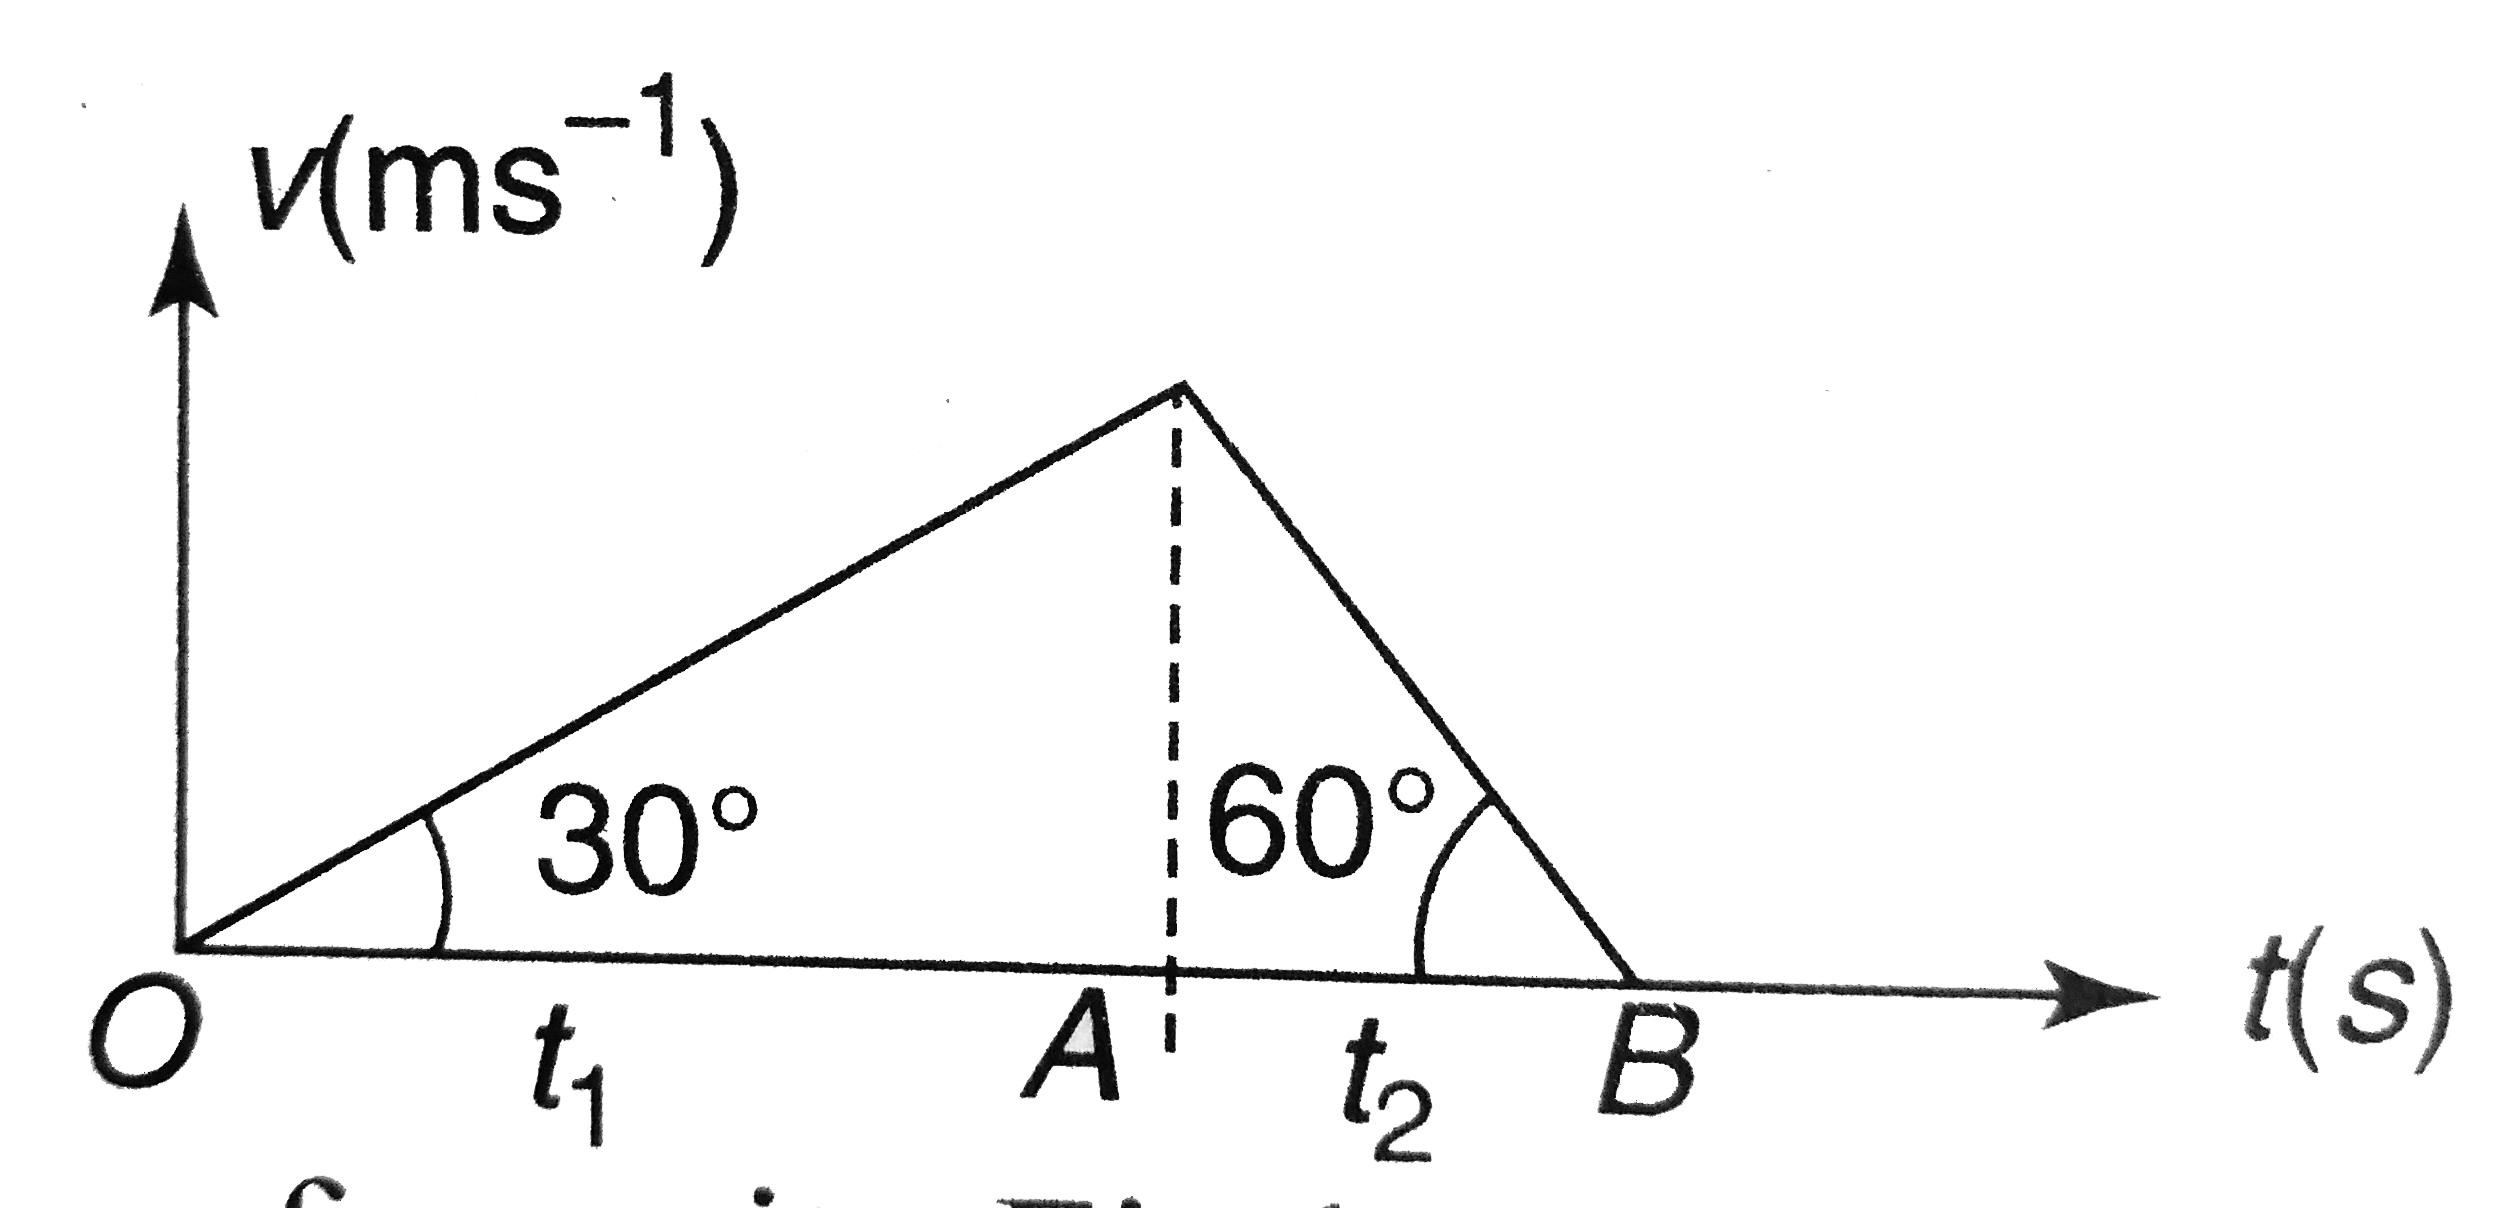
View SolutionRefer `Q.141` find the displacement of the particle after `3 s`.
View SolutionFigure shows the position time graph for a particle in one dimensional motion. What is the displacement of the particle in first `4` seconds ?
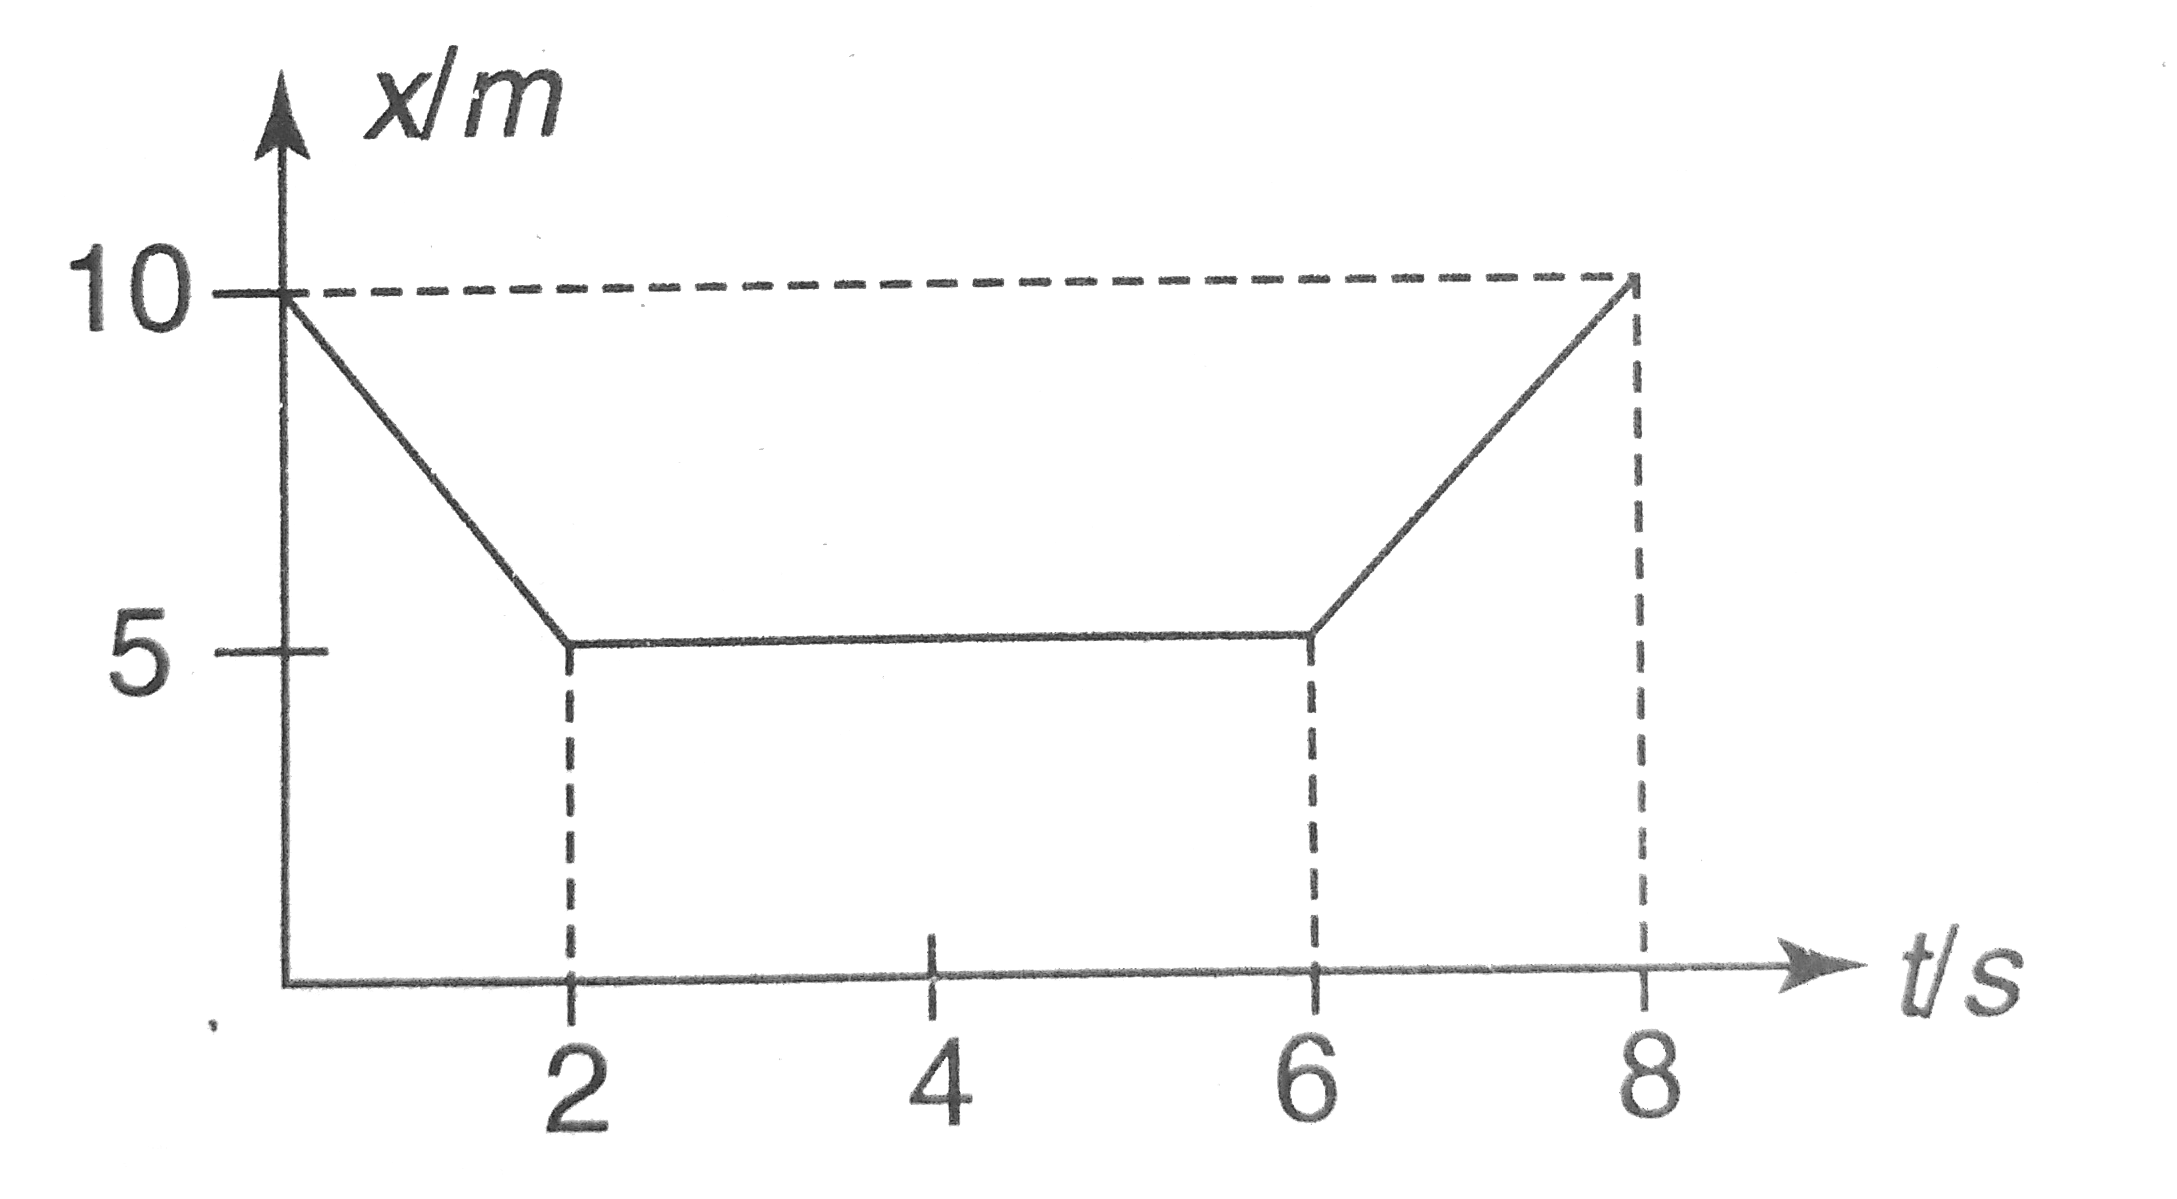
View SolutionRefer `Q. 143`, What is the average velocity of the particle from `4 s` to `8 s` ?
View SolutionRefer `Q.143`. Starting from `t = 0`, what is the displacement of the particle at the end of `8 s` ?
View SolutionIn which of the graphs both net displacement and velocity are negative ?
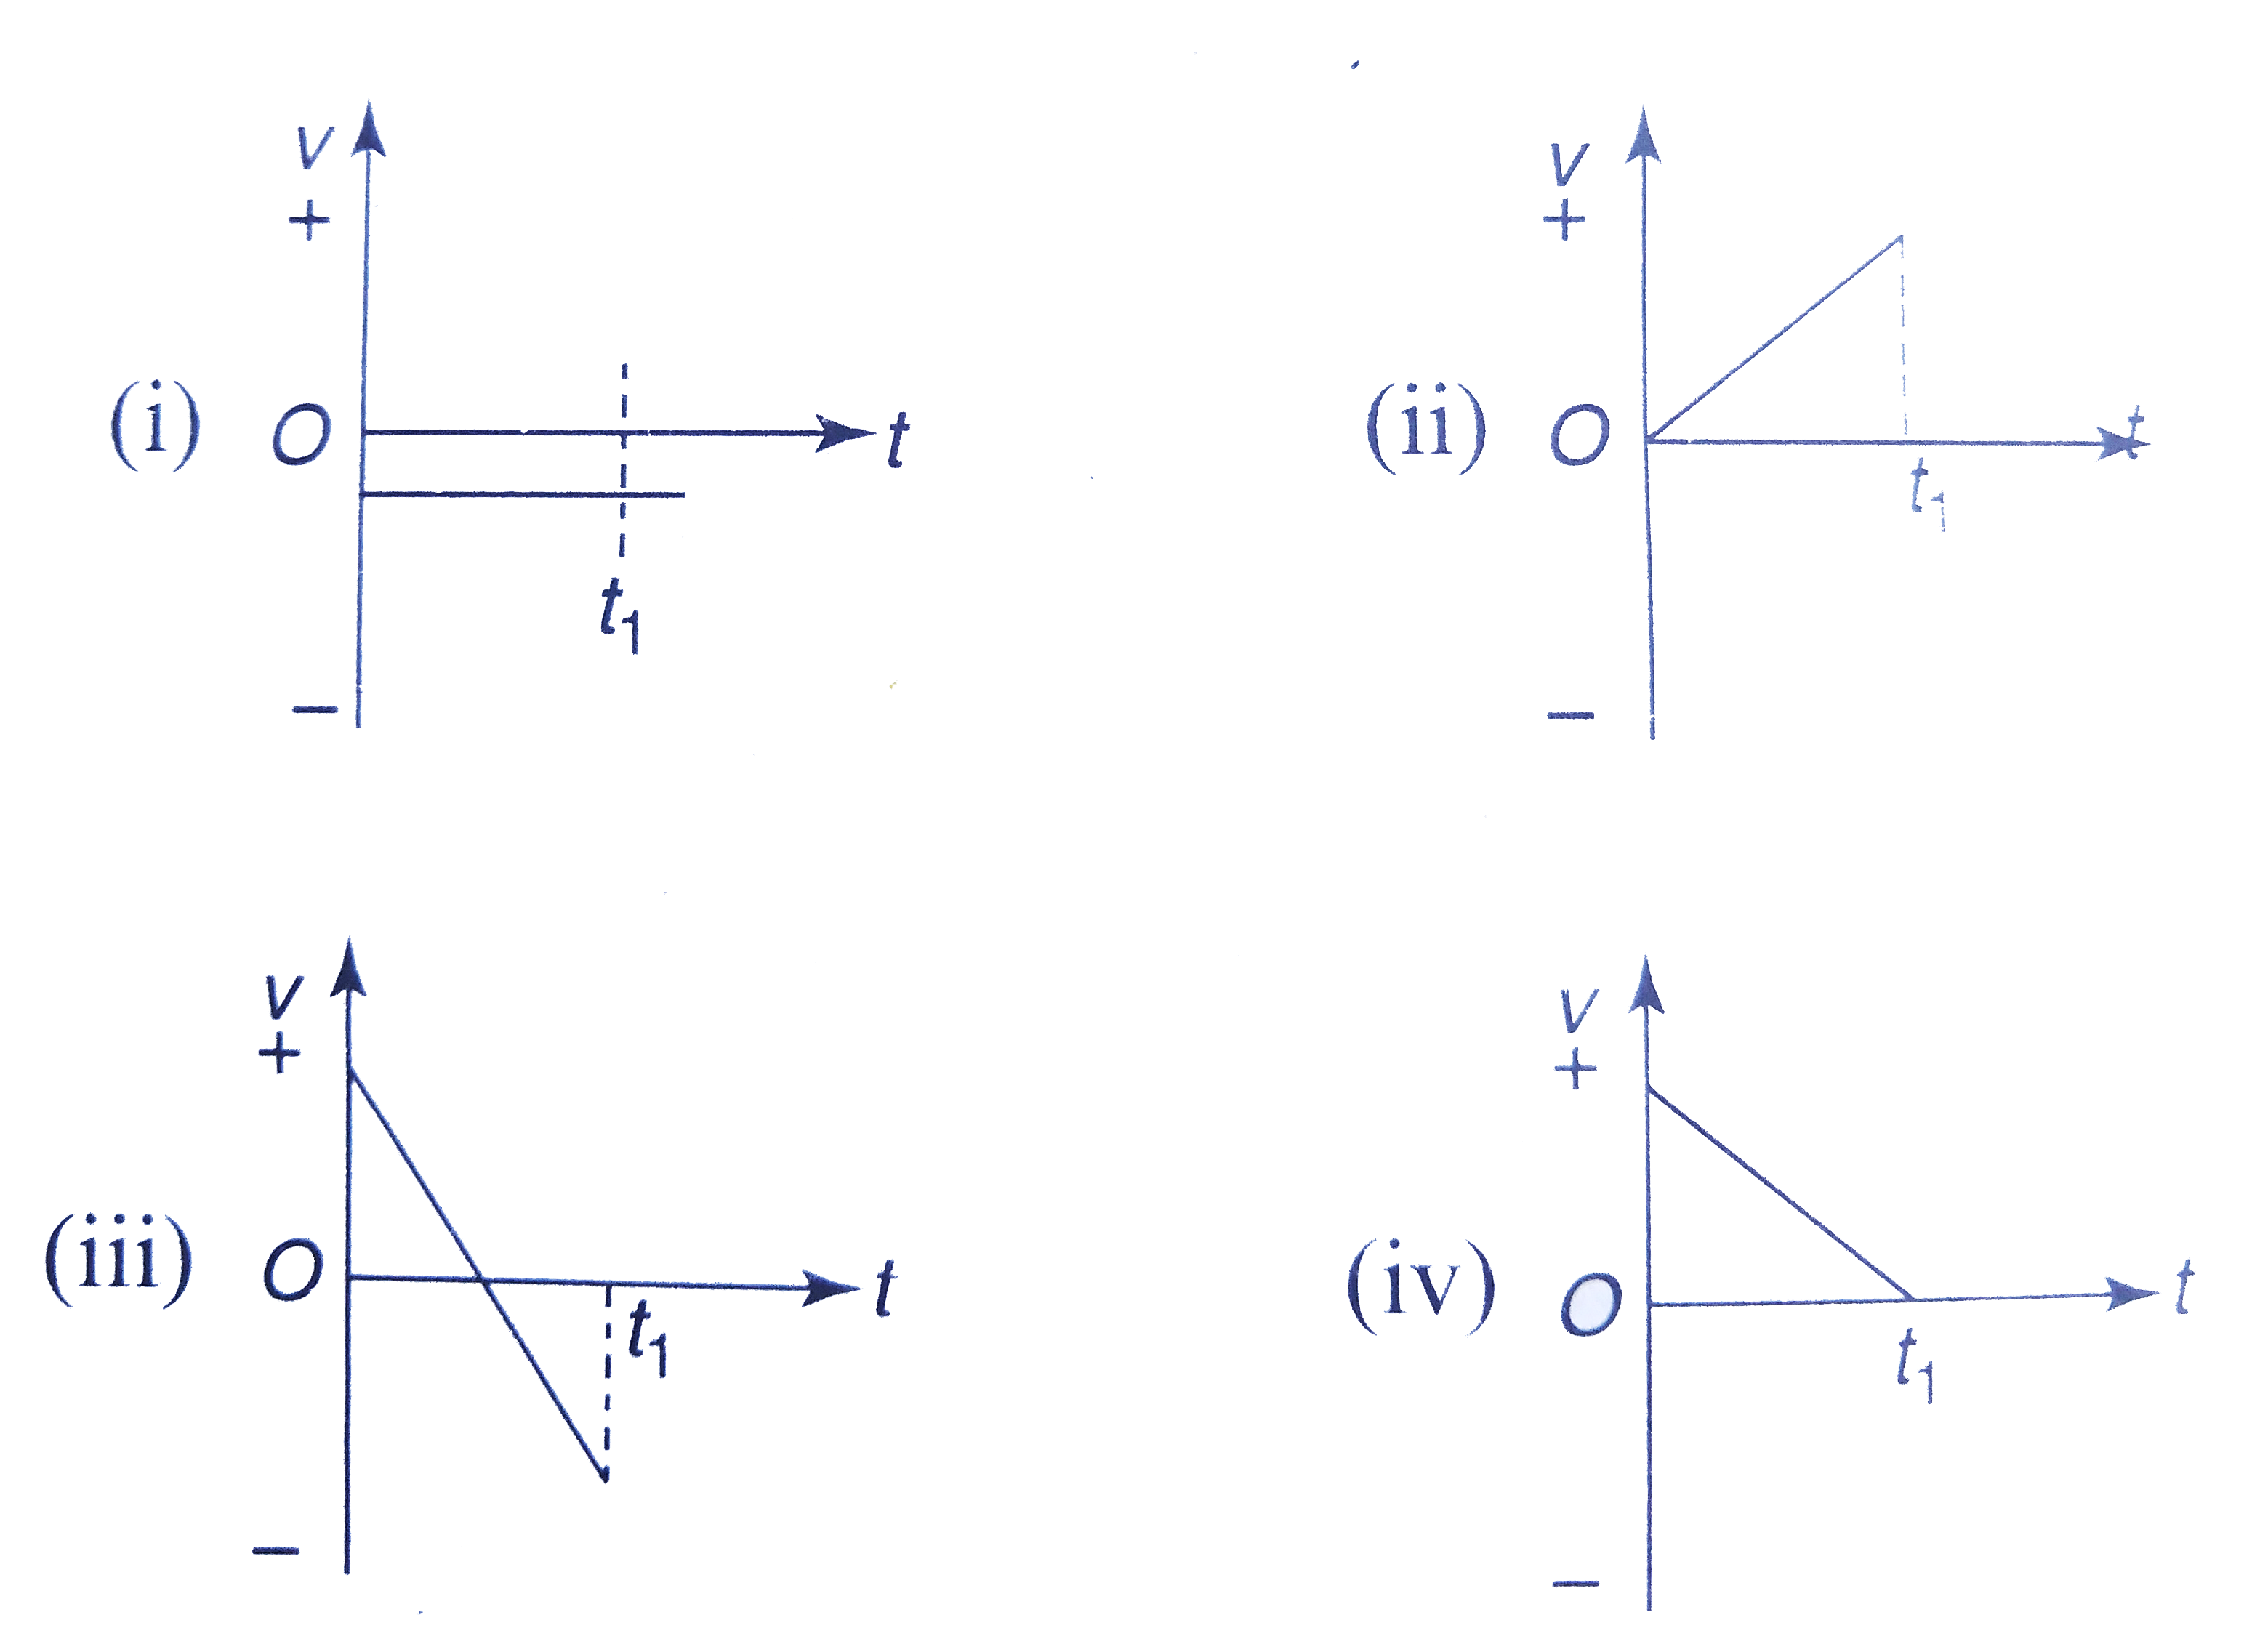
View SolutionRefer `Q.146`. In which of the graphs the particle may return to its initial position again ?
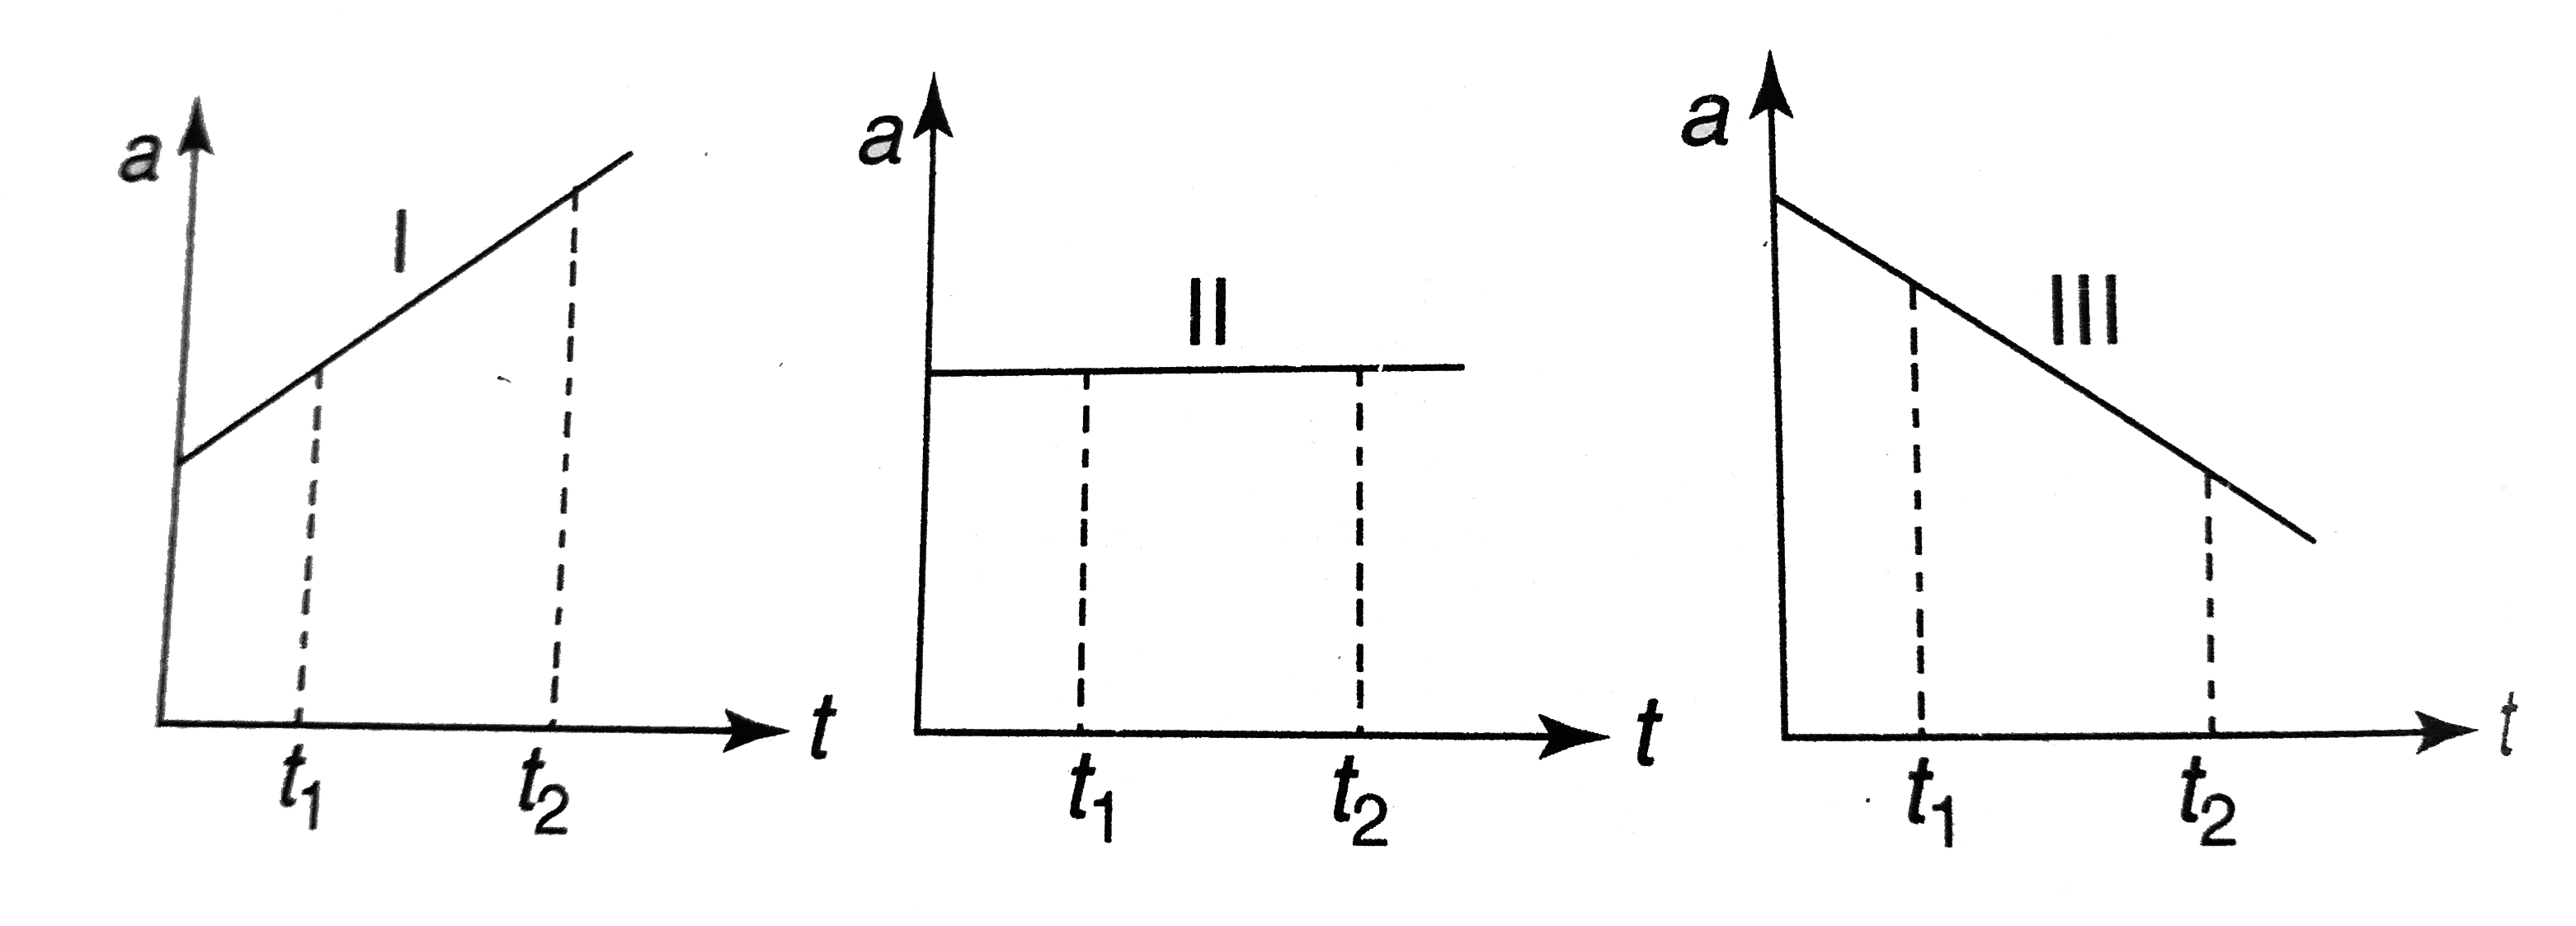
View SolutionEach of the three graphs represents acceleration versus time for an object that already has a positive velocity at time `t_1`. Which graphs show an object whose speed is increasing for the entire time interval between `t_1 and t_2` ?
View SolutionThe graph given shows the positions of two cars, `A and B`, as a function of time. The cars move along the x-axis on parallel but separate tracks, so that they can pass each other's position without colliding. At which instant in time is car-A overtaking the car-B ?
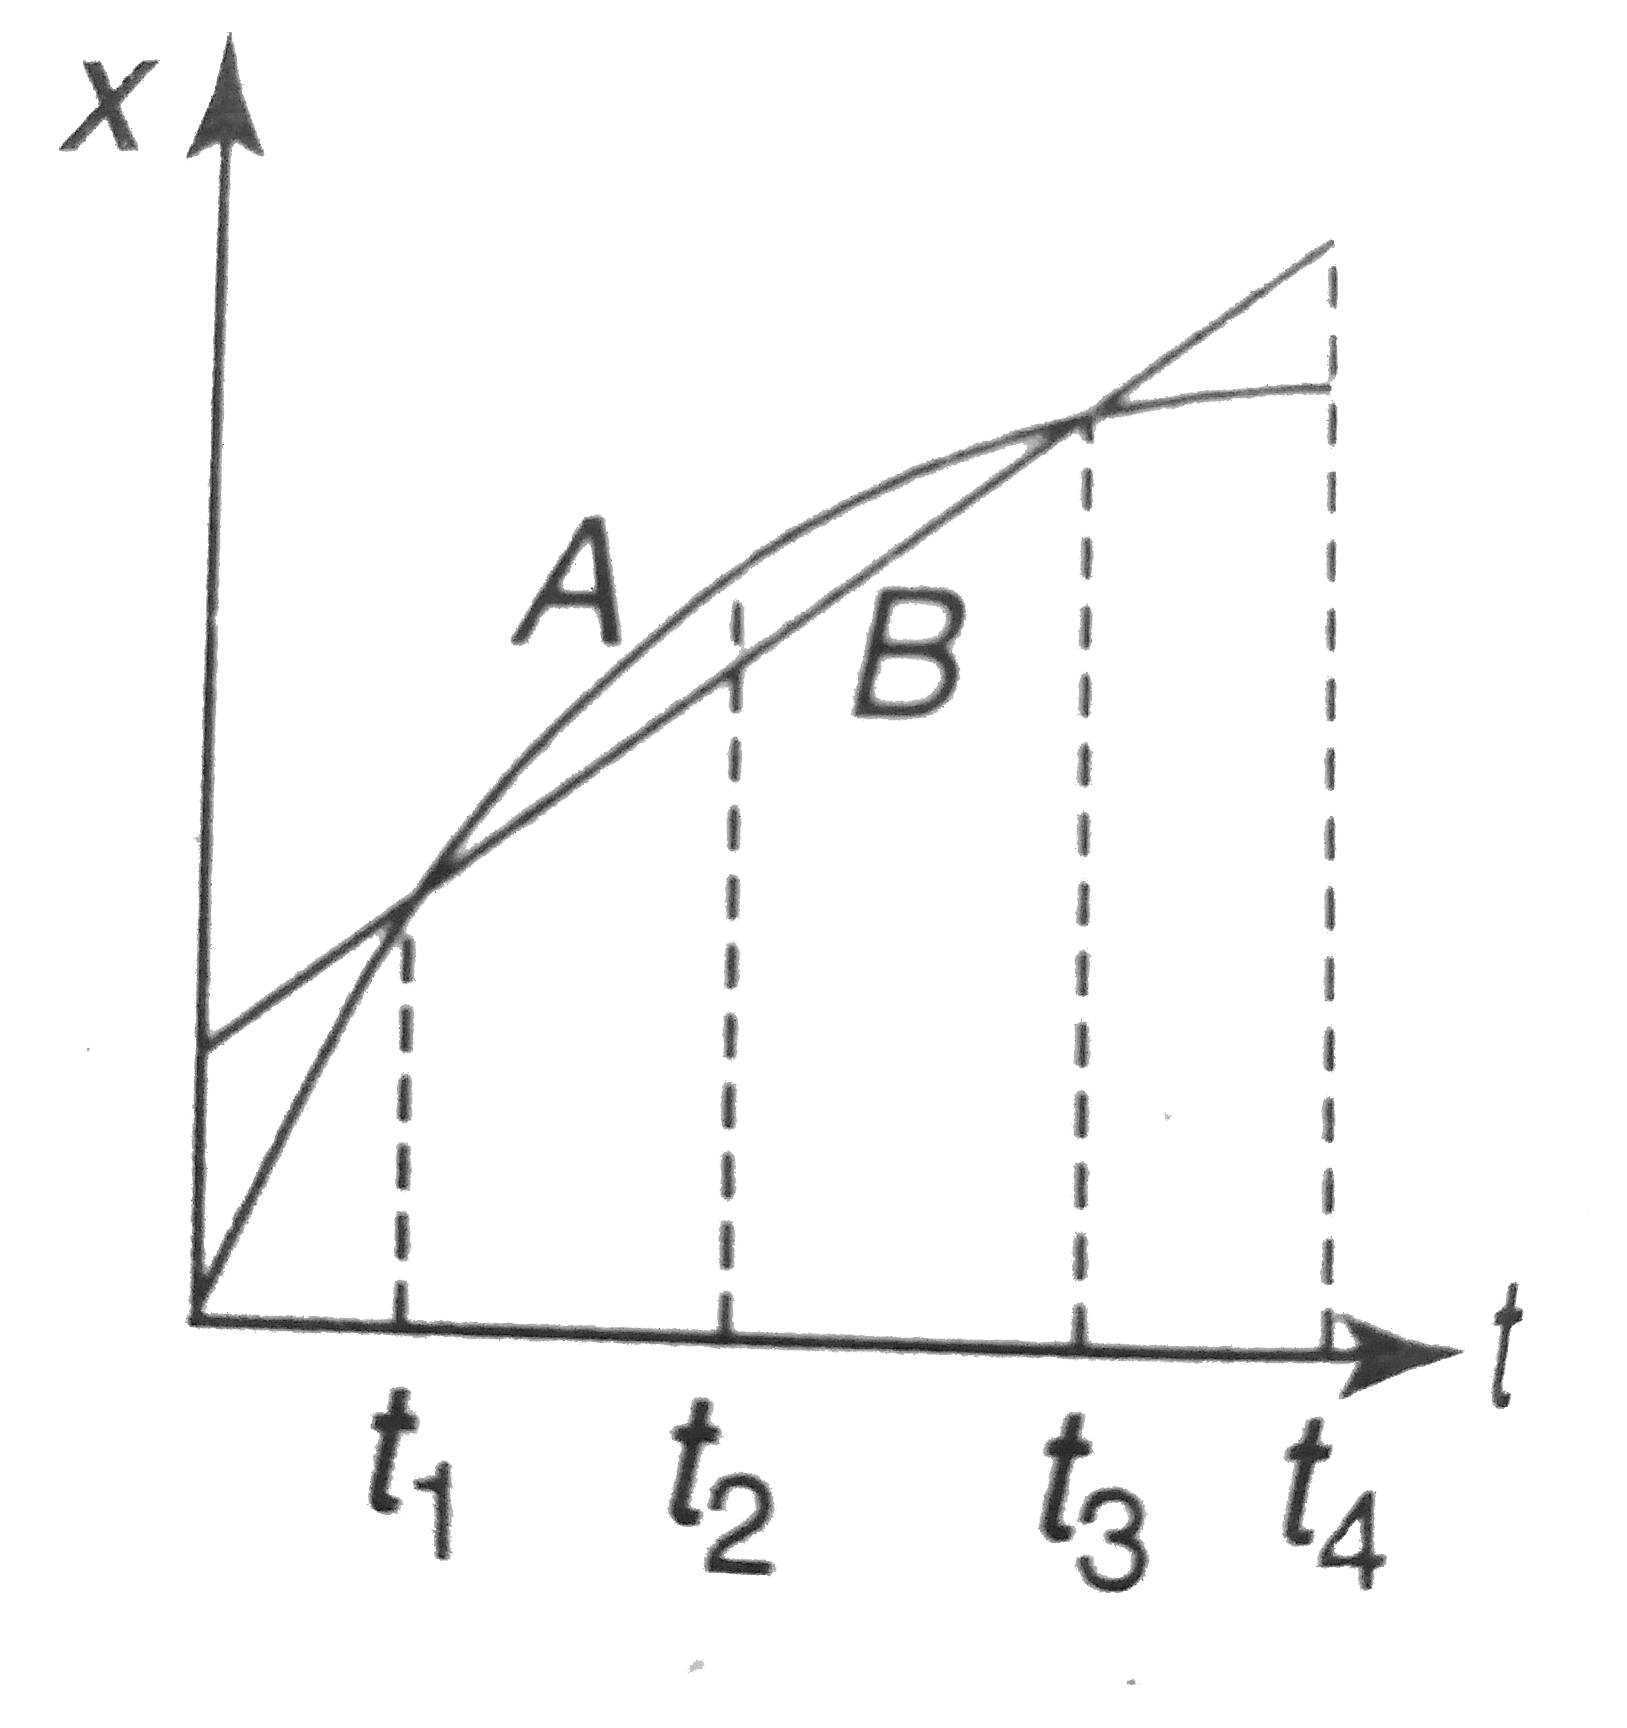
View SolutionRefer `Q.149`. At time `t_3`. Which car is moving faster ?
View Solution
Understanding Motion Through Graphs questions and complete solutions for chapter GENERAL KINEMATICS AND MOTION IN ONE DIMENSION of A2Z PHYSICS (HINGLISH) of Class 11