Complete Solutions to Miscellaneous Illustrations of chapter MEASURES OF CENTRAL TENDENCY MEDIAN AND MODE of Class 11 book with complete answers and questions
| Class 11 | ECONOMICS |
| Chapter | MEASURES OF CENTRAL TENDENCY MEDIAN AND MODE |
| TARUN JAIN & VK OHRI | Miscellaneous Illustrations |
| Number Of Questions | 30 |
| Academic Year | 2023-24 |
The following sercies show marks in Statistics of 9 students in Class XI . Find the median marks.
`{:("Marks",22,16,18,13,15,19,17,20,23):}`
View SolutionCalculate median from the following data :
`{:(200,217,316,264,296,282,317,299):}`
View SolutionFollowing are the marks obtained by a batch of 10 students in a certain class test in Statistics (X) and Accountancy (Y) :
`{:("Roll Number",1,2,3,4,5,6,7,8,9,10),("Statistics (X)",63,64,62,32,30,60,47,46,35,28),("Accountancy(Y)",68,66,35,42,26,85,44,80,33,72):}`
In which subject is level of Knowledge of students higher ?
View SolutionCalculate the median from the following data :
`{:("Size",10,12,14,16,18,20,22),("Frequency",2,5,12,20,10,7,3):}`
View SolutionThe following table gives the marks obtained by some students.
Calculate the median marks obtained by the students.
`{:("Marks",0-5,5-10,10-15,15-20,20-25,25-30,30-35,35-40,40-45),("Number of Students"," "6," "12," "17," "30," "10," "10," "8," "5," "2):}`
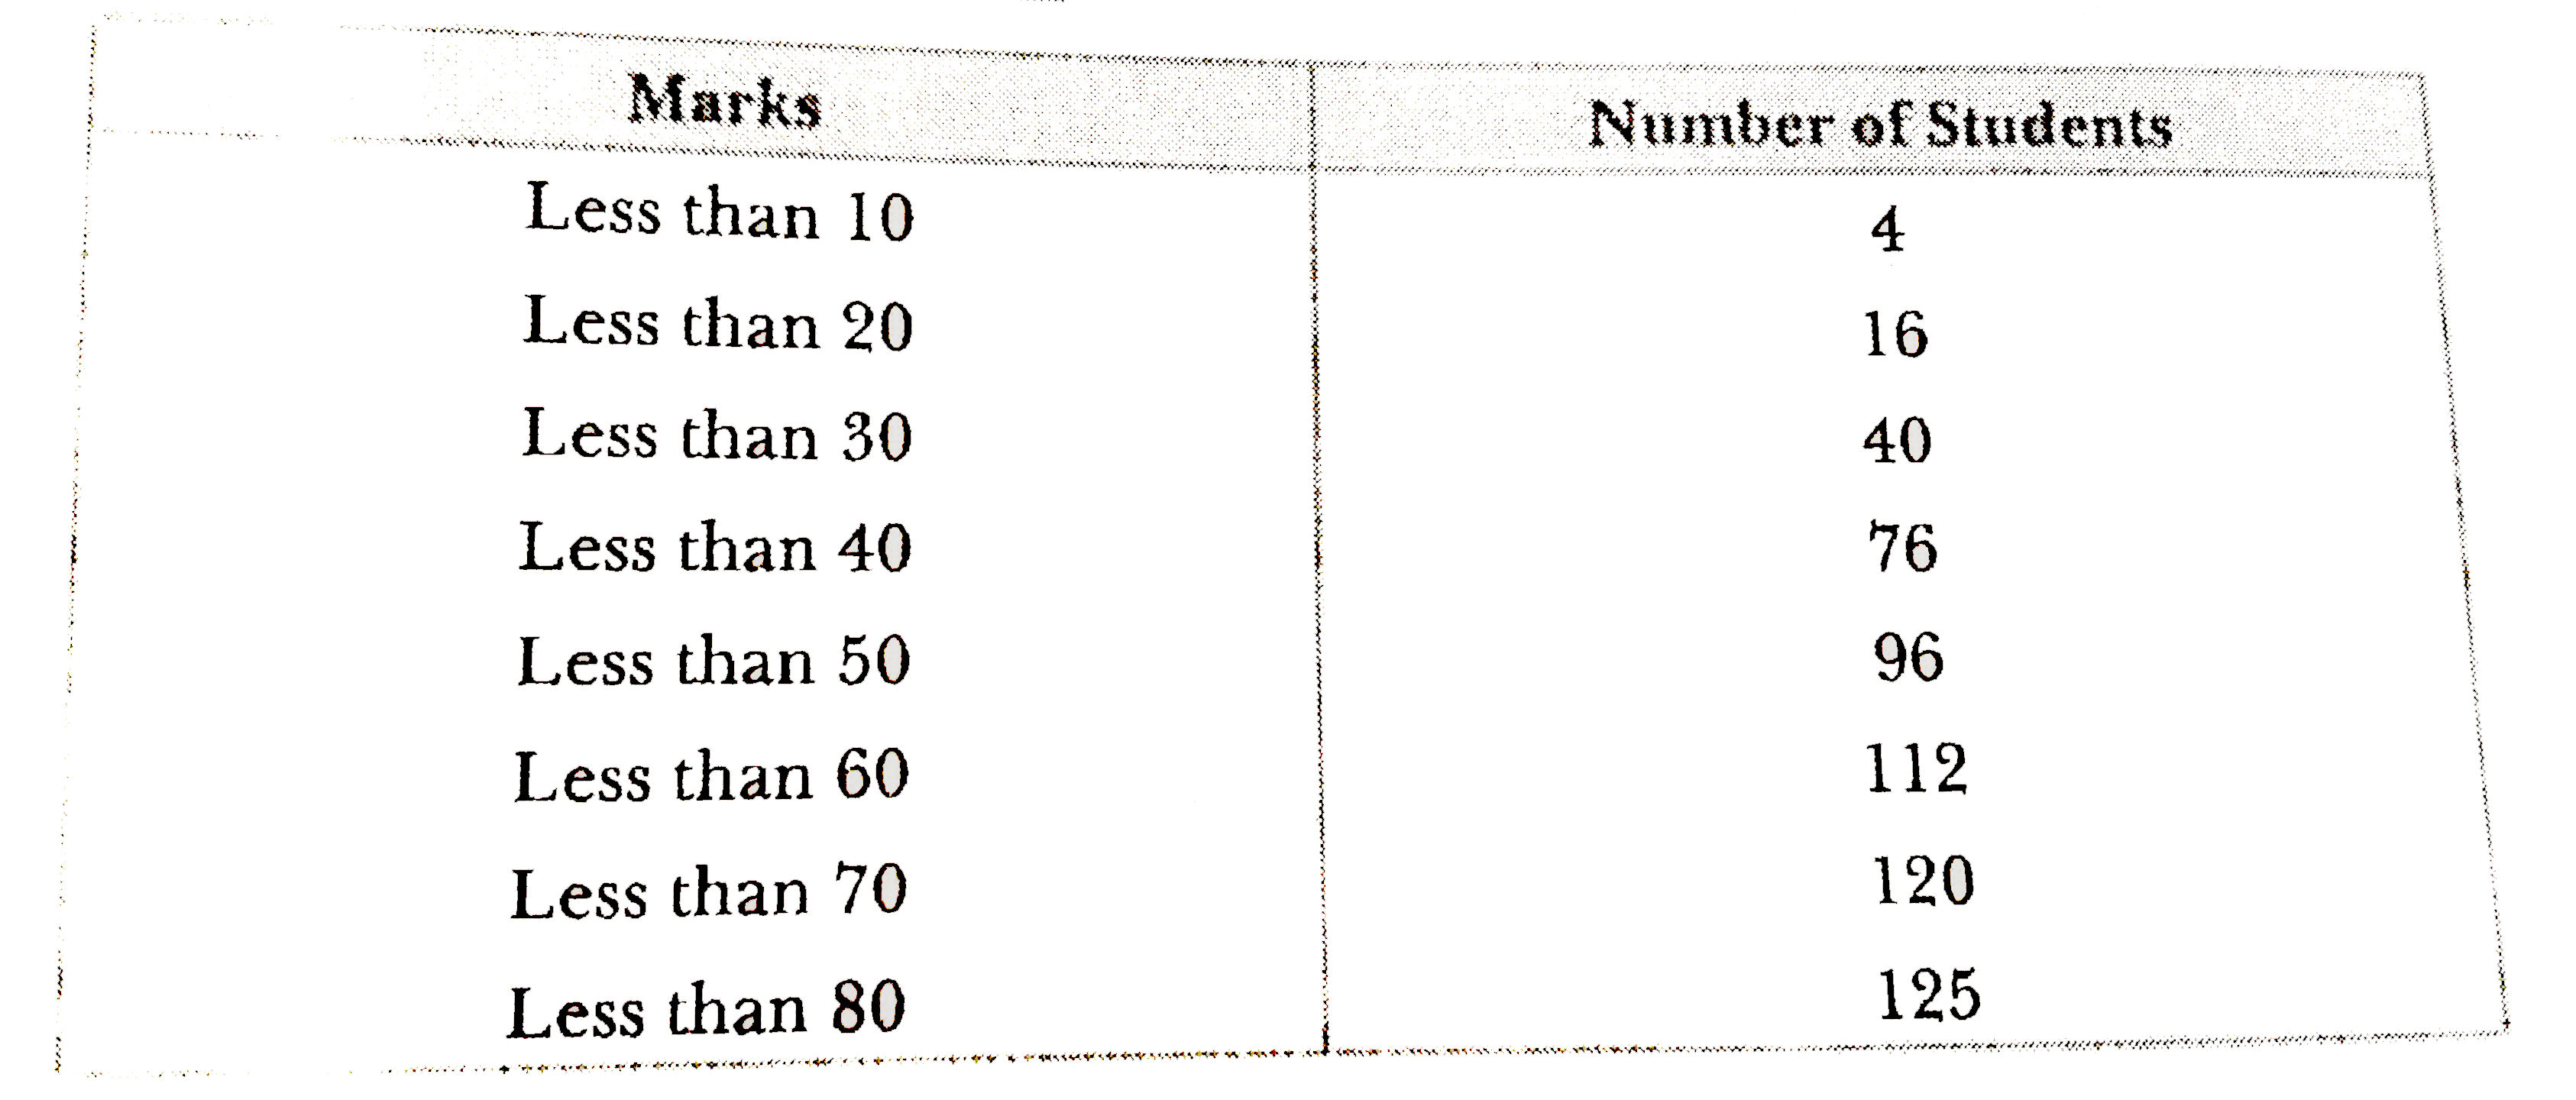
View SolutionCalculate median from the following data :

View SolutionCaculate median of the following distribution of data :
`{:("Class Interval",1-10,11-20,21-30,31-40,41-50),("Frequency"," "4," "12," "20," "9," "5):}`
View SolutionCalculate the median from the following data - set :
`{:("Size",10-15,15-17.5,17.5-20,20-30,30-35,35-40,40-50),("Frequency"," "10," "15," "17," "25," "28," "30," "40):}`
View SolutionCompute median from the following data :
`{:("Mid - value",5,15,25,35,45,55,65,75),("Frequency",15,7,11,10,13,8,20,16):}`
View SolutionFind the missing frequency of the group 20-30 when the median is 28.
`{:("Class Interval",0-10,10-20,20-30,30-40,40-50),("Frequency"," "5," "8," "?," "16," "6):}`
View SolutionCaculate `Q_(1),Q_(3),D_(9)andP_(70)` from the following data :
`{:(120,187,170,180,192,150,190,181,200,210):}`
View SolutionCalculate median , quartiles , 6th decile and 70 th percentile from the following data :
`{:("Marks (less than)",80,70,60,50,40,30,20,10),("Number of Students",100,90,80,60,32,20,13,5):}`
View SolutionFollowing is the distribution of marks in Economics obtained by 50 students :
`{:("Marks (more than)",0,10,20,30,40,50),("Number of Students",50,46,40,20,10,3):}`
Calculate the median marks . If 60% of the students pass this test , find the minimum marks obtained by a pass candidate.
View SolutionFind the mode from the following data :
8,10,5,8,12,7,8,9,11,7
View SolutionFrom the following data , determine the mode by grouping method :
`{:("Size",7,8,9,10,11,12,13,14,15,16,17),("Frequency",2,3,6,12,20,24,25,7,5,3,1):}`
View SolutionCaculate the mode from the following data :
`{:("Wages (Rs.)",0-5,5-10,10-15,15-20,20-25,25-30,30-35),("Number of Workers"," "3," "7," "15," "30," "20," "10," "5):}`
View SolutionCalculate the mode from the following data :
`{:("Class Interval",20-24,25-29,30-34,35-39,40-44,45-49,50-54,55-59),("Frequency"," "3," "5," "10," " 20," "12," "6," "3," "1):}`
View SolutionThe mode and mean are 26.6 and 28.1 respectively in an asymmetrical distribution . Find out the value of median .
View SolutionCalculate the median of the following items :
15,23,20,20,23,35,26,27,25,40
View SolutionFind out median marks from the following data :
`{:("Marks",0-10,10-20,20-30,30-40,40-50),("Number of Students"," "8," "30," "40," "12," "10):}`
View SolutionFollowing is the distribution of marks in Statistics obtained by 32 students :
`{:("Mid - value",5,15,25,35,45,55),("Frequency",4,6,10,7,3,2):}`
Caculate the median marks.
View SolutionFind the missing frequency of the group 20-30 when the median is 24.
`{:("Size",0-10,10-20,20-30,30-40,40-50),("Frequency"," "5," "25," "-," "18," " 7):}`
View SolutionLocate the median graphically from the following data :
`{:("Marks",0-10,10-20,20-30,30-40,40-50),("Number of Students"," "10," " 20," " 30," " 20," " 10):}`
View SolutionCalculate `Q_(1),Q_(3),D_(7)and P_(89)` from the following data :
`{:("Size",1,2,3,4,5,6,7,8,9,10,11),("Frequency",5,8,15,22,36,44,28,17,12,9,3):}`
View SolutionThe marks obtained by 100 students of a school are given below.
`{:("Marks",0-5,5-10,10-15,15-20,20-25,25-30,30-35,35-40),("No . of Students"," "4," "6," "10," "10," "25," "22," "18," "5):}`
Find out `Q_(1),Q_(3),D_(6)and P_(95)`.
View SolutionFind the mode from the following data :
5,8,4,5,5,8,4,7,8,5
View SolutionCalculate mode from the following data :
`{:("Class Interval",30-40,40-50,50-60,60-70,70-80,80-90,90-100),("Frequency"," "3," "4," "6," "10," "6," "4," "3):}`
View SolutionCalculate mean in an asymmetrical distribution if mode is 16 and median is 15.73.
View SolutionThe arithmetic mean , the mode and the median of a group of 75 observations were calculate to be 27, 34 and 29 respectively. It was later discovered that one observation was wrongly read as 43 instead of the correct value 53. Examine to what extent the calculate values of the averages will be affected by the error.
View SolutionCalculate mean , median and mode from the following data :
`{:("Class Interval",30-40,40-50,50-60,60-70,70-80,80-90),("Frequency"," "18," "37," "45," "27," "15," "8):}`
View Solution
Miscellaneous Illustrations questions and complete solutions for chapter MEASURES OF CENTRAL TENDENCY MEDIAN AND MODE of VK GLOBAL PUBLICATION ECONOMICS (HINGLISH) of Class 11