Complete Solutions to EXAMPLE of chapter DATA HANDLING of Class 7 book with complete answers and questions
| Class 7 | MATHS |
| Chapter | DATA HANDLING |
| GOYAL BROTHERS PUBLICATION | EXAMPLE |
| Number Of Questions | 22 |
| Academic Year | 2023-24 |
Given below are the heights (in cm) of 11 boys of a class :
149, 142, 154, 146, 143, 152, 148, 132, 140, 139, 128
Arrange the above data in an ascending order and find
(i) the height of the tallest boy
(ii) the height of the shortest boy
(iii) the range of the given data
(iv) the mean height
View SolutionFind the mean weight of 40 boys from the following data :
`{:("Weight (in kg)",27,28,29,30,31),("Number of boys",6,12,10,8,4),("(Frequency)",,,,,):}`
View SolutionIf the mean of the following frequency distribution is 8, find the value of p.
`{:("Variable"(x_(i)),3,5,7,9,11,13),("Frequency"(f_(i)),6,8,15,p,8,4):}`
View SolutionFind the median of :
16, 9, 11, 23, 7, 5, 12, 14, 8, 10, 21
View SolutionThe marks obtained (out of 100) by 12 students in an examination are
74, 96, 87, 65, 99, 82, 76, 92, 66, 75, 85, 90
Find the median marks.
View SolutionFind the median of the first 10 even numbers.
View SolutionFind the median for the following frequency distribution :
`{:("Marks obtained"(x_(i)),29,32,34,27,42,37),("Number of students"(f_(i)),2,5,10,12,8,4):}`
View SolutionThe shoe sizes of 30 players selected for interschool competitions are given below :
`{:("Shoe size"(x_(i)),7,10,9,8,5,11,6),("Number of players"(f_(i)),4,5,8,3,5,2,3):}`
Find the median of this frequency distribution.
View SolutionGiven below are the number of overs thrown by 11 players of a team in a one-day match:
3, 4, 4, 0, 8, 6, 7, 4, 6, 0, 8
Find th modal number of overs thrown.
View SolutionGiven below is the number of vehicles possessed by 100 household in a locality.
`{:("Number of vehicles",1,2,3,4,5,6),("Number of households",17,21,13,34,10,5):}`
What is the modal number of vehicles possessed?
View SolutionGiven below are the number of family members in 50 families of a locality :
`{:("Number of members",2,3,4,5,6,7,8),("Number of families",5,11,3,8,6,9,8):}`
For this frequency distribution, calculate the mean and median.
Using empirical formula, calculate its mode.
View Solution60 students from a certain locality use different modes of travel to school as given below :
`{:("Mode of travel","Car","Bus","Scooter","Bicycle","Rickshaw"),("Number of students",6,15,10,18,11):}`
View SolutionThe percentage of marks obtained by a student in different subjects are given below.
`{:("Subject","Hindi","Science","English","Mathematics","Social Studies"),("Percentage of",35,60,15,75,40),("marks obtained",,,,,):}`
Draw a bar graph representing the above data.
View SolutionGiven below is a bar graph showing the heights of six mountain peaks.
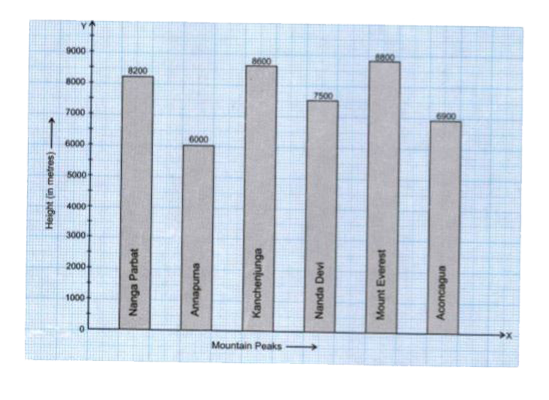
Read the above bar diagram and answer the following questions :
What is the highest mountain peak?
View SolutionGiven below is a bar graph showing the heights of six mountain peaks.
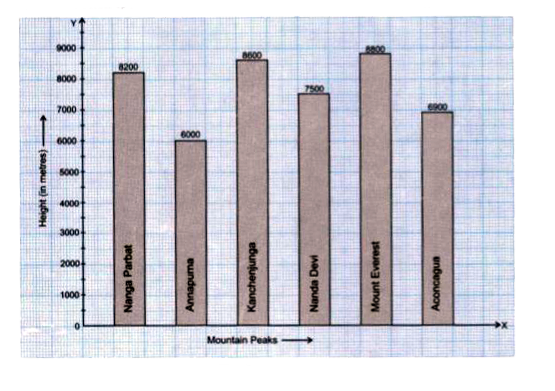
Read the above bar diagram and answer the following questions :
Find the ratio between highest and lowest mountain peak
View SolutionGiven below is a bar graph showing the heights of six mountain peaks.
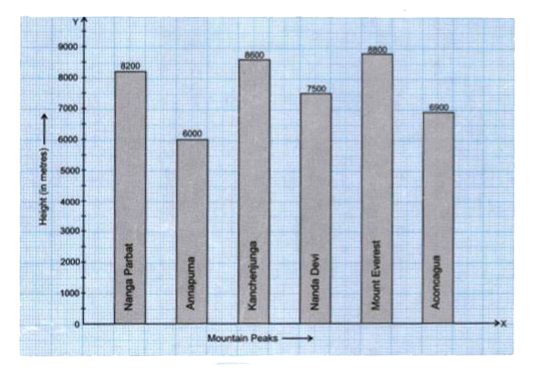
Read the above bar diagram and answer the following questions :
what is information given in the graph
View SolutionGiven below is a bar graph showing the heights of six mountain peaks.
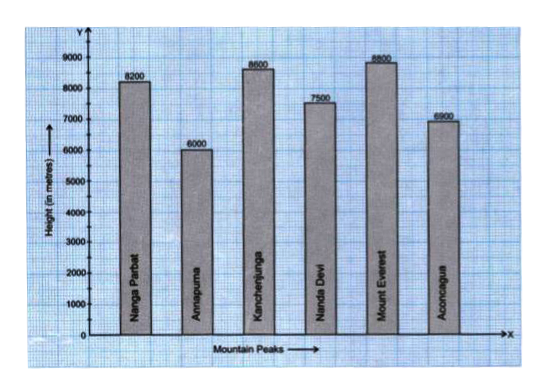
Read the above bar diagram and answer the following questions :
Which peak is second highest and what is it's height.
View SolutionObserve the bar graph given below :
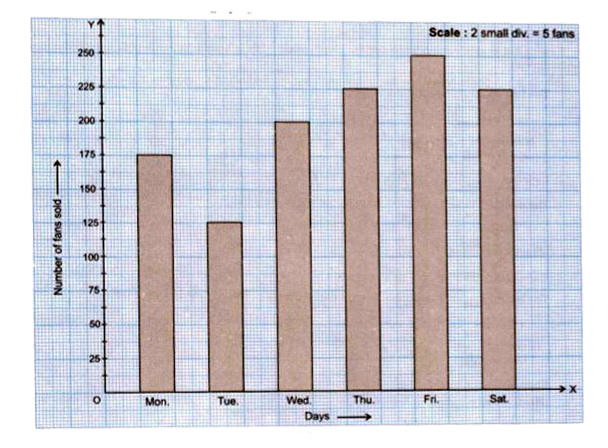
Read the bar graph carefully and answer the following questions :
What information is given by the bar graph?
View SolutionObserve the bar graph given below :
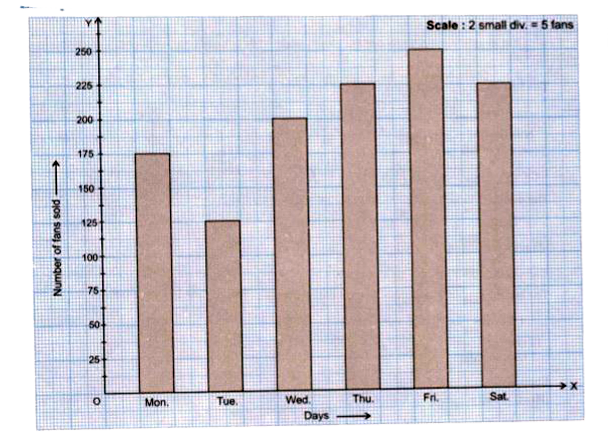
Read the bar graph carefully and answer the following questions :
On which day of the week was the sale maximum?
View SolutionObserve the bar graph given below :
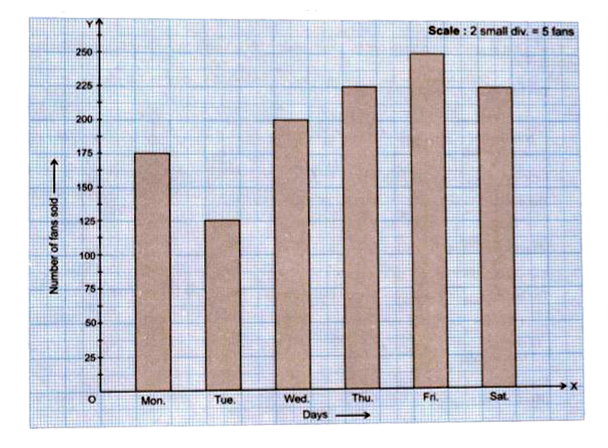
Read the bar graph carefully and answer the following questions :
On which day of the week there was maximum increase in sale compared to the previous day?
View SolutionObserve the bar graph given below :
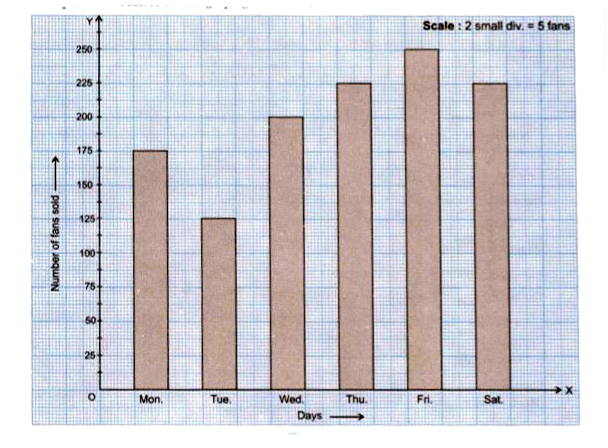
Read the bar graph carefully and answer the following questions :
What was the total sale during the week?
View SolutionObserve the bar graph given below :
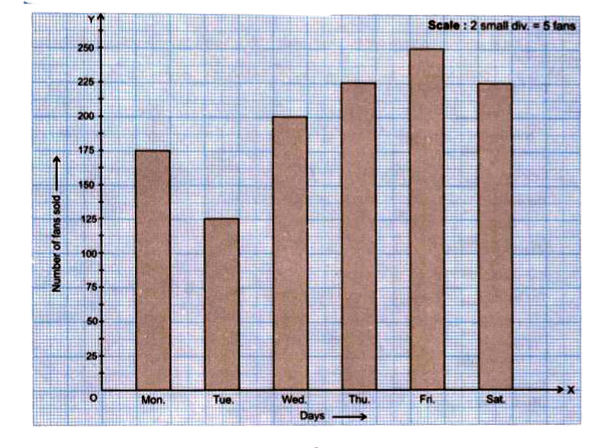
Read the bar graph carefully and answer the following questions :
What is the ratio between the minimum sale and the maximum sale?
View Solution
EXAMPLE questions and complete solutions for chapter DATA HANDLING of ICSE of Class 7