Complete Solutions to EXERCISE 24D of chapter DATA HANDLING of Class 7 book with complete answers and questions
| Class 7 | MATHS |
| Chapter | DATA HANDLING |
| GOYAL BROTHERS PUBLICATION | EXERCISE 24D |
| Number Of Questions | 13 |
| Academic Year | 2023-24 |
The following table shows the favourite sports of 250 students in a school :
`{:("Sports","Cricket","Football","Tennis","Badminton","Swimming"),("Number of students",75,35,50,25,65):}`
Represent the above data by a column graph.
View SolutionThe marks obtained by a student in his annual examination in various subjects are given below:
`{:("Subject","Hindi","Mathematics","English","Science","S.Studies"),("Marks obtained",64,40,52,80,36):}`
Represent the above data by a bar graph.
View SolutionThe birth-rate per thousand of five countries over a period of time is shown below :
`{:("Country","China","India","Germany","U.K.","Sweden"),("Birth-rate per",42,35,14,28,21),("thousand",,,,,):}`
Represent the above data by a bar graph.
View SolutionThe air distances of four cities from Delhi (in km) are given below :
`{:("City","Kolkata","Chennai","Mumbai","Hyderabad"),("Distance from",1340,1700,1100,1220),("Delhi (in km)",,,,):}`
Draw a bar graph to represent the above data.
View SolutionRead the given bar graph and answer the question that follow :
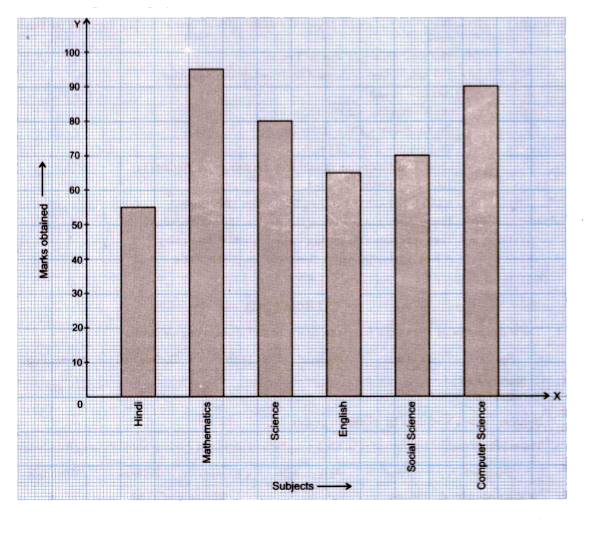
What information is represented by the bar graph?
View SolutionRead the given bar graph and answer the question that follow :
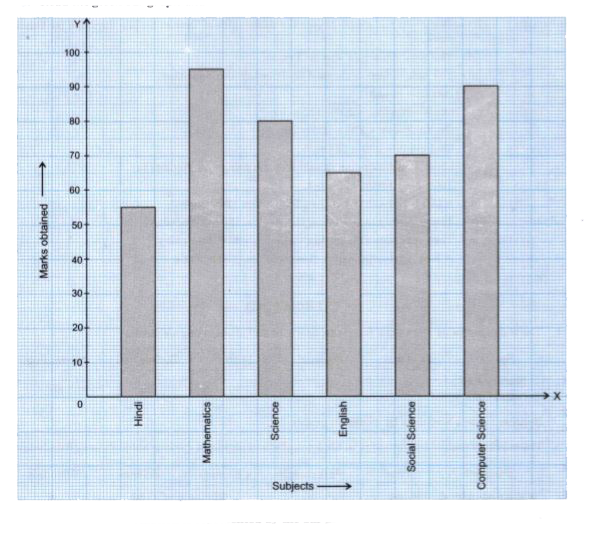
How many marks were obtained in English?
View SolutionRead the given bar graph and answer the question that follow :
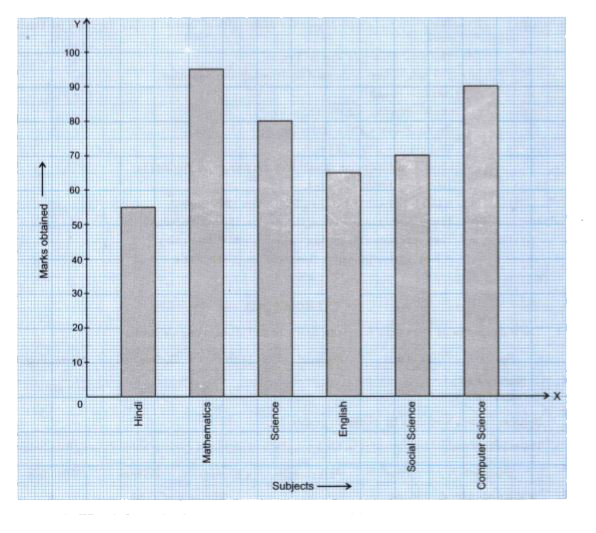
In which subject least marks were obtained?
View SolutionRead the given bar graph and answer the question that follow :
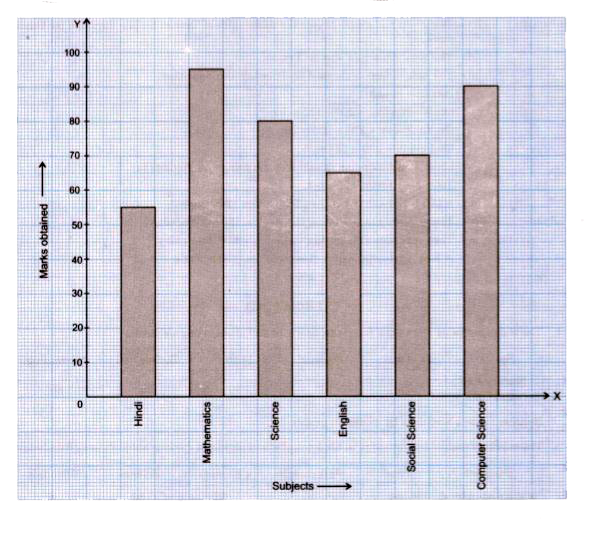
What was the total marks obtained in all the subjects together?
View SolutionRead the bar graph given below :
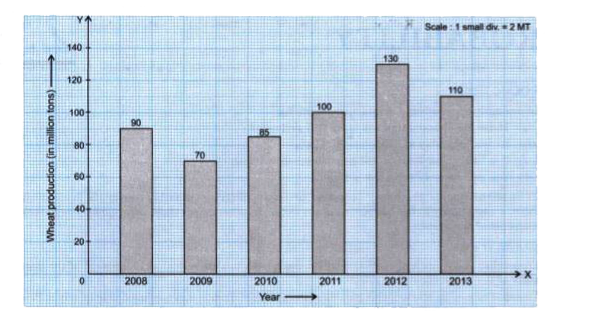
What information is given by the bar graph?
View SolutionRead the bar graph given below :
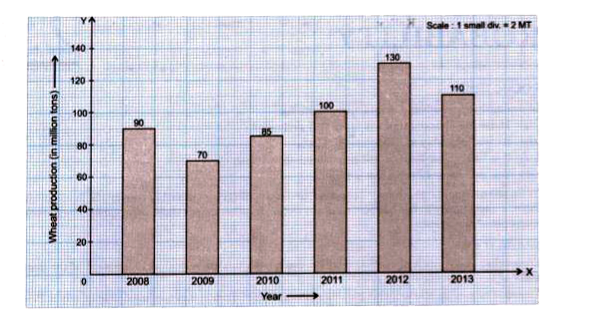
What was the wheat production in 2010?
View SolutionRead the bar graph given below :
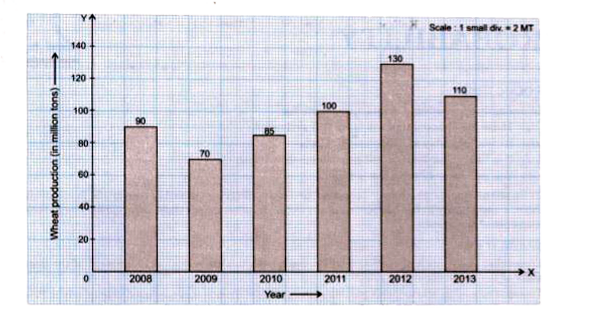
In which year the production was minimum?
View SolutionRead the bar graph given below :
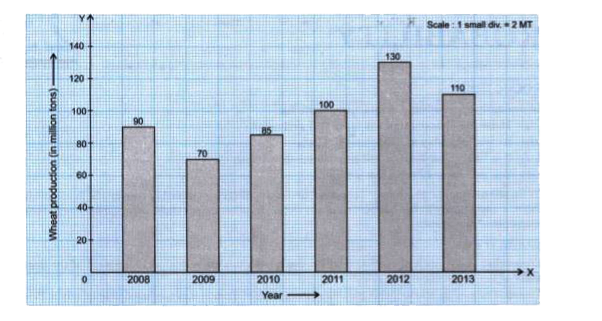
In which year there was maximum increase in production of wheat?
View SolutionRead the bar graph given below :
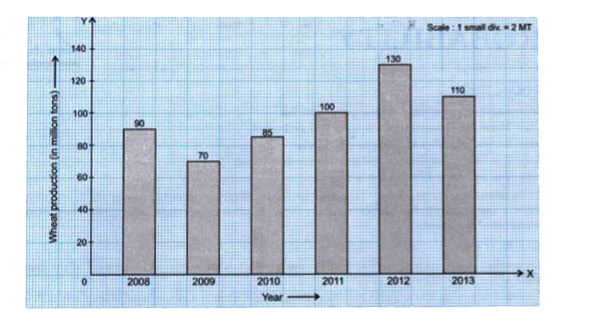
Find the percentage increase in wheat production in the year 2012.
View Solution
EXERCISE 24D questions and complete solutions for chapter DATA HANDLING of ICSE of Class 7