Given below is the number of vehicles possessed by 100 household in a locality.
Number of vehicles123456Number of households17211334105
What is the modal number of vehicles possessed?
The correct Answer is:4
To find the modal number of vehicles possessed by the households, we will follow these steps:
1. List the Data:
We have the following data:
- Number of vehicles: 1, 2, 3, 4, 5, 6
- Number of households: 17, 21, 13, 34, 10, 5
2. Create a Frequency Table:
We can represent the data in a frequency table:
|NumberofVehic≤s(x)|NumberofHouseholds(f)|⊢−−−−−−−−−−−−−−−−−−−−−−−⊢−−−−−−−−−−−−−−−−−−−−−−−−||1|17||2|21||3|13||4|34||5|10||6|5|
3. Identify the Highest Frequency:
From the frequency table, we look for the highest value in the "Number of Households" column:
- 17 (for 1 vehicle)
- 21 (for 2 vehicles)
- 13 (for 3 vehicles)
- 34 (for 4 vehicles)
- 10 (for 5 vehicles)
- 5 (for 6 vehicles)
The highest frequency is 34, which corresponds to 4 vehicles.
4. Conclusion:
Therefore, the modal number of vehicles possessed by the households is 4 vehicles.
We have the following data:
- Number of vehicles: 1, 2, 3, 4, 5, 6
- Number of households: 17, 21, 13, 34, 10, 5
We can represent the data in a frequency table:
|NumberofVehic≤s(x)|NumberofHouseholds(f)|⊢−−−−−−−−−−−−−−−−−−−−−−−⊢−−−−−−−−−−−−−−−−−−−−−−−−||1|17||2|21||3|13||4|34||5|10||6|5|
From the frequency table, we look for the highest value in the "Number of Households" column:
- 17 (for 1 vehicle)
- 21 (for 2 vehicles)
- 13 (for 3 vehicles)
- 34 (for 4 vehicles)
- 10 (for 5 vehicles)
- 5 (for 6 vehicles)
Therefore, the modal number of vehicles possessed by the households is 4 vehicles.
Topper's Solved these Questions
- BOOK - ICSECHAPTER - DATA HANDLING EXERCISE - EXERCISE 24A18videos
DATA HANDLING
- BOOK - ICSECHAPTER - DATA HANDLING EXERCISE - EXERCISE 24B10videos
DATA HANDLING
- BOOK - ICSECHAPTER - DATA HANDLING AND MEASURES OF CENTRAL TENDENCYEXERCISE - TRY THIS19videos
DATA HANDLING AND MEASURES OF CENTRAL TENDENCY
- BOOK - ICSECHAPTER - DECIMALS EXERCISE - TRY THIS41videos
DECIMALS
Similar Questions
Given below are the number of family members in 50 families of a locality :
Number of members2345678Number of families51138698
For this frequency distribution, calculate the mean and median.
Using empirical formula, calculate its mode.View SolutionA shoe store sells pairs of shoes of different sizes. The number of pairs of various sizes sold on a particular day are given below :
Size of shoes1234567891011Number of pairs sold35128243552
What is the modal shoe-size?View Solution
Knowledge Check
- Question 1 - Select One
To determine the mean number of children per household in a community, Tabitha surveyed 20 families at a playground. For the 20 families surveyed, the mean number of children per household was 2.4. Which of the following statements must be true?
AThe mean number of children per household in the community is 2.4.BA determination about the mean number of children per household in the community should not be made because the sample size is too smallCThe sampling method is flawed and may produce a biased estimate of the mean number of children per household in the community.DThe sampling method is not flawed and is likely to produce an unbiased estimate of the mean number of children per household in the community. - Question 2 - Select One
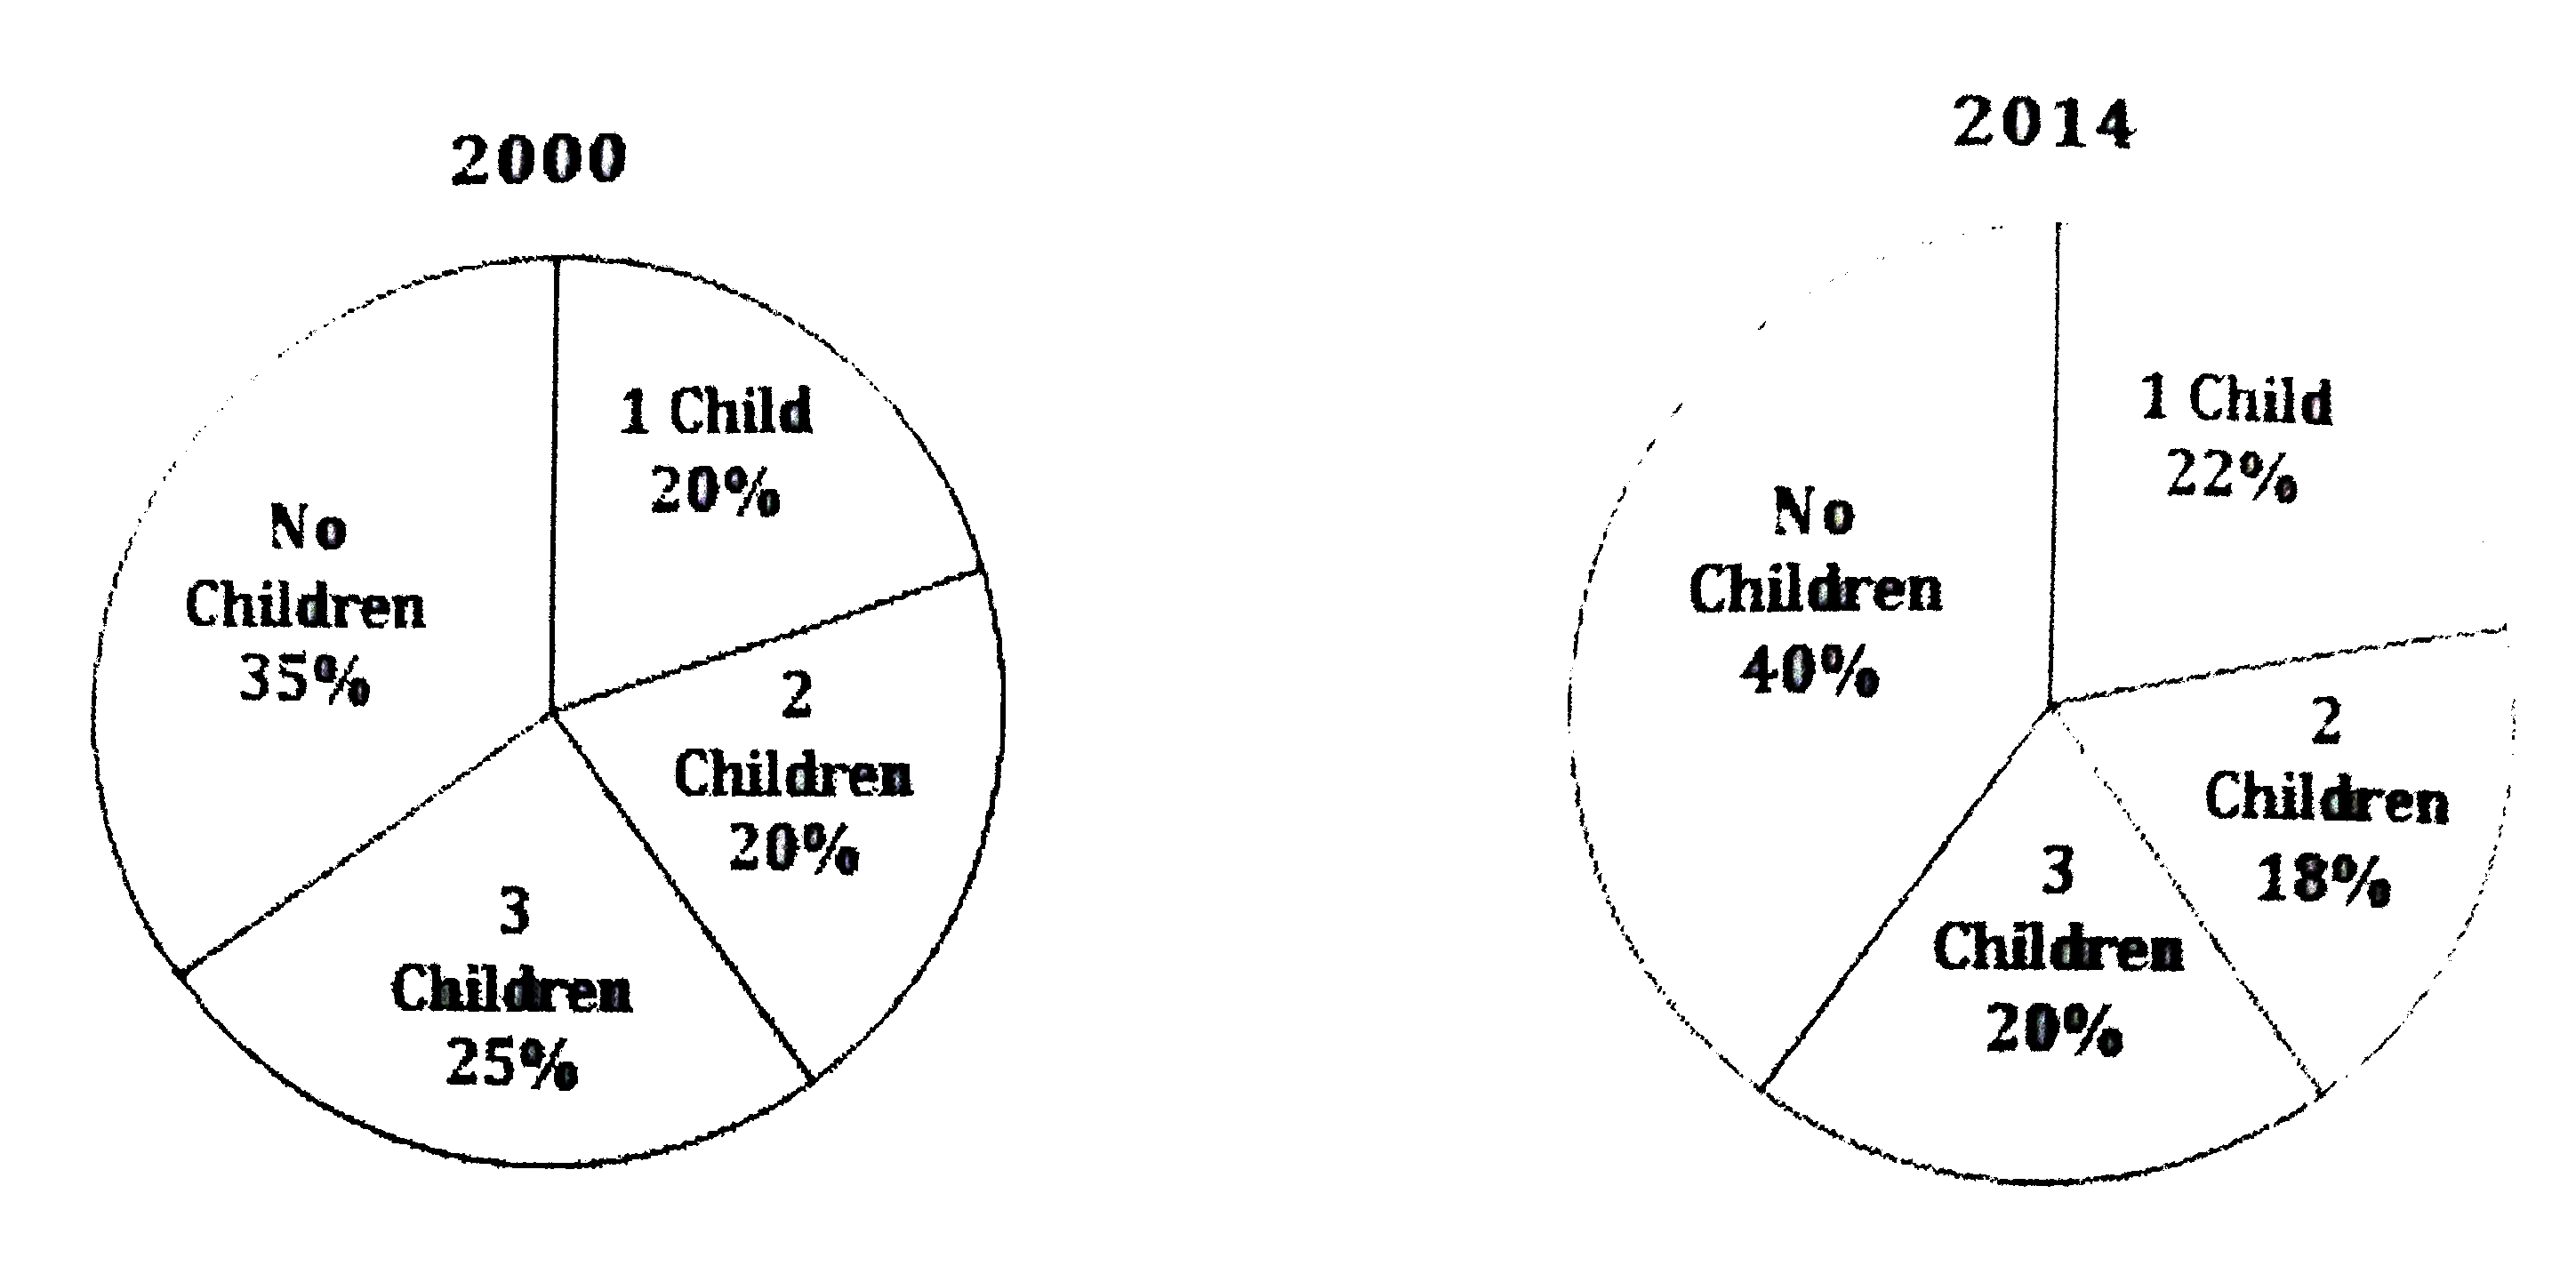
The following table gives the number of households in USA during 2000-2014.
The following charts give the distribution of households based on the numbers of children for the years 2000 and 2014.

The following charts give the distribution based on the number of childre for the year 2000 and 2014.

In 2000, 20 % of the household beloing to the category " no children " decided to have children . If those households had 1,2 and 3 children in the ratio of 4:2:1, respectively , what would be the share of households having 2 children ?A21.0%B22.0%C24.0%D26.4%
The following bar graph shows the number of vehicles passing through a road crossing in Delhi in different time intervals on a particular day. Read the bar graph and answer the following questions: What does the bar graph represent? Also, give the maximum number of vehicles. When is the hourly traffic maximum? Also give the minimum number of vehicles. When is the hourly traffic minimum? What is the total number of vehicles passing through a crossing during a particular day?
View SolutionThe number of children in 10 families of a locality are 2,4,3,4,2,0,3,5,1,6. Find the mean number of children per family.
View SolutionGiven below are the number of overs thrown by 11 players of a team in a one-day match:
3, 4, 4, 0, 8, 6, 7, 4, 6, 0, 8
Find th modal number of overs thrown.View SolutionThe numbers of children in 10 families of a locality are: 2, 4, 3, 4, 2, 3, 5, 1, 1, 5. Find the mean number of children per family.
View SolutionThe table below shows the daily expenditure on food of 25 households in a locality. daily expenditure(in rs) 100-150 150-200 200-250 250-300 300-350 no. of households 4 5 12 2 2 Find the mean daily expenditure on food by a suitable method.
View SolutionConsider the numbers 1,2,3,4,5,6,7,8,9,10. If 1 is added to each number, the variance of the numbers so obtained is
View Solution

