Complete Solutions to Solved Examples of chapter DATA HANDLING of Class 7 book with complete answers and questions
| Class 7 | MATHS |
| Chapter | DATA HANDLING |
| MTG IIT JEE FOUNDATION | Solved Examples |
| Number Of Questions | 30 |
| Academic Year | 2023-24 |
Given below is the data showing the number of children in 20 families of a locality :
3, 1, 3, 2, 2, 2, 0, 3, 4, 2, 1, 3, 2, 4, 1, 2, 2, 3, 1, 3
Arrange the data in ascending order and then prepare a frequency table04:34View SolutionGiven below is the heights (in cm ) of 16 girls in a class :
154,150,152,154,150,148,152,152,154,150,152,154,152,152,154,152
Arrange the data in ascending order and prepare the frequency table04:08View SolutionThe pocket - expenses of Rahul during a week are :
Rs 15.40, Rs 18.00, Rs 16.50, Rs 14.75, Rs 12.60, and Rs 17.25
Find his mean pocket - expenses02:36View SolutionThe heights of 7 players in a group are 175 cm, 158 cm, 180 cm, 164 cm, 182 cm, 160 cm and 171 cm .
find their mean height02:07View SolutionThe runs scored by 11 members of a cricket team are
25, 39, 53, 18, 65, 72, 0, 46, 31, 08, 34
Find the median score02:11View SolutionThe weights of 10 students (in kg) are
40, 52, 34, 47, 31, 35, 48, 41, 44, 38
Find the median weight.02:50View SolutionGiven below is the number of pairs of pairs of shoes of different sizes sold in a day by the owner of a shop

Find mode of given data01:14View SolutionThe marks obtained by 11 students of a class in a test are given below :
23, 2, 15, 38, 21, 19, 23, 23, 26, 34, 23
Find the mode of given data02:01View SolutionA batsman scored the following runs in six different innings :
37, 40, 50, 49, 60, 58
Calculate the mean of the runs scored by him01:21View SolutionFind the median of the give data :
10, 16, 13, 15, 22, 18, 1902:12View SolutionThe marks secured in English test (out of 30) by 10 students are as follows :
22, 25, 23, 20, 8, 16, 13, 5, 18, 25
Calculate the median03:04View SolutionThe heights of 10 students of Class VII are given below (in centimetres ) :
141, 151, 148, 162, 136, 143, 161, 150, 135, 145,
Find the range of the heights02:13View SolutionThe marks (out of 100) obtained by a group of students in Mathematics test are :
88, 74, 90, 88, 40, 46, 58, 96, 82, and 78. Find :
mean marks obtained by the group01:22View SolutionThe marks (out of 100) obtained by a group of students in Mathematics test are :
88, 74, 90, 88, 40, 46, 58, 96, 82, and 78. Find :
median of the marks obtained03:20View SolutionThe marks (out of 100) obtained by a group of students in Mathematics test are :
88, 74, 90, 88, 40, 46, 58, 96, 82, and 78. Find :
mode of the marks obtained01:59View SolutionThe marks (out of 100) obtained by a group of students in Mathematics test are :
88, 74, 90, 88, 40, 46, 58, 96, 82, and 78. Find :
range of the marks obtained01:04View SolutionRead the graph and answer the following questions
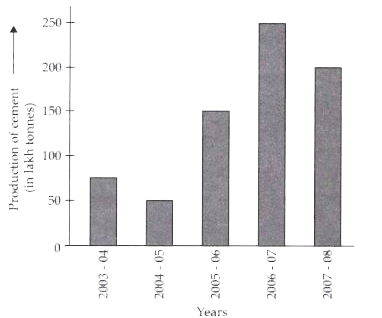
What information is conveyed by the bar graph01:41View SolutionRead the graph and answer the following questions
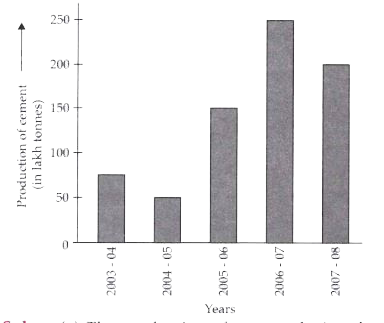
What was the production of cement in the year 2006-07 ?01:05View SolutionRead the graph and answer the following questions
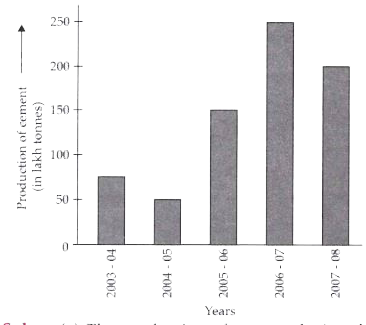
During which period, the production was minimum ?01:02View SolutionRead the graph and answer the following questions
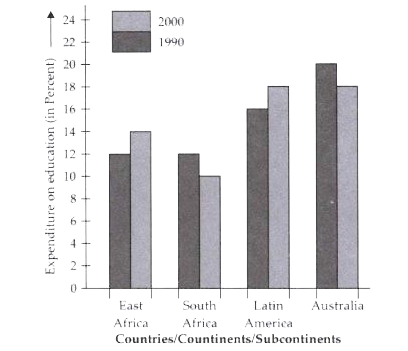
Give a suitable title to bar graph01:29View SolutionRead the graph and answer the following questions
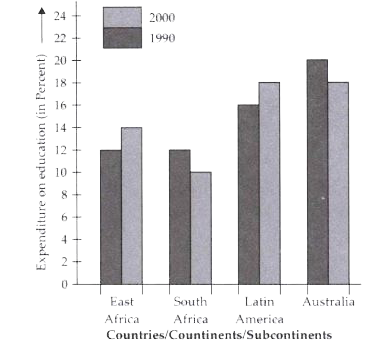
In which part the expenditure on education is maximum in 1990?01:34View SolutionRead the graph and answer the following questions
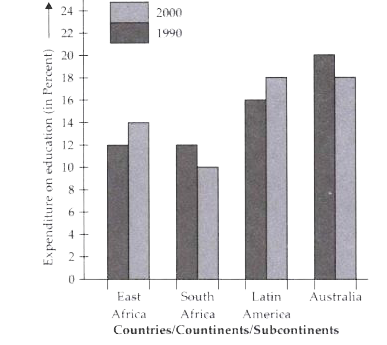
In which part other expenditure gone up form 1990 to 2000 ?01:24View SolutionTo know about the liking of Science as a subject , a survey of 200 students was conducted and the data obtained is given below :
Liking - 125, Disliking - 75
Find the probability that a student chosen at random
does not like Science as a subject01:49View SolutionTo know about the liking of Science as a subject , a survey of 200 students was conducted and the data obtained is given below :
Liking - 125, Disliking - 75
Find the probability that a student chosen at random
likes Science as a subject01:22View SolutionFind the probability of selecting shaded portion :
 01:16View Solution
Find the probability of selecting shaded portion :
 01:23View Solution
Find the probability of selecting shaded portion :
 01:26View Solution
The production of oil (in lakh tonnes) in some of the refineries in India during 2008 is given below :
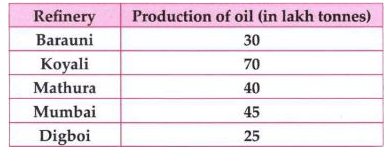
Construct a bar graph to represent the above data03:15View SolutionThe daily maximum and minimum temperature of a city during one week in the month a April is given below. Construct a double bar graph using this data
 09:16View Solution
Pocket money received by 7 students is given below
Rs 24, Rs 22, Rs 30, Rs 28, Rs 32, Rs 26, Rs 34
Find the range, mean and median of the data04:10View Solution
Solved Examples questions and complete solutions for chapter DATA HANDLING of MTG IIT JEE FOUNDATION of Class 7
All Exercises from MTG IIT JEE FOUNDATION Class 7 MATHS DATA HANDLING
- Exercise (Level - 1) M.C.Q
- Exercise (Level - 2) Match the Following
- Exercise (Level - 2) ( Long Answer Type )
- Exercise (Level - 2) Assertion & Reason Type
- Exercise (Level - 2) M.C.Q
- Exercise (Level - 2) Subjective Problems
- Exercise (Level - 2) Subjective Problems ( Long Answer Type )
- Exercise (Level - 2) Subjective Problems ( Shor Answer Type )
- Exercise (Level - 2) Subjective Problems (Very Shor Answer Type )
- Exercise (Level - 2)Comprehension Type
- Illustrations
- NCERT Section (Exercise - 3 .1 )
- NCERT Section (Exercise - 3 .2 )
- NCERT Section (Exercise - 3 .3 )
- NCERT Section (Exercise - 3 .4 )
- Olympiad / Hots Corner
- Solved Examples
