Complete Solutions to SOLVED EXAMPLES of chapter INTRODUCTION TO GRAPHS of Class 8 book with complete answers and questions
| Class 8 | MATHS |
| Chapter | INTRODUCTION TO GRAPHS |
| NCERT EXEMPLAR | SOLVED EXAMPLES |
| Number Of Questions | 12 |
| Academic Year | 2023-24 |
Every point on the x axis is of the form.
View SolutionThe given graph shows Nisha’s trip to a mall by a car. Observe the graph carefully and find what was she doing between 5 pm and 7 pm?
View SolutionIn a __________ graph, all the points on the graph lie on the same straight line.
View SolutionThe coordinates of the origin are ___________
View SolutionPoints (3, 4) and (4, 3) represent the same point on the graph.
View SolutionState True or False : The y coordinate of any point lying on the x axis will be 0.
View SolutionPlot the points (4, 4), (1, 3), (4, 2) and (7, 3) on a graph paper and connect them with line segments. Name the shape formed by these points.
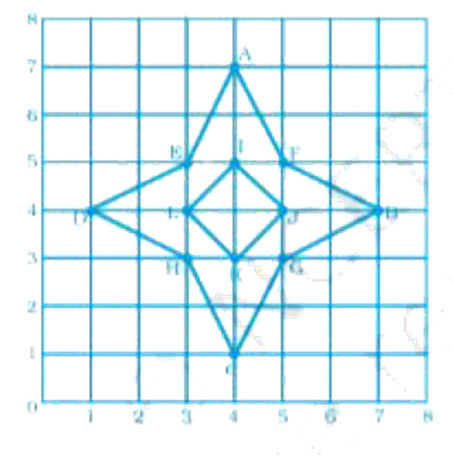
View SolutionWrite the coordinates of all the points in the given graph.

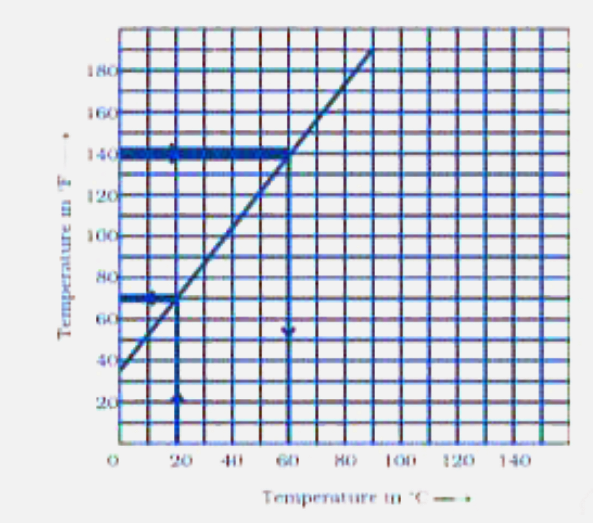
View SolutionThe following is a conversion graph of temperature in `""^(@)C and ^(@)F`.
Use the graph to answer the following questions.
(a0 Convert `140 ^(@)F ` to `""^(@)C.`
(b) Convert `20 ^(@)C ` to `""^(@)F`

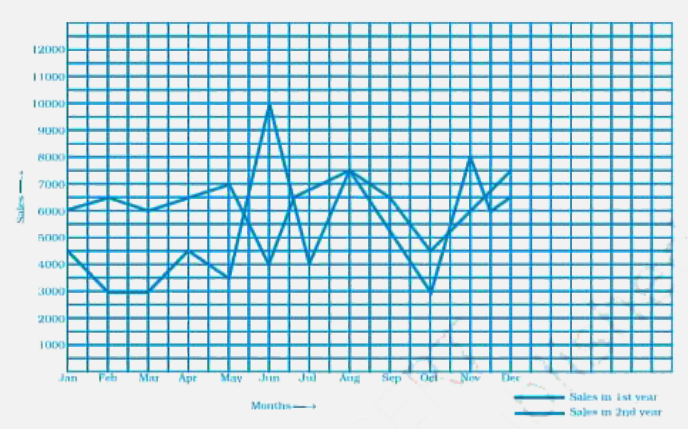
View SolutionFollowing graph shows a comparison of the approximate sale of items manufactured by a company for the first two years of its operation.
(a) In which months there was maximum difference in the sale of items of two years?
(b) In which year was there more stability in the sale of items ?
(c) In which month the sale remains the same in both the years ?
(d) In which month was the sales of first year less than that of second year?

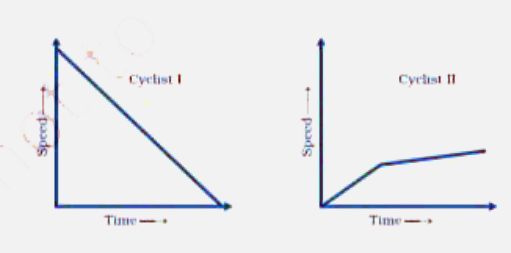
View SolutionThe given graphs show the progress of two different cyclists during a ride. For each graph, describe the rider’s progress over the period of time.

View SolutionA double bar graph is useful for the __________ of two sets of data.
Data represented in a circular form is called a _________ chart.
The graph of a linear equation is always a __________ line.
The cartesian system used two axes which are __________ to each other.
View Solution
SOLVED EXAMPLES questions and complete solutions for chapter INTRODUCTION TO GRAPHS of NCERT EXEMPLAR of Class 8