EXERCIES 18.2 from ICSE DATA HANDLING AND MEASURES OF CENTRAL TENDENCY for Class 7
| Class 7 | MATHS |
| Chapter | DATA HANDLING AND MEASURES OF CENTRAL TENDENCY |
| ICSE | EXERCIES 18.2 |
| Medium | English |
| Academic Year | 2023-2024 |
Question 7
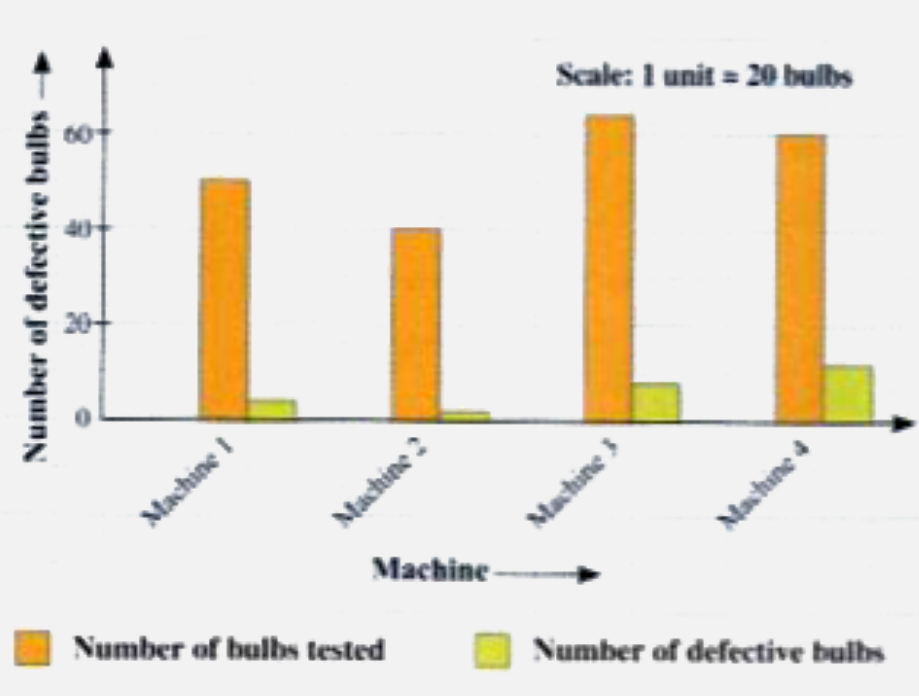
A bulb manufacturing company tests the bulbs produced by four different machines. The following graph gives the number of bulbs tested that are produced by each machine and the number that are found to be defective.

Read the graph and answer the following.
What percentage of bulbs produced by each of the four machines is defectiveView SolutionQuestion 8
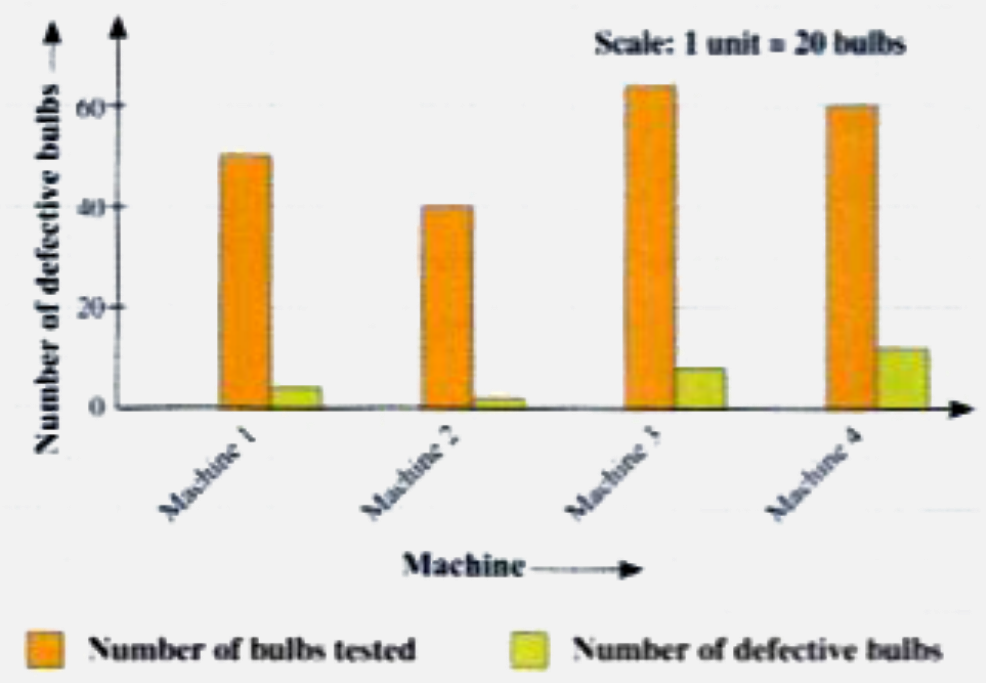
A bulb manufacturing company tests the bulbs produced by four different machines. The following graph gives the number of bulbs tested that are produced by each machine and the number that are found to be defective.

Read the graph and answer the following.
Which is the best machine? View SolutionQuestion 9
A bulb manufacturing company tests the bulbs produced by four different machines. The following graph gives the number of bulbs tested that are produced by each machine and the number that are found to be defective.

Read the graph and answer the following.
Which is the worst machined? View Solution


