State the percentage increase in the first division in the year 2003 as compared to the year 2002:
1 16%
2
3 45%
4 55%
Answer : 2. ""
Related Solutions
Manufacturing of five types of cars (A, B, C, D and E) in the year 2002 and 2003 Total number of construction in 2002 = 450000 Total number of construction in 2003 = 520000 Which type of car had the highest percentage increase in manufacturing numbers in 2003 as compared to the year 2002?
View SolutionThe graph shows the result of 10th class students of a school for 4 years. Study the graph and answer the questions :
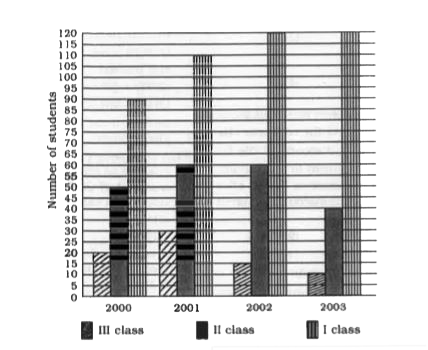
The percentage increase of first class in the year 2003 over the year 2002 is approximately
View Solutionएक विद्यालय में एक वर्ष 10% छात्र बढ़ जाते है दूसरे वर्ष 10% छात्र घट जाते है और यह क्रम चलता रहता है, यदि वर्ष 2000 में छात्रों की संख्या में वृद्धि हुई हो तो, 2003 में छात्रों के संख्या 2000 की तुलना में वृद्धि या कमी का प्रतिशत क्या रहा ?
View Solution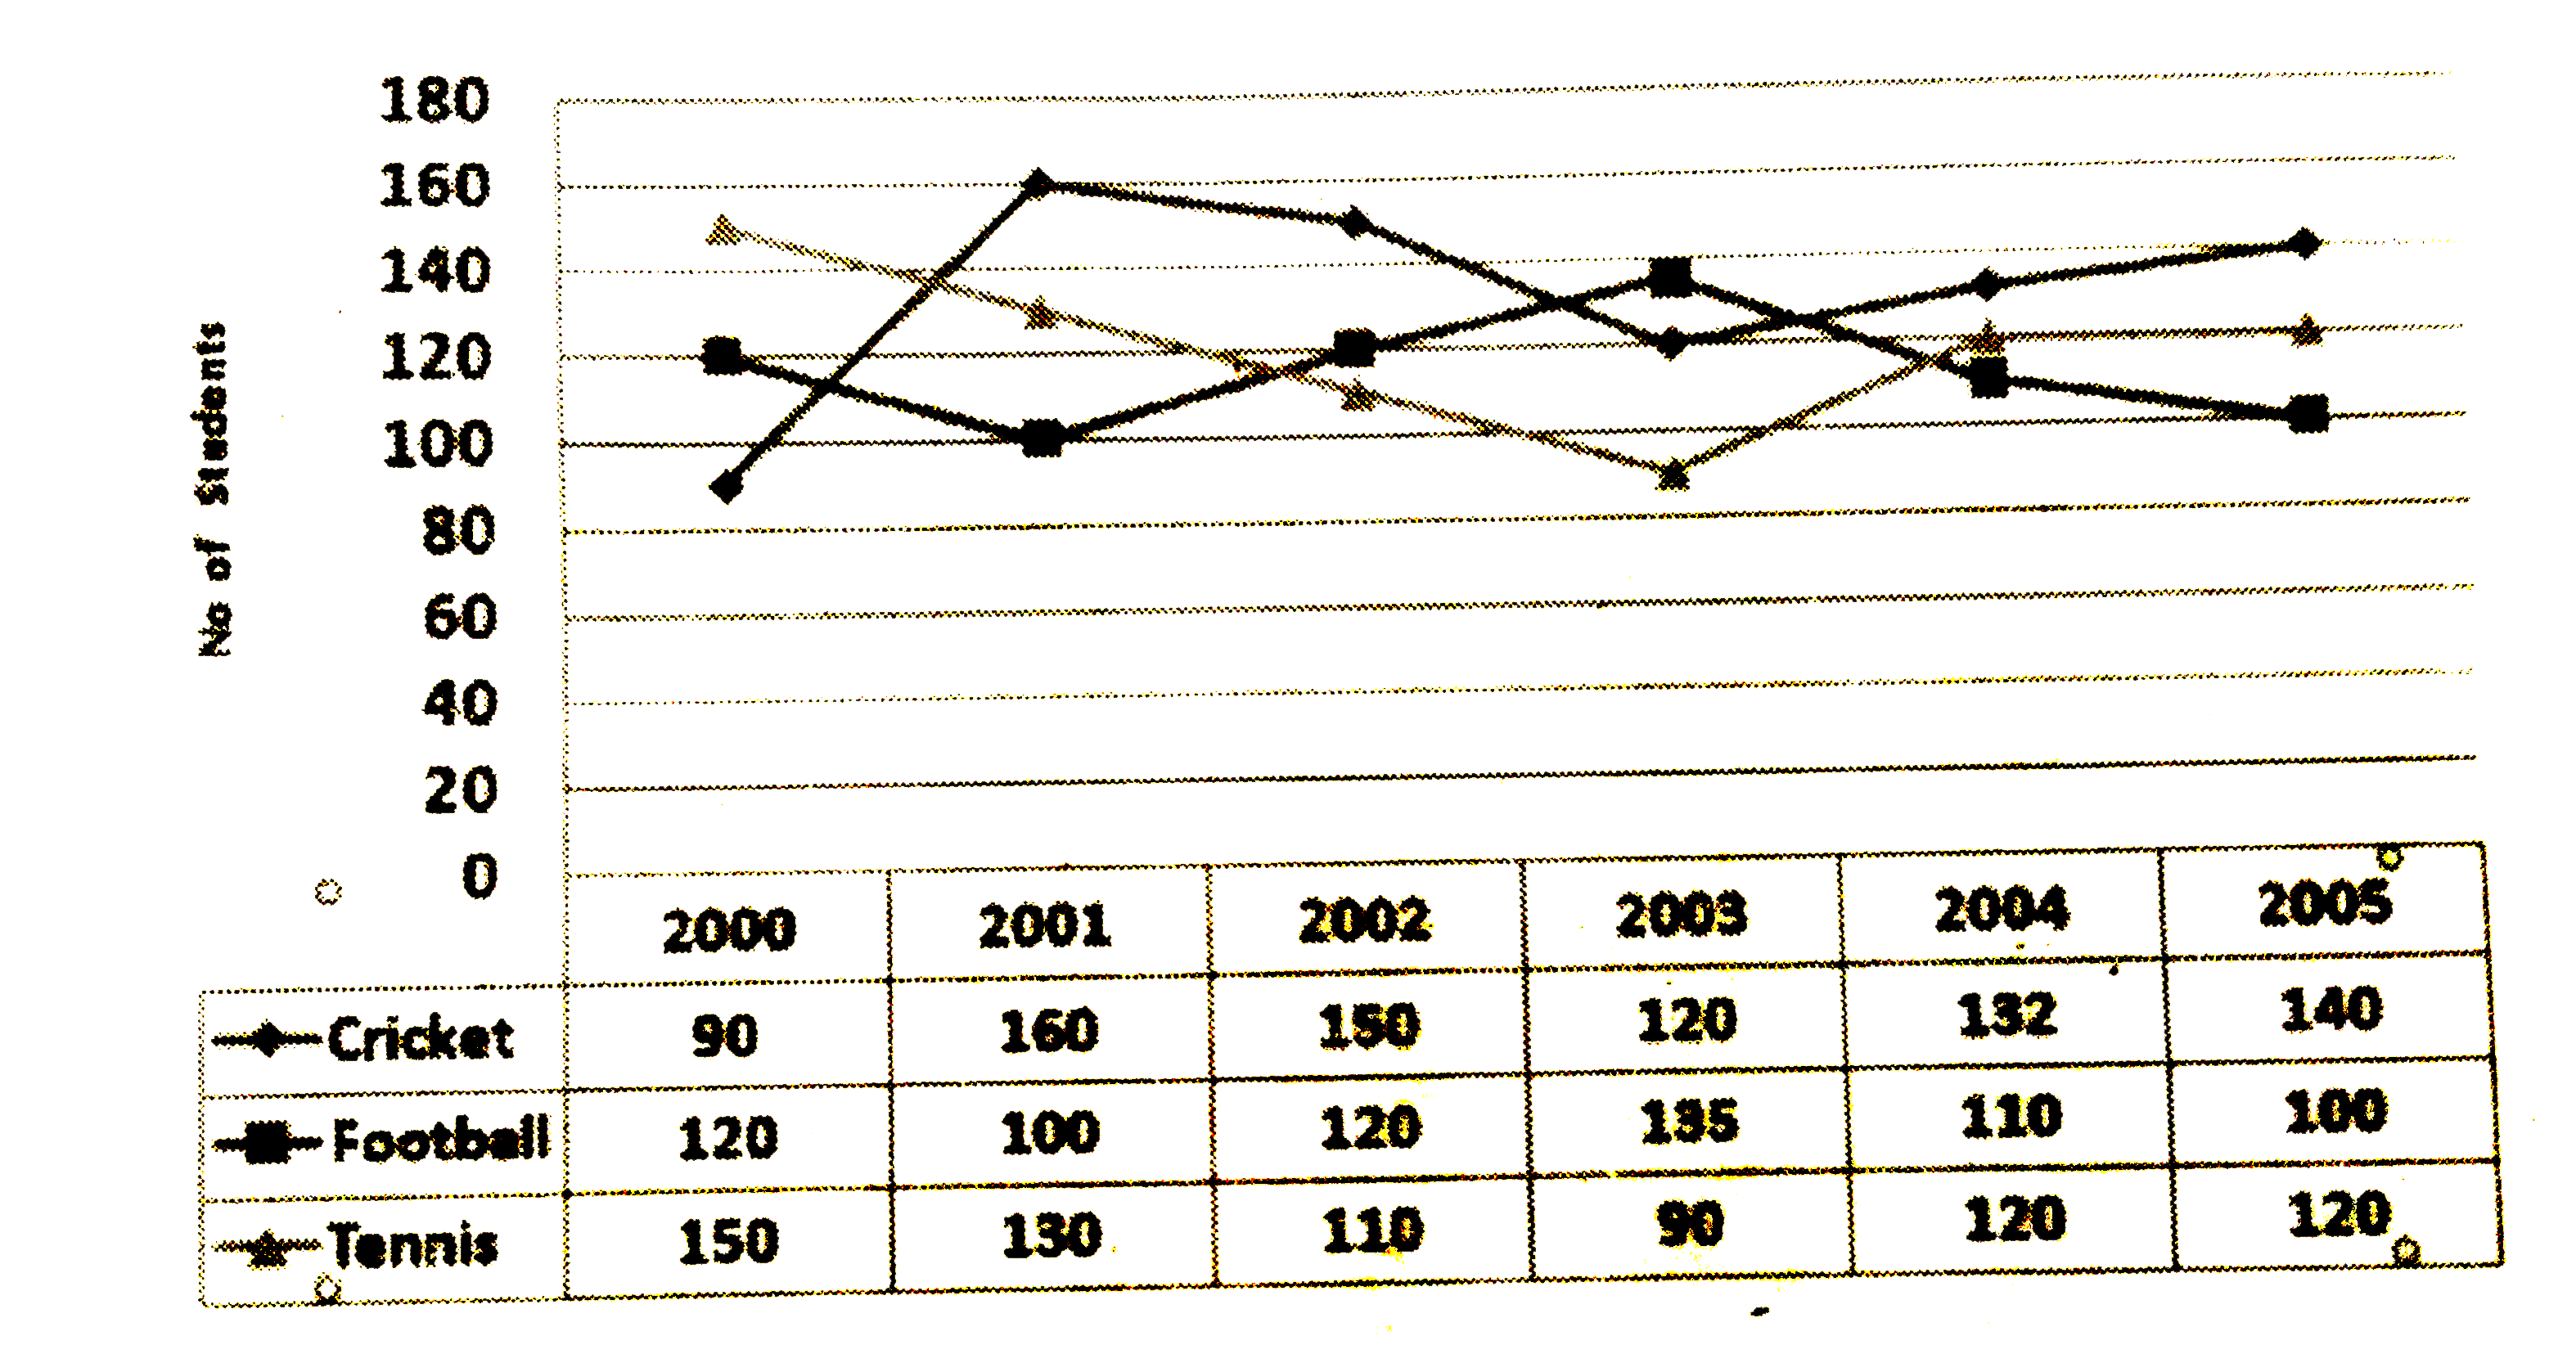
What was the decreases in the no of playars participating in Cricket in the year 2003 as compared to that in the year 2001 ?
View SolutionThe following table shows the productions of food-grains (in million tons) in a state for the period 1999 - 2000 to 2003 - 2004. Read the table and the questions.
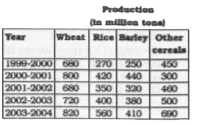
In 2002 - 2003, the percentage increase in the production of barley as compared to the previous was :
View SolutionManufacturing of five types of cars (A, B, C, D and E) in the year 2002 and 2003 Total number of construction in 2002 = 450000 Total number of construction in 2003 = 520000 If the percentage of B type car manufactured in 2003 was the same as it was in 2002, then what would have been the number of such type of car manufactured in 2003?
View Solutionनिम्न सारणी भारत से वर्ष 2000-2001 से 2005-2006 तक मिठाइयों के निर्यात की विवरण दर्शाती है।
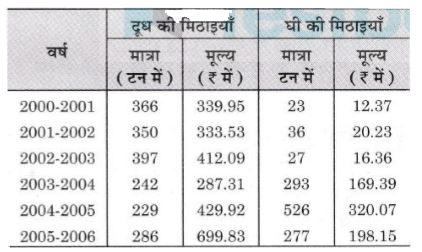
वर्ष 2002-2003 से 2003-2004 तक घी की मिठाइयों के निर्यात में कितने प्रतिशत वृद्धि हुई है?
View SolutionIn which year was there maximum percentage increase in export of pearls to that in the previous year? (a) 2002 (b) 2007 (c) 2005 (d) 2004
View SolutionIn one state the number of bicycles sold in the year 2002-2003 was 7,42,214. In the year 2003-2004, the number of bicycles sold was 8,00,112. In which year were more bicycles sold? And how many more?
View SolutionIn one state the number of bicycles sold in the year 2002-2003 was 7,42,214. In the year 2003-2004, the number of bicycles sold was 8,00,112. In which year were more bicycles sold? And how many more?
View Solutionकिसी राज्य में, वर्ष 2002-2003 में 7,43,000 साइकिलें बेंची गयी! वर्ष 2003-04 में बेंची गयी साइकिलों की संख्या 8,00,100 थी! किस वर्ष में अधिक साइकिलें बेंची गयी और कितनी अधिक बेचीं गयी?
View SolutionIn one state, the number of bicycles sold in the year 2002-2003was 7,43,000. In the year 2003-2004, the number of bicycles sold was 8,00,100. In which year were more bicycles sold? and how many more?
View SolutionManufacturing of five types of cars (A, B, C, D and E) in the year 2002 and 2003 Total number of construction in 2002 = 450000 Total number of construction in 2003 = 520000 If the number of cars of type A in 2003 was the same as it was in 2002, then the total manufacture of car A in 2003 was what percent of the total car manufactured in that year?
View Solution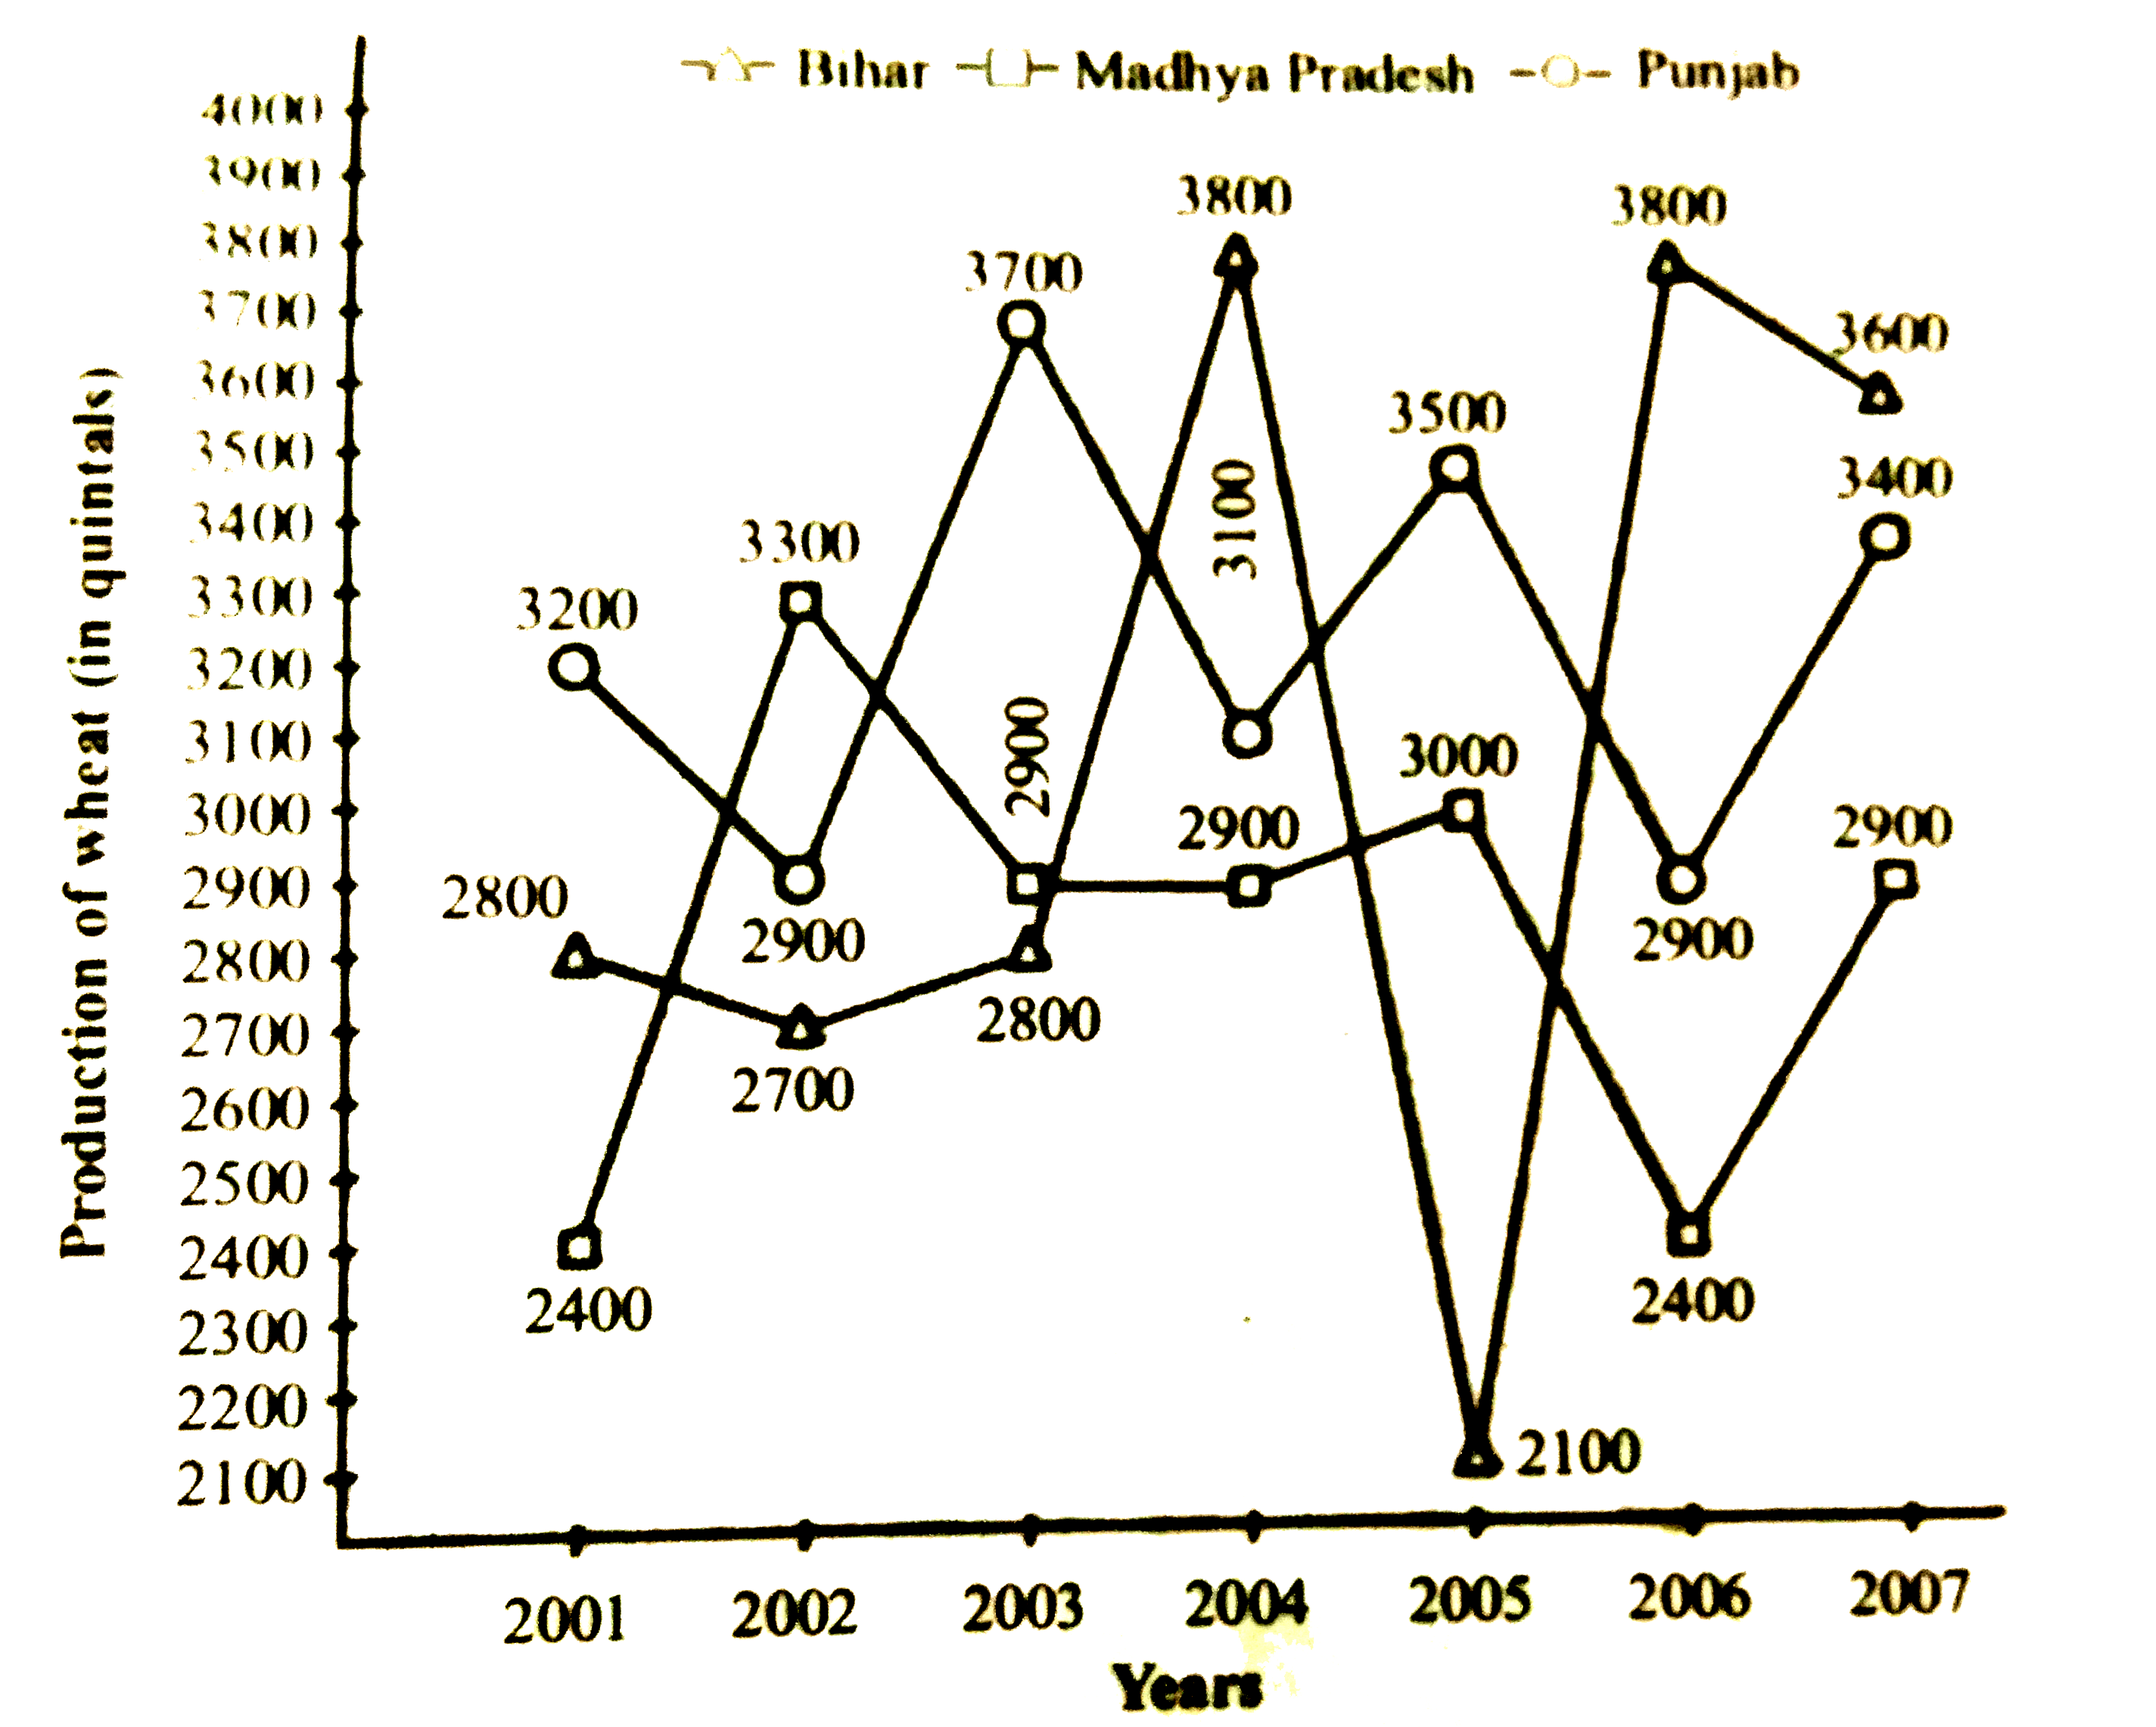
If the productions of wheat in Bihar in the years 2001,2002, 2003 and 2004 increases by 20%,25%,28% and 35% respectively , what will be the percentage increases in the average production of the state for the given years ?
View SolutionManufacturing of five types of cars (A, B, C, D and E) in the year 2002 and 2003 Total number of construction in 2002 = 450000 Total number of construction in 2003 = 520000 What was the difference in the production of type C car between the years 2002 and 2003?
View SolutionManufacturing of five types of cars (A, B, C, D and E) in the year 2002 and 2003 Total number of construction in 2002 = 450000 Total number of construction in 2003 = 520000 If the company is left with 85% of the total manufacturing of E type car in the years 2002 and 2003, then how many cars could not be sold?
View SolutionThe percentage increase in demand of sugar was the lowest as compared to its previous year in
View SolutionIf the population of a town increases by 25% in the first year and increases by 36% in the second year, then what is the average rate (in percentage) of increase in the population?
View SolutionThe pie-chart given here shows the price of gold in the year and year. What is the percentage increase in the price of gold in the year 2013 as compared to the year 2011?
View SolutionThe following bar graph shows the number of students admitted and passed out per year in a college from the year 2000 to the year 2004. study the bar graph What is the percentage increase in the number of students admitted in the year 2003 as compared to the year 2001?
View Solution