What is the ratio of the total students who have attained second division in the year 2000 and appeared in the examination?
1 1:4
2 1:3
3 3:4
4 1:2
Answer : 1. "1:4"
Related Solutions
The ratio of boys and girls who appeared in an examination is 16 : 9 and the ratio of boys and girls who passed is 4 : 3. If 75% of girls passed in the examination, then what is the percentage of total students passed in the examination?
View Solutionएक परीक्षा में 40% छात्र अनुत्तीर्ण हुए। यदि अनुत्तीर्ण छात्रों की संख्या 240 है, तो परीक्षा में भाग लेने वाले छात्रों की कुल संख्या ज्ञात कीजिए।
View SolutionIn an examination 87% students have passed and 2093 students have failed. What is the total number of students appeared in the exam?
View SolutionThe graph shows the result of 10th class students of a school for 4 years. Study the graph and answer the questions :
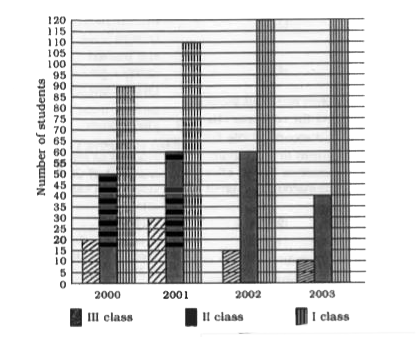
The ratio of students who scored seconds class to the total students appcarcd in the year 2000 is
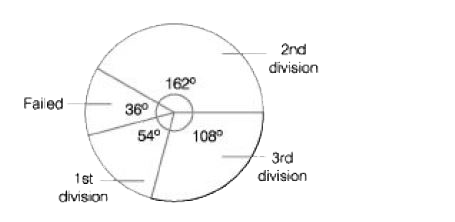
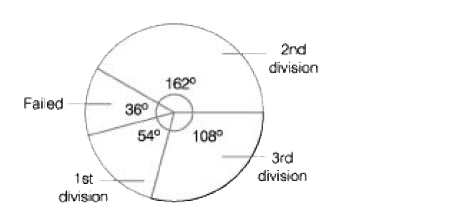
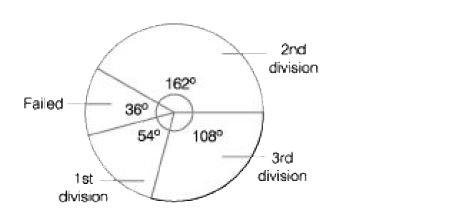
View SolutionThe following pie chart shows the performance in an examination in a particular year for 360 students.The total number of students who have passed in 2nd and 3rd division is
View SolutionThe given Venn diagram shows a total of 50 students who appeared for three different examinations : A, B, and C. All have appeared for at least one examination. How many appeared for examination A and B but not C ?
View SolutionThe average marks obtained by the students in an examination is 60. After removing the calculation errors, the average marks of 100 students becomes 60 to 30 and that of total students becomes 45. What is the total number of students who appeared in the examination?
View SolutionIn a examination , the number of those who passed and the number of those who faild were in the ratio .If five more had appeared and the number of failures were 2 less than earlier , the ratio of students who failed would have been . Find the total number who appeared at the examination .
View Solutionof registered students (1)/(25) did not appear for the examination, those who appeared (11)/(20) Passed. If the number of registered students is 2000, then what is the number of passed students?
View Solution(1)/(25) of the students who registered did not appear for the examination, (11)/(20) of those who appeared passed. If the number of registered students is 2000, the number who passed is
View SolutionThe following pie chart shows the performance in an examination in a particular year for 360 students. The percentage of students who have failed in the examination is
View SolutionIn an examination, the ratio of passes to failures was 4: 1. Had 30 less appeared and 20 less passed, the ratio of passes to failures would have been 5: 1. Find the number of students who appeared for the examination.
View Solutionयदि एक परीक्षा में पास हुए व फ़ैल हुए छात्रों का अनुपात है। यदि 5 छात्र और आ जाए व फ़ैल हुए छात्र 2 कम हो जाये तो पास हुए छात्र व फ़ैल हुए छात्रों का अनुपात यदि एक परीक्षा में पास हुए व फ़ैल हुए छात्रों का अनुपात हो जाता है। तो परीक्षा में आए छात्र ज्ञात करे।
View SolutionThe following pie chart shows the performance in an examination in a particular year for 360 students. The number of students who passed in 1st division is
View SolutionThe average score of boys who passed a school examination is 71, while the girls have an average score of 73, the average score of total students in the school is 71. Is 8. Find the ratio of the number of boys and girls appearing in the examination.
View SolutionThe given bar graph represents the number of students who appeared in the board examination in session 2017-18 and 2018-19. Study the graph and answer the question that follows. What percentage is the total number of students who appeared in 2017-18 is less than the total number of students who appeared in 2018-19?
View SolutionNo. of students and % of students passed out of those who appeared are given for two subjects from year 2011 to 2015 in a college XYZ.
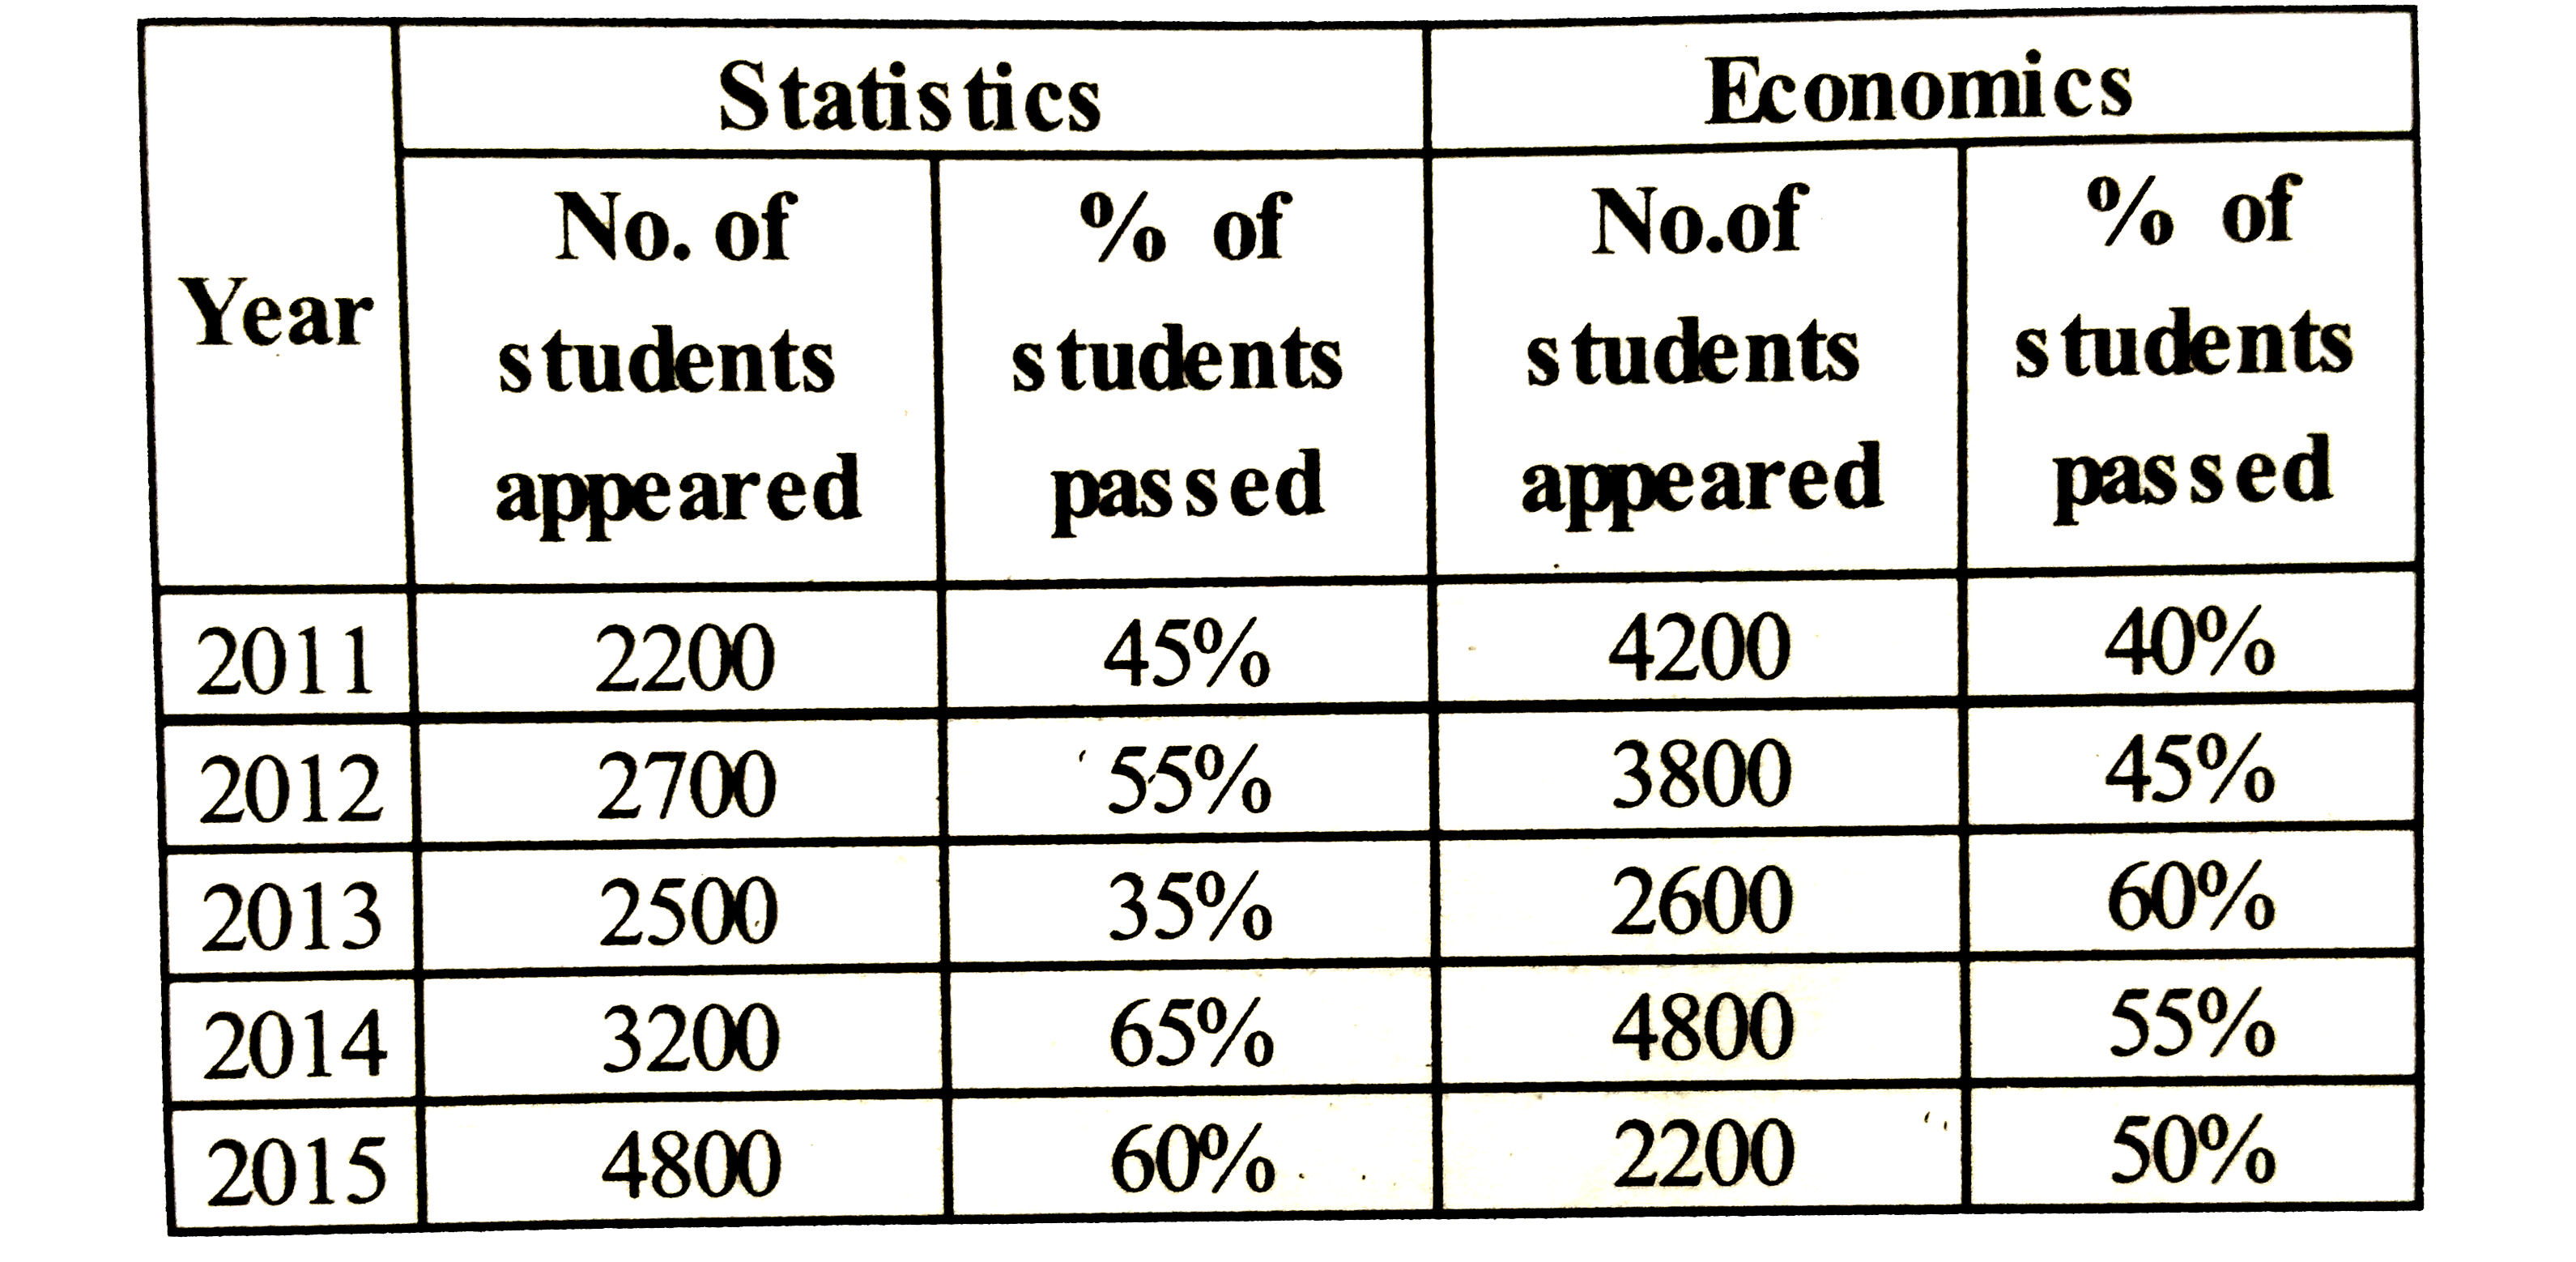
Find the ratio between the total number of students appeared in Economics from 2012 to 2014 togeter and the total number of students appeared in Satistics from year 2013 to 2015 together ?
View SolutionStudy the following table and answer question.
Number of students appeared in an examination from five citie s:
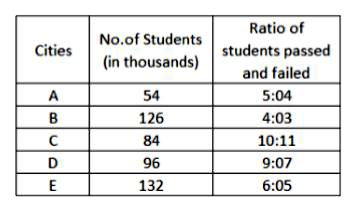
The total number of students who appeared in the examination from cities C and D is what percent more than the total number of students who failed in cities A, B and E ? (nearest to an integer)
View Solutionएक विद्यालय में एक वर्ष 10% छात्र बढ़ जाते है दूसरे वर्ष 10% छात्र घट जाते है और यह क्रम चलता रहता है, यदि वर्ष 2000 में छात्रों की संख्या में वृद्धि हुई हो तो, 2003 में छात्रों के संख्या 2000 की तुलना में वृद्धि या कमी का प्रतिशत क्या रहा ?
View Solution