The following bar graph indicates the production of sugar in lakh tonnes by three different sugar companies P Q and R over years 2009 to 2013. Production of Su
null
null
null
null
Answer : Explanation :1. Answer : 4 Explanation : Required Percentage =100-5050×100= 100% 2.
Related Solutions
The bar graph given below shows the data of the production of paper (in lakh tonnes) by three different companies P, Q and R over the years. What is the percentage increase in the productionby company Q from 2010 to 2013?
View SolutionThe bar graph given below shows the data of the production of paper (in lakh tonnes) by three different companies P, Q and R over the years. What is the ratio of the average production by company P during the period 2010 to 2013 to the average production by company R during the same period?
View SolutionThe following column graph shows the fertilizer production (in lakh tonnes) of a company for six consecutive years. What was the difference (in lakh tonnes) between the average production of fertilizers for the first three years and the average production of the last three years?
View SolutionThe following column graph shows the fertilizer production (in lakh tonnes) of a company for six consecutive years. What was the difference (in lakh tonnes) between the average production of fertilizers for the first three years and the average production of the last three years?
View Solutionनिम्नलिखित बार ग्राफ में तीन भिन्न-भिन्न कंपनियों X, Y एवं Z द्वारा कुछ वर्षो में किए गए कागज के उत्पादन (लाख टन में) आकड़ों को दर्शया गया है। बार ग्राफ का अध्ययन कीजिए
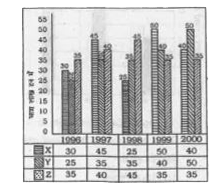
पांच वर्षों का औसत उत्पादन किस कंपनी का अधिकतम है ?
View SolutionThe following bar graph shows the production (in lakh tonnes) of paper made by three different companies X, Y and Z in certain years. study bar graphs Which company has the highest average production for five years?
View SolutionRead the following graph carefully and answer the questions given below.
Production of sugar in three different factories over years (in thousand tonnes)
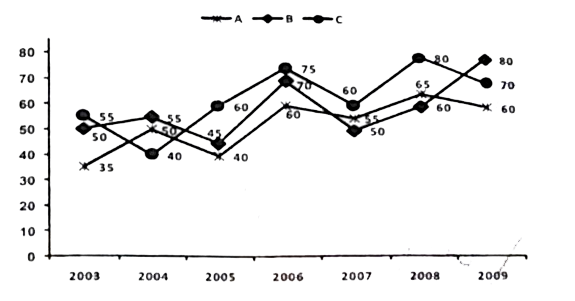
The average production of company A is approximately what percent of average production of company C ?
View SolutionRead the following graph carefully and answer the questions given below.
Production of sugar in three different factories over years (in thousand tonnes)
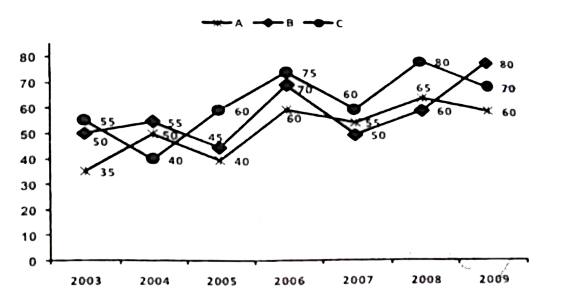
What was the percentage decrease in production of company C in 2007 from previous year ?
View SolutionRead the following graph carefully and answer the questions given below.
Production of sugar in three different factories over years (in thousand tonnes)
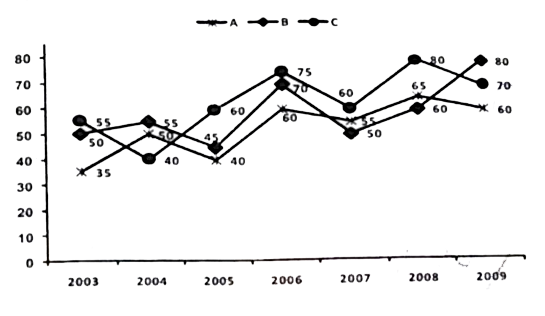
In which year was the percentage increase/decrease in production of company B maximum ?
View SolutionRead the following graph carefully and answer the questions given below.
Production of sugar in three different factories over years (in thousand tonnes)
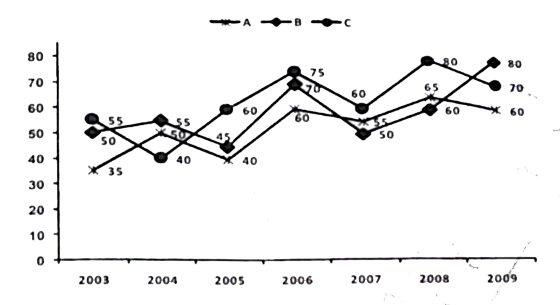
What is the average production of company C in all the years ?
View SolutionProduction of steel in different companies in three consecutive years (in lakh tonnes)
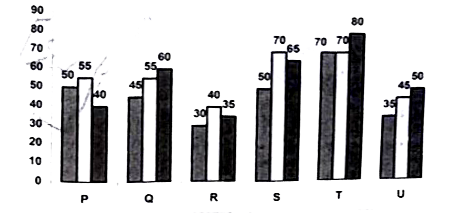
In which of the following pairs of companies the difference between average production for the three years is maximum?
View SolutionProduction of steel in different companies in three consecutive years (in lakh tonnes)
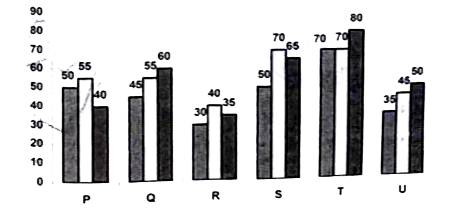
Production of company R in 2005 and production of company U in 2004 together is what percent of production of Q in 2006?
View SolutionThe bar graph provided below gives the data of the production of paper (in lakh tonnes) by three different companies X, Y and Z over the years. Study the bar chart and answer the following questions.
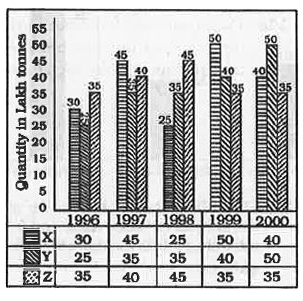
The percentage of production of company Z to the production of company Y is maximum in :
View SolutionProduction of steel in different companies in three consecutive years (in lakh tonnes)
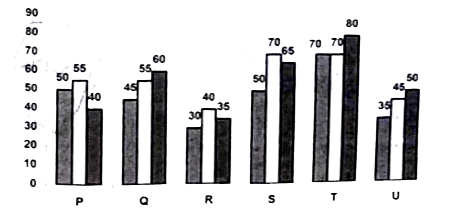
What is the percentage decline in production by company R from 2005 to 2006?
View SolutionStudy the following graph carefully to answer the questions that follows
Production of Alluminium by different companies in three consecutive years (in lakh tonne)
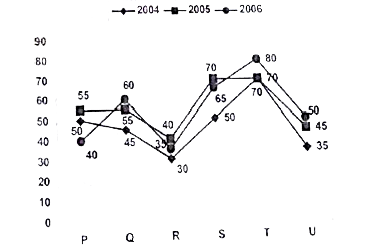
What is the percentage decline in production of company R from 2005 to 2006?
View SolutionThe bar graph provided below gives the data of the production of paper (in lakh tonnes) by three different companies X, Y and Z over the years. Study the bar chart and answer the following questions.
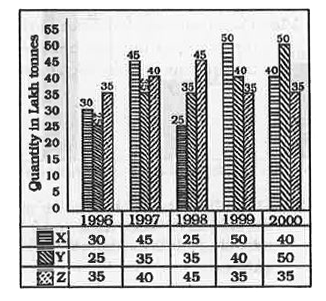
The difference between the production of company Z in 1998 and company Y in 1996 is :
View SolutionA health drink company prepares the drinks of three different flavours P, Q, R. The production of three flavours over a period of six years has been expressed on bar graph provided below. Study the graph and answer the questions.
(Production of 3 different flavours of health drinks of a company in 6 years in Lakh bottles)
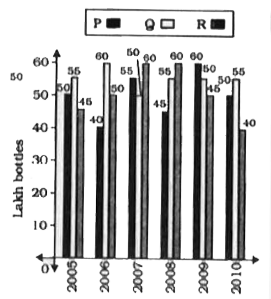
What is the difference between the average production of flavour Q in 2008, 2009 and 2010 from that of flavour Pin 2005, 2006 and 2007 in lakh bottles is :
View SolutionStudy the following graph carefully to answer the questions that follows
Production of Alluminium by different companies in three consecutive years (in lakh tonne)
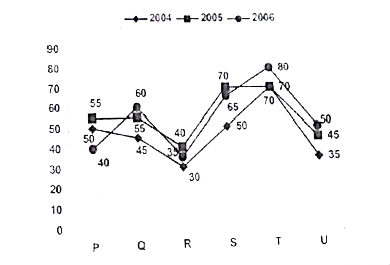
Production of company R in 2005 and production of company U in 2004 together is what percent of production of company Q in 2006 ?
View SolutionThe bar graph provided below gives the data of the production of paper (in lakh tonnes) by three different companies X, Y and Z over the years. Study the bar chart and answer the following questions.
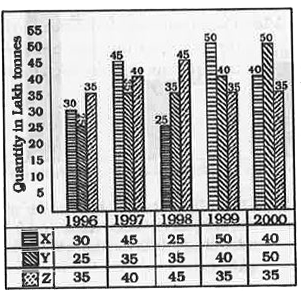
The average production for five years is maximum for which company?
View Solutionनिम्नलिखित बार ग्राफ में तीन भिन्न-भिन्न कंपनियों X, Y एवं Z द्वारा कुछ वर्षो में किए गए कागज के उत्पादन (लाख टन में) आकड़ों को दर्शया गया है। बार ग्राफ का अध्ययन कीजिए
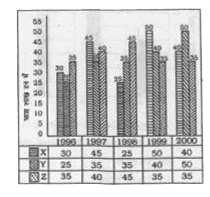
कंपनी z के उत्पादन और कंपनी Y के उत्पादन का प्रतिशत किस वर्ष अधिकतम रहा ?
View Solution