The following bar graph shows the percentage of chairs produced by two companies Neel Kamal and Raj Kamal during five different years. Bar graph also shows the total no. of chairs produced in differen
null
null
null
null
Answer : Explanation :Answer 1) 1/3 x (54 x 150 + 60 x 300 + 36 x 450) = 1/3 x 42300 = 14100.
Related Solutions
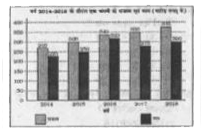
Given bar graph (bar graph) for five years, 2014 From 2018 Shows the income and expenditure (in crores of rupees) of a company during the period. 2014, 2016 And 2017 What is the ratio of total expenditure to total income of the company?
View SolutionThe given bar graph (bar graph) shows the revenue and expenditure (in crores of rupees) of a company during the five year period, 2014-2018. What is the ratio of the total revenue of the company in 2015 and 2018 to that of its expenditure in 2014 and 2018?
View SolutionThe given bar graph (bar graph) shows the import and export (in tonnes) of an article manufactured by a company during the five financial years, 2013-2014 to 2017-2018. What is the average (in tonnes) of the rectangle during the five financial years?
View Solutionनिम्नलिखित बार ग्राफ में तीन भिन्न-भिन्न कंपनियों X, Y एवं Z द्वारा कुछ वर्षो में किए गए कागज के उत्पादन (लाख टन में) आकड़ों को दर्शया गया है। बार ग्राफ का अध्ययन कीजिए
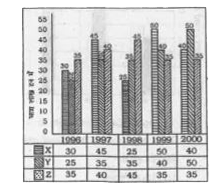
पांच वर्षों का औसत उत्पादन किस कंपनी का अधिकतम है ?
View SolutionThe following bar graph shows the production (in lakh tonnes) of paper made by three different companies X, Y and Z in certain years. study bar graphs Which company has the highest average production for five years?
View SolutionIn the given bar graph , the white bar shows the income and the black bar shows the expenditure of company (in Rs. Lakhs) . Study the graph and answer the question that follows . The percentage decrease in the income of the company in 2002 as compared to that in 2001 is :
View SolutionThe given bar graph shows the sales (in thousands) of books in four metropolitan branches of a company for the years 2014 and 2015. In the given bar graph, calculate the percentage increase in sales (rounded off to a decimal) during the years 2014 and 2015.
View Solutionदिया गया दंड आरेख (बार ग्राफ) पाँच वर्ष की अवधि, के दौरान किसी कंपनी के राजस्व और व्यय (करोड़ रुपए में ) को दर्शाता है।

वर्ष से तक कंपनी का कुल व्यय, पाँच वर्ष की अवधि के कुल राजस्व का कितना प्रतिशत (निकटतम पूर्णांक में ) है ?
View SolutionStudy the following graph carefully to answer the questions that follows
The % of five different types of cars produced by a company during two years is given below:
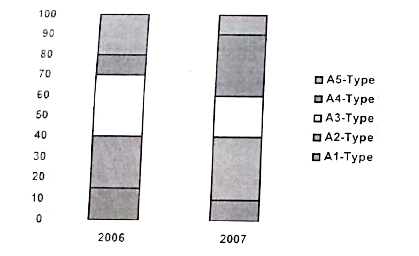
what is the approximate % share of A1 type in the total production of 2007?
View SolutionThe given bar graph (bar graph) shows the import and export of an article (in tonnes) manufactured by a company during the five financial years 2013-2014 to 2017-2018. In which financial year has there been maximum percentage increase in the total sum of imports and exports as compared to the previous financial year?
View Solutionदिया गया दंड आरेख (बार ग्राफ ) पाँच वर्षों, से के दौरान किसी कंपनी की आय और व्यय (करोड़ रूपये में ) को दर्शाता है।
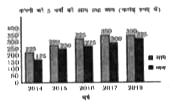
और में कंपनी की कुल आय, पाँच वर्षों में कुल व्यय से लगभग कितने प्रतिशत कम है ?
View SolutionGiven bar graph (bar graph) for five years, 2014 From 2018 Shows the income and expenditure (in crores of rupees) of a company during the period. 2015, 2017 And 2018 The total income of the company is approximately what percent less than the total expenditure in five years?
View Solutionदिया गया दंड आरेख (बार ग्राफ) पाँच कंपनियों द्वारा मोटरसाइकिलो की मांग और उत्पादन (लाखो में) को दर्शाता है।
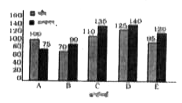
B और D कंपनियों की मोटरसाइकिलो के उत्पादन का कुल योग,सभी कंपनियों की मोटरसाइकिलो की कुल मांग का कितने प्रतिशत है ?
View Solutionदिया गया दंड आरेख (बार ग्राफ) पाँच वर्ष की अवधि, के दौरान किसी कंपनी के राजस्व और व्यय (करोड़ रुपए में ) को दर्शाता है।
वर्ष में कंपनी का व्यय, वर्ष और में औसत राजस्व (प्रति वर्ष ) से कितने प्रतिशत कम है ?
View SolutionThe given bar graph (bar graph) shows the import and export of an article (in tonnes) manufactured by a company during the five financial years 2013-2014 to 2017-2018. What is the ratio of total imports and total exports during the five financial years?
View SolutionThe bar graph shows the number of toys produced by a factory during a certain week.
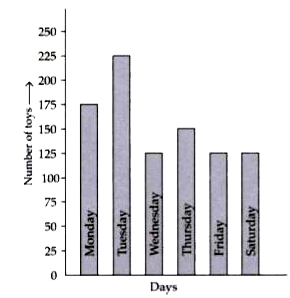
What is the total number of toys produced during the week ?
View SolutionThe given bar graph (bar graph) shows the number of students in two schools during six years. In which year, the sum of the students in both the schools is the highest?
View Solutionदिया गया दंड आरेख (बार ग्राफ) पाँच कंपनियों द्वारा मोटरसाइकिलो की मांग और उत्पादन (लाखो में) को दर्शाता है।
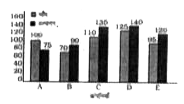
A और D कंपनियों की मोटरसाइकिलो की कुल मांग का कंपनी C की मोटरसाइकिलो के उत्पादन से क्या अनुपात है ?
View SolutionStudy the following graph carefully and answer the given questions :-
The following graph shows the % profit of two companies over the years :-
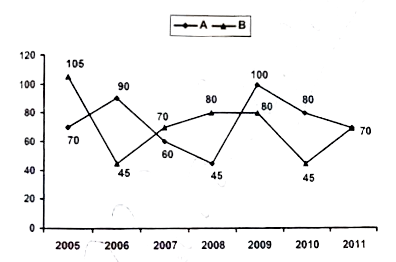
In which of the following years was the total income more than double the total expenditure in that year for company A ?
View SolutionGiven here is a bar graph showing the number of cycles produced in a factory during five consecutive weeks. Observe the graph and answer the questions based on this graph. The number of cycles produced in the 5th week is
View Solution