The bar-chart is showing the number of Accidents in a city during the first six month of a year. Examine the bar chart and answer the following questions. What is the percentage of accidents in the m
1 15%
2 20%
3 22%
4 24%
Answer : 4. "24%"
Related Solutions
The bar-chart is showing the number of accidents in a city during the first six month of a year. Examine the bar chart and answer the following questions. What is the percentage of accidents in the month of April to the total accidents in the city ?
View SolutionThe bar-chart is showing the number of accidents in a city during the first six month of a year. Examine the bar chart and answer the following questions. Compared to the month of January, what is the percentage of decrease in accidents in the month of February?
View SolutionThe bar-chart is showing the number of accidents in a city during the first six month of a year. Examine the bar chart and answer the following questions. Percentage of decrease in t he number of accidents from May to June is :
View SolutionThe bar-chart is showing the number of accidents in a city during the first six month of a year. Examine the bar chart and answer the following questions. By what number, is the number of accidents that occurred in April is greater than the average number of accidents that occured during the 6 months period ?
View SolutionThe first of the year in the bar chart given here 6 The number of accidents that occurred in the month is shown. Accidents in the month of April are what percent of total accidents in the city?
View SolutionThe first of the year in the bar chart given here 6 The number of accidents that occurred in the month is shown. Accidents in the month of April are what percent of total accidents in the city?
View SolutionThe first of the year in the bar chart given here 6 The number of accidents that occurred in the month is shown. Accidents in February are what percent less than the accidents in January?
View SolutionThe first of the year in the bar chart given here 6 The number of accidents that occurred in the month is shown. Accidents in February are what percent less than the accidents in January?
View SolutionThe first of the year in the bar chart given here 6 The number of accidents that occurred in the month is shown. Number of accidents in April, 6 What is more than the average number of accidents in the month?
View SolutionThe first of the year in the bar chart given here 6 The number of accidents that occurred in the month is shown. Number of accidents in April, 6 What is more than the average number of accidents in the month?
View SolutionThe first of the year in the bar chart given here 6 The number of accidents that occurred in the month is shown. What is the percentage reduction in the number of accidents that took place between May and June?
View SolutionThe first of the year in the bar chart given here 6 The number of accidents that occurred in the month is shown. What is the percentage reduction in the number of accidents that took place between May and June?
View SolutionThe given linear graph shows the accidents of a city in the first six months of the year 1999. Accordingly, what is the percentage reduction in accidents from May to June?
View SolutionGiven is a line graph showing the number of accidents in a city during the first 6 months of 1999.
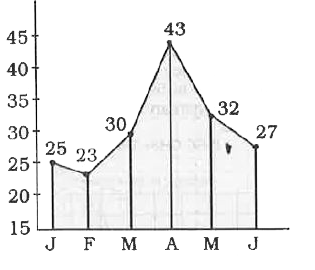
The decrease % of accidents from May to June is
View SolutionThe following bar chart represents the number of first year B. Com. Students of St Xavier's College using different companies smart phones. Study bar chart and answer the questions.
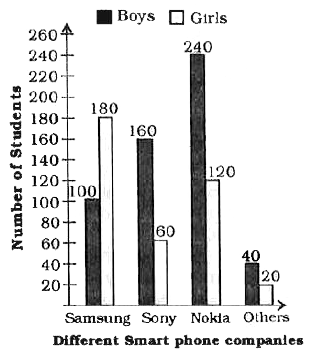
The bar chart representing the number of students using different smart phones.
What percentage of boys are using the smart phones of Samsung ?
View SolutionThe following bar chart represents the number of first year B. Com. Students of St Xavier's College using different companies smart phones. Study bar chart and answer the questions.
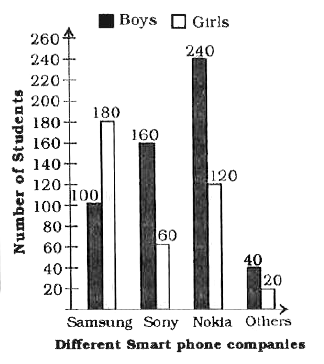
The bar chart representing the number of students using different smart phones.
What percentage of girls are using the smart phones of Nokia ?
View SolutionThe following is a horizontal bar diagram showing the accidents in which two - wheelers are involved with other objects. Study the diagram and answer the question.
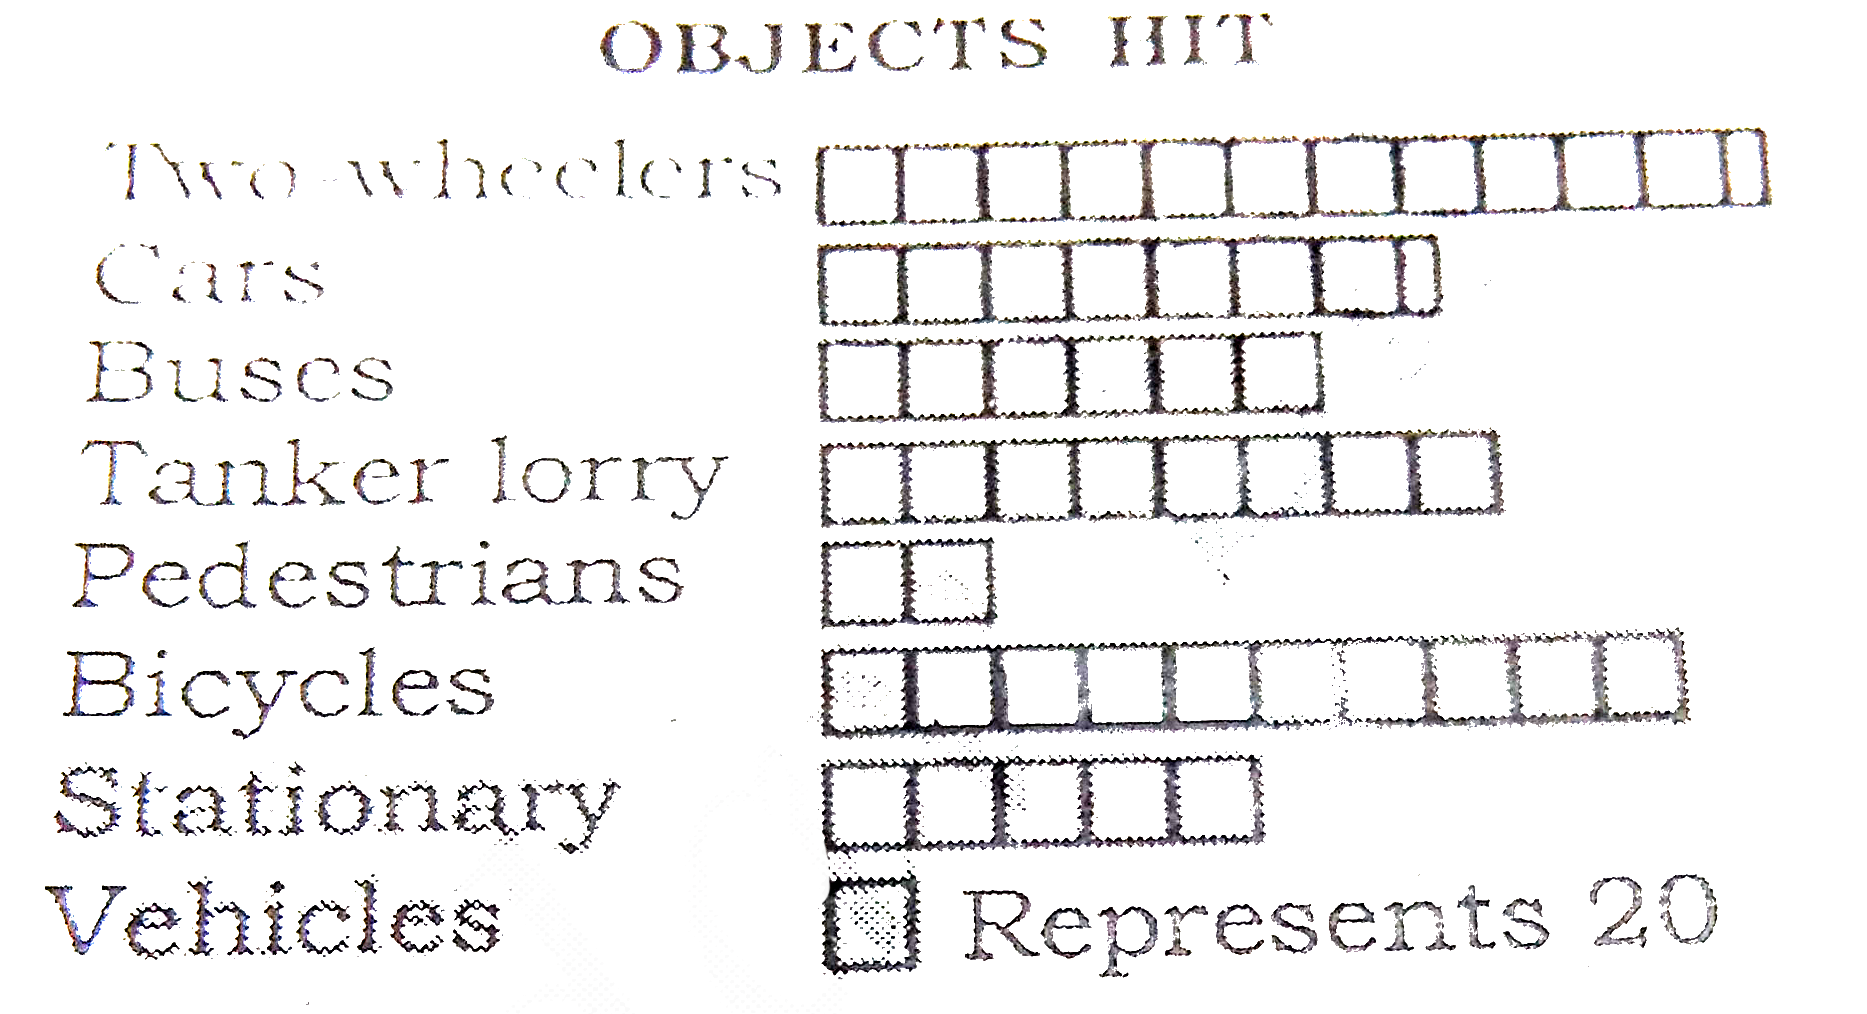
कुल दुर्घटनाओं का निम्न वाहनों से होता है ।
View SolutionDirections (Q. Nos. 16-20) The fallowing is a horizontal bar diagram showing the accidents in which two wheelers are involved with other objects. Study the diagram and answer the questions.
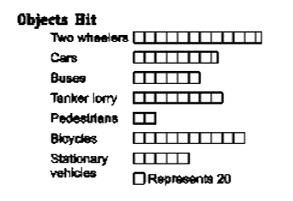
If the data of the bar diagram is represented by a pie chart and the angle of a sector of the pie chart is , then this sector represents the accidents involving
View SolutionStudy the bar chart given below and answer the following questions :
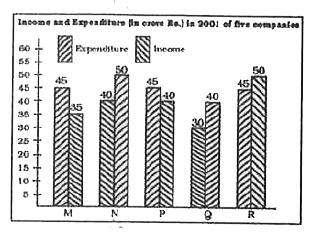
The company earning the maximum percentage of profit in the year 2001 is :
View SolutionThe following is a horizontal bar diagram showing the accidents in which two-wheelers are involved with other objects. Study the diagram and answer the questions.
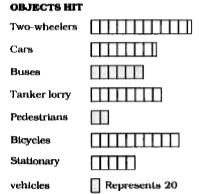
The percentage by which the accidents involving buses is less than the accidents involving tanker lorry is
View Solution