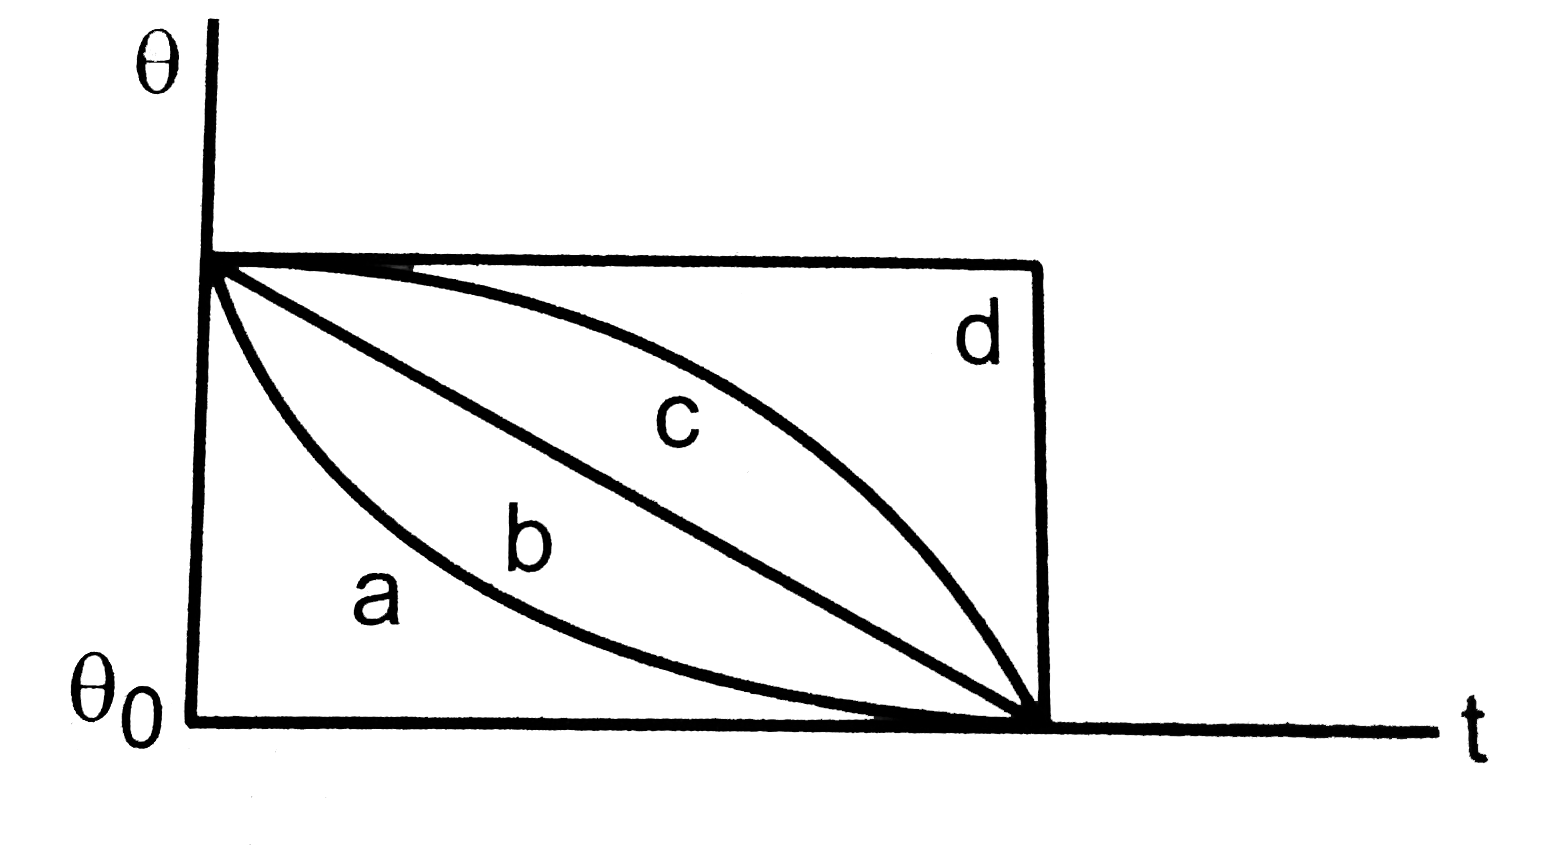
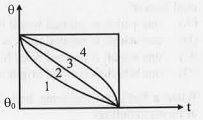
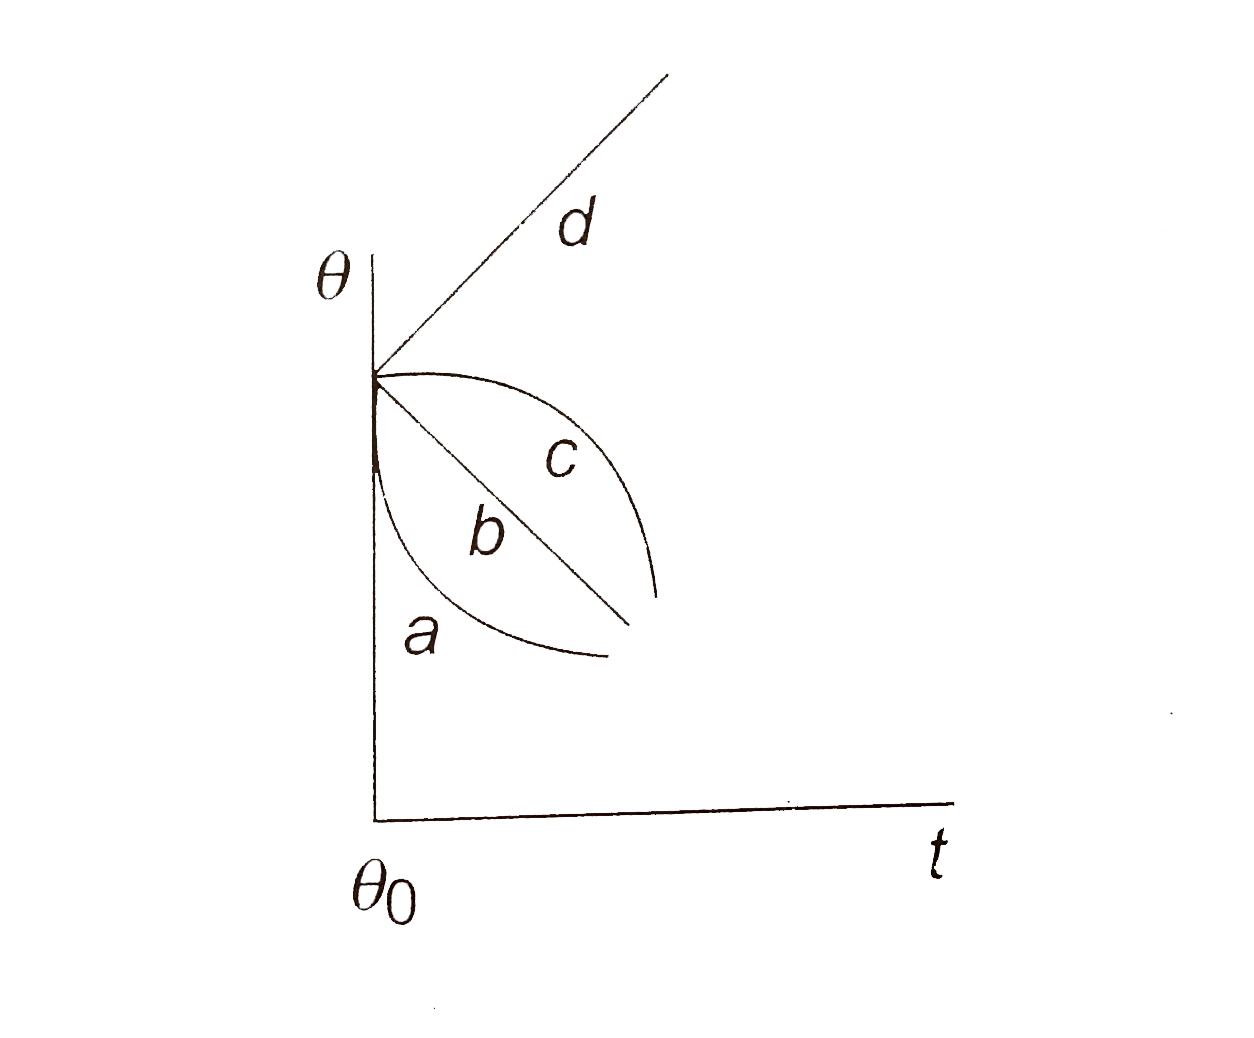
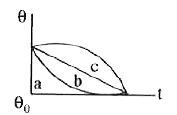
A hot liquid is kept in a big room. Its temperature is plotted as a function of time. Which of the following curves may represent the plot ?
The correct answer is curve a may represent the plot
Related Solutions
A hot liquid is kept in a big room. Its temperature is plotted as a function of time. Which of the following curves may represent the plot?
 View Solution
A hot liquid is kept in a big room. Its temperature is plotted as a function of time. Which of the following curves may represent the plot?
 View Solution
A hot liquid is kept in a big room. Its temperature is plotted as a function of time Which of the following curves may represent the plot?
 View Solution
A hot liquid is kept in a big room. Its temperature is plotted as a function of time. Which of the following curves may represent the plot?
 View Solution
A hot liquid is kept in a big room. Its temperature is plotted as a function of time. Which of the following curves may present the plot ?
 View Solution
A hot liquid is kept in a big room. lts temper- ature is plotted as a function of time. Which of the following curves may represent the plot
 View Solution
A hot liquid is kept in a big room. According to Newton's law of cooling rate of cooling liquid (represented as y) is plotted against its temperature T . Which of the following curves may represent the plot?
View SolutionA hot liquid is kept in a bog room. Accoding to Newton's law of cooling rate of cooling liquid (represented as y) is plotted against its temperature T . Which of the following curves may represent the plot?
View SolutionA hot liquid is kept in a bog room. Accoding to Newton's law of cooling rate of cooling liquid (represented as y) is plotted against its temperature T . Which of the following curves may represent the plot?
View SolutionA hot liquid is kept in a big room. The logarithm of the numerical value of the temperature difference between the liquid and the room is plotted against time. the plot will be very nearly
View SolutionA hot liquid is kept in a big room. The logarithm of the numerical value of the temperature difference between the liquid and the room is plotted against time. The plot will be very nearly
View SolutionA hot liquid is kept in a big room. The logarithm of the numerical value of the temperature difference between the liquid and the room is plotted against time. The plot will be very nearly
View SolutionA hot liquid is kept in a big room. The logarithm of the numerical value of the temperature difference between the liquid and the room is plotted against time. the plot will be very nearly
View SolutionA hot liquid is kept in a big room. The logarithm of the numerical value of the temperature difference between the liquid and the room is plotted against time.The plot will be very nearly
View SolutionA hot liquid is kept in a big room. The logarithm of the numerical value of the temperature difference between the liquied and the room is plot will be very nearly
View SolutionA cooling curve is plotted between the temperature of a hot body and time. Which of the following is not true for the cooling curve?
View SolutionA cooling curve is plotted between the temperature of a hot body and time. Which of the following is not true for the cooling curve?
View SolutionWhich of the following plots may represent the thermal energy produced in a resistor for a given current as a function of time?
View SolutionWhich of the following plots represents schematically the dependence of the time period of a pendulum if measured and plotted as a function of its oscillations? (Note : amplitude need not be small)
View SolutionWhich of the following represents a plot of compressibility factor (Z) versus P at room temperature for helium?
View Solution
