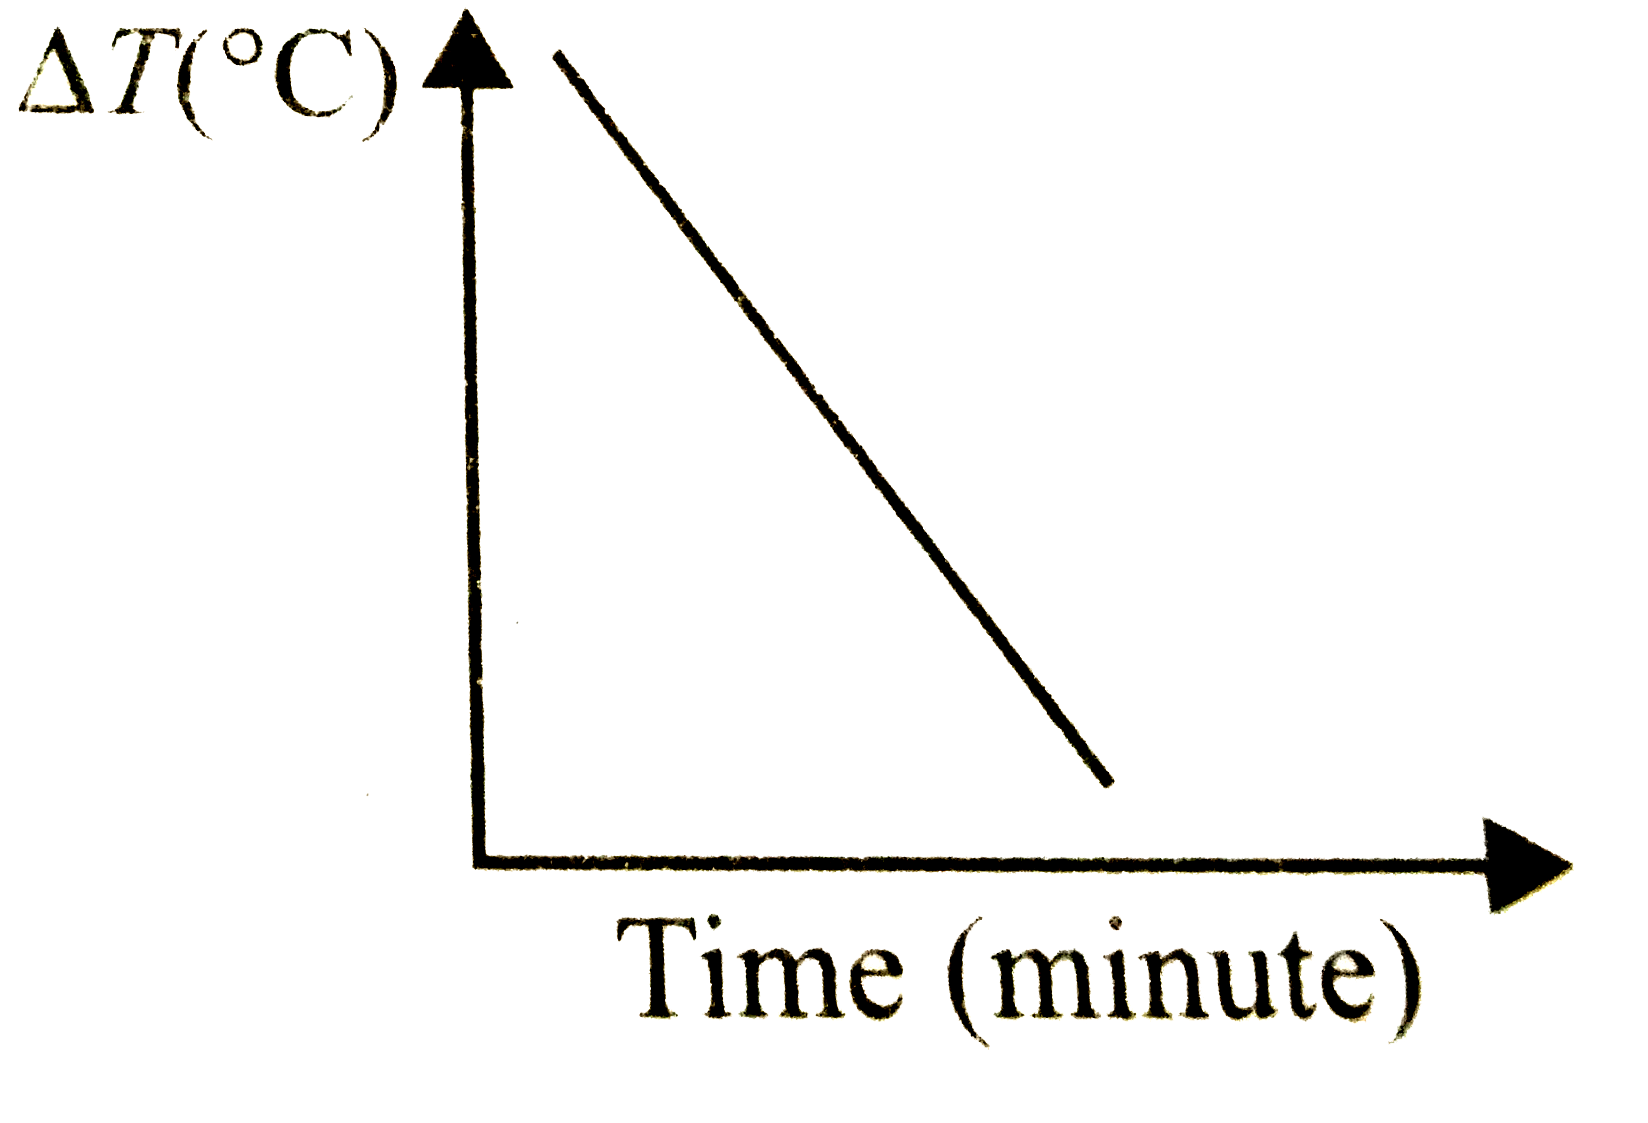
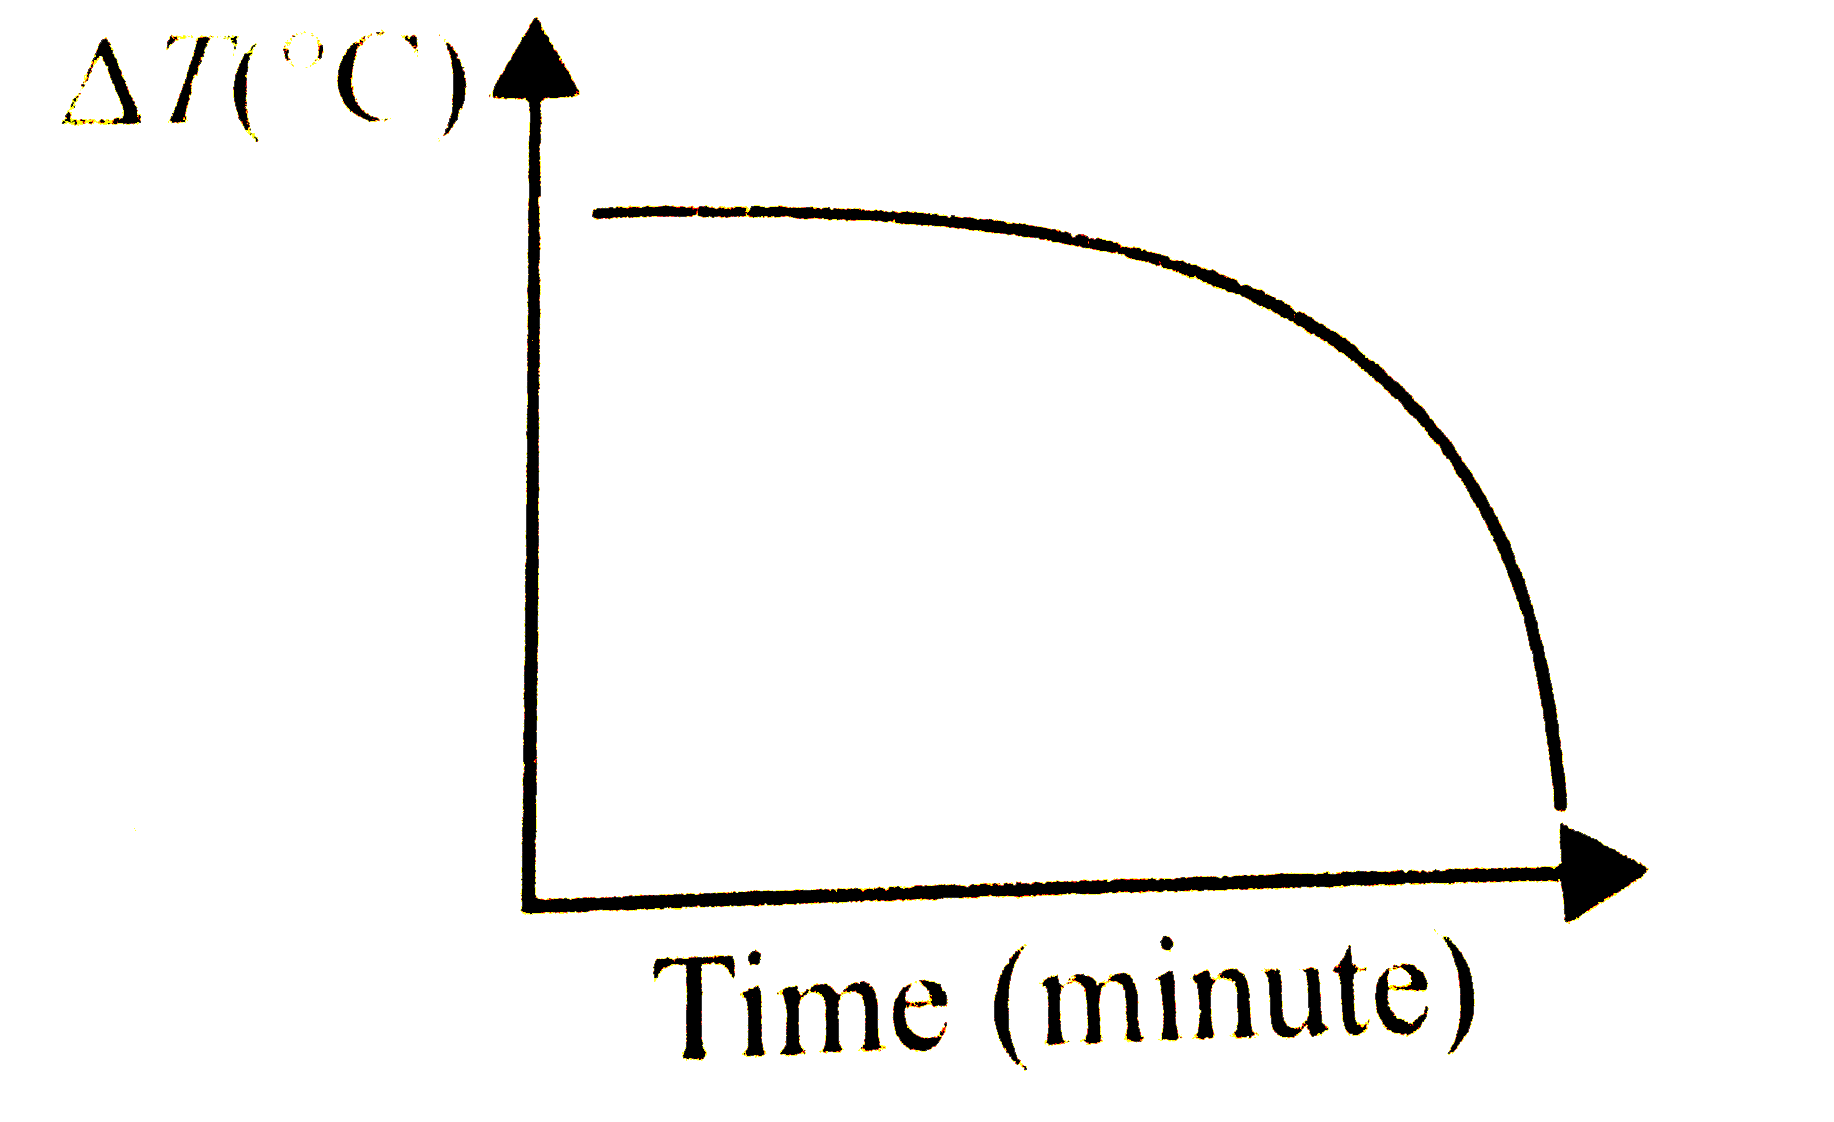
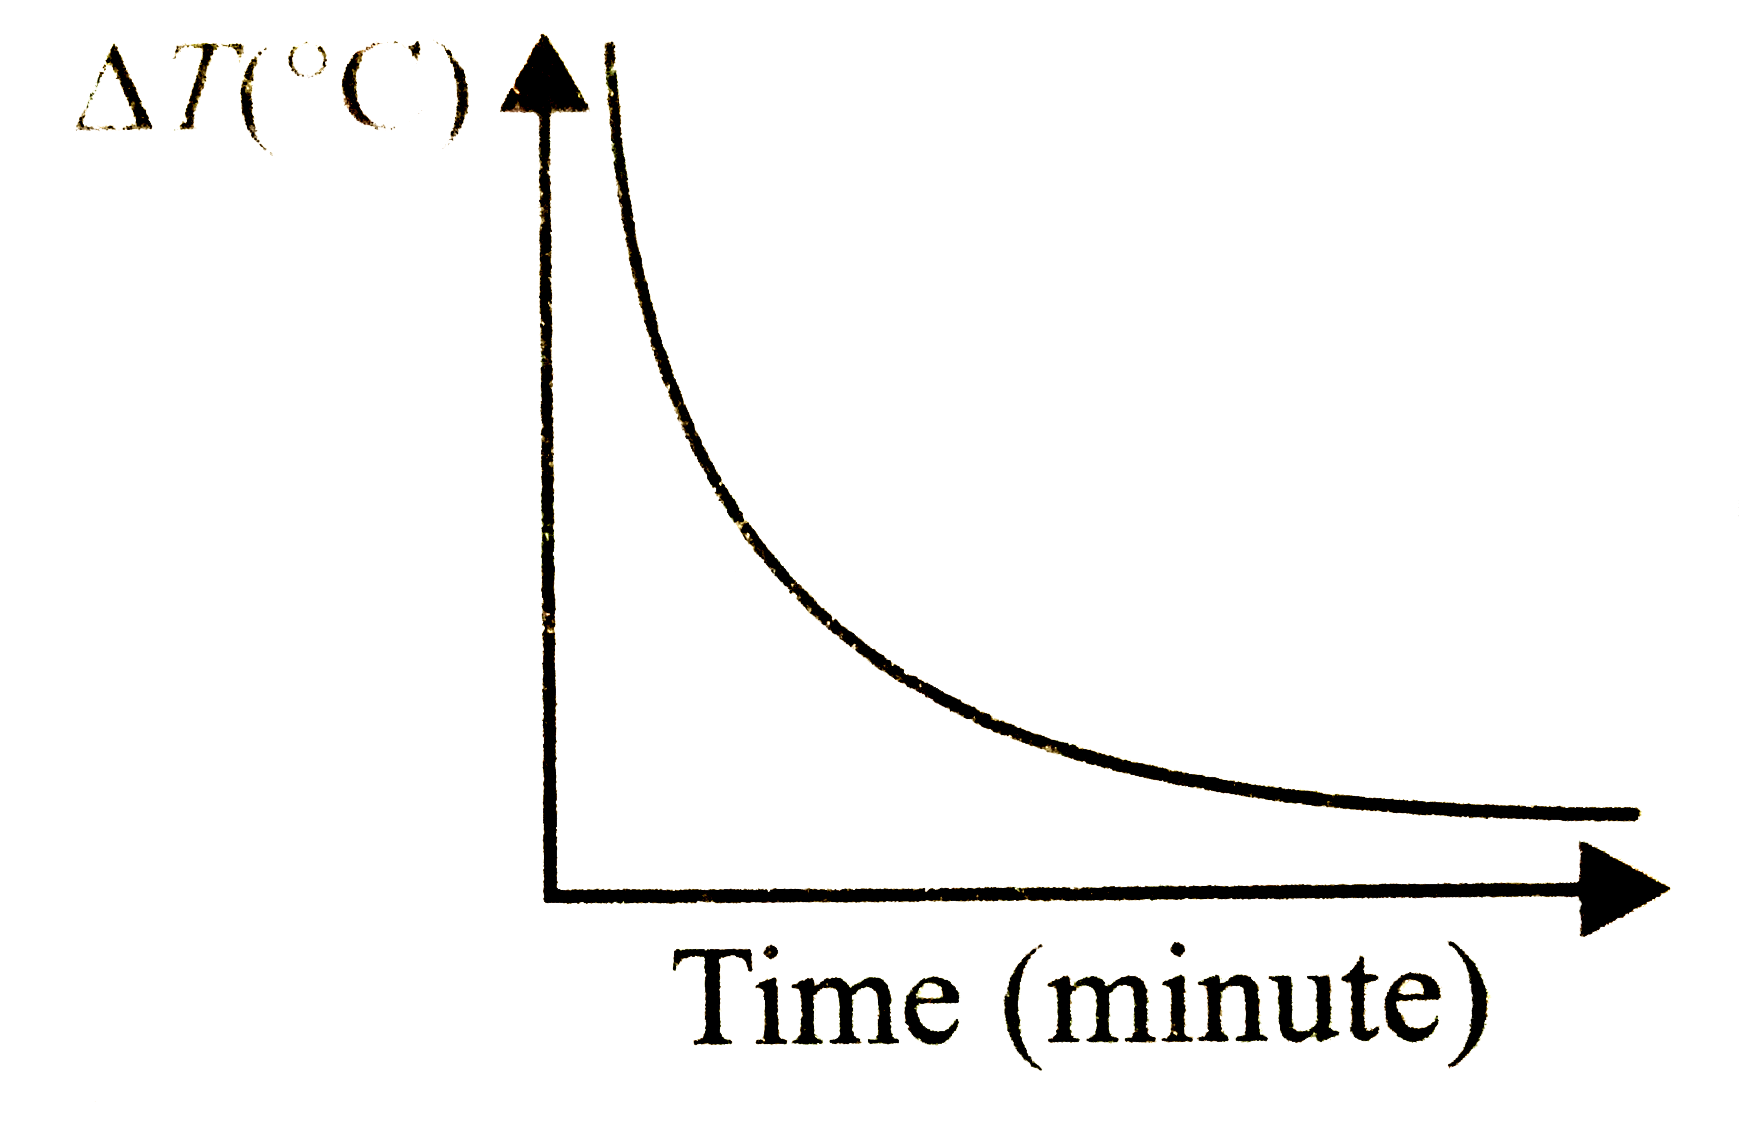
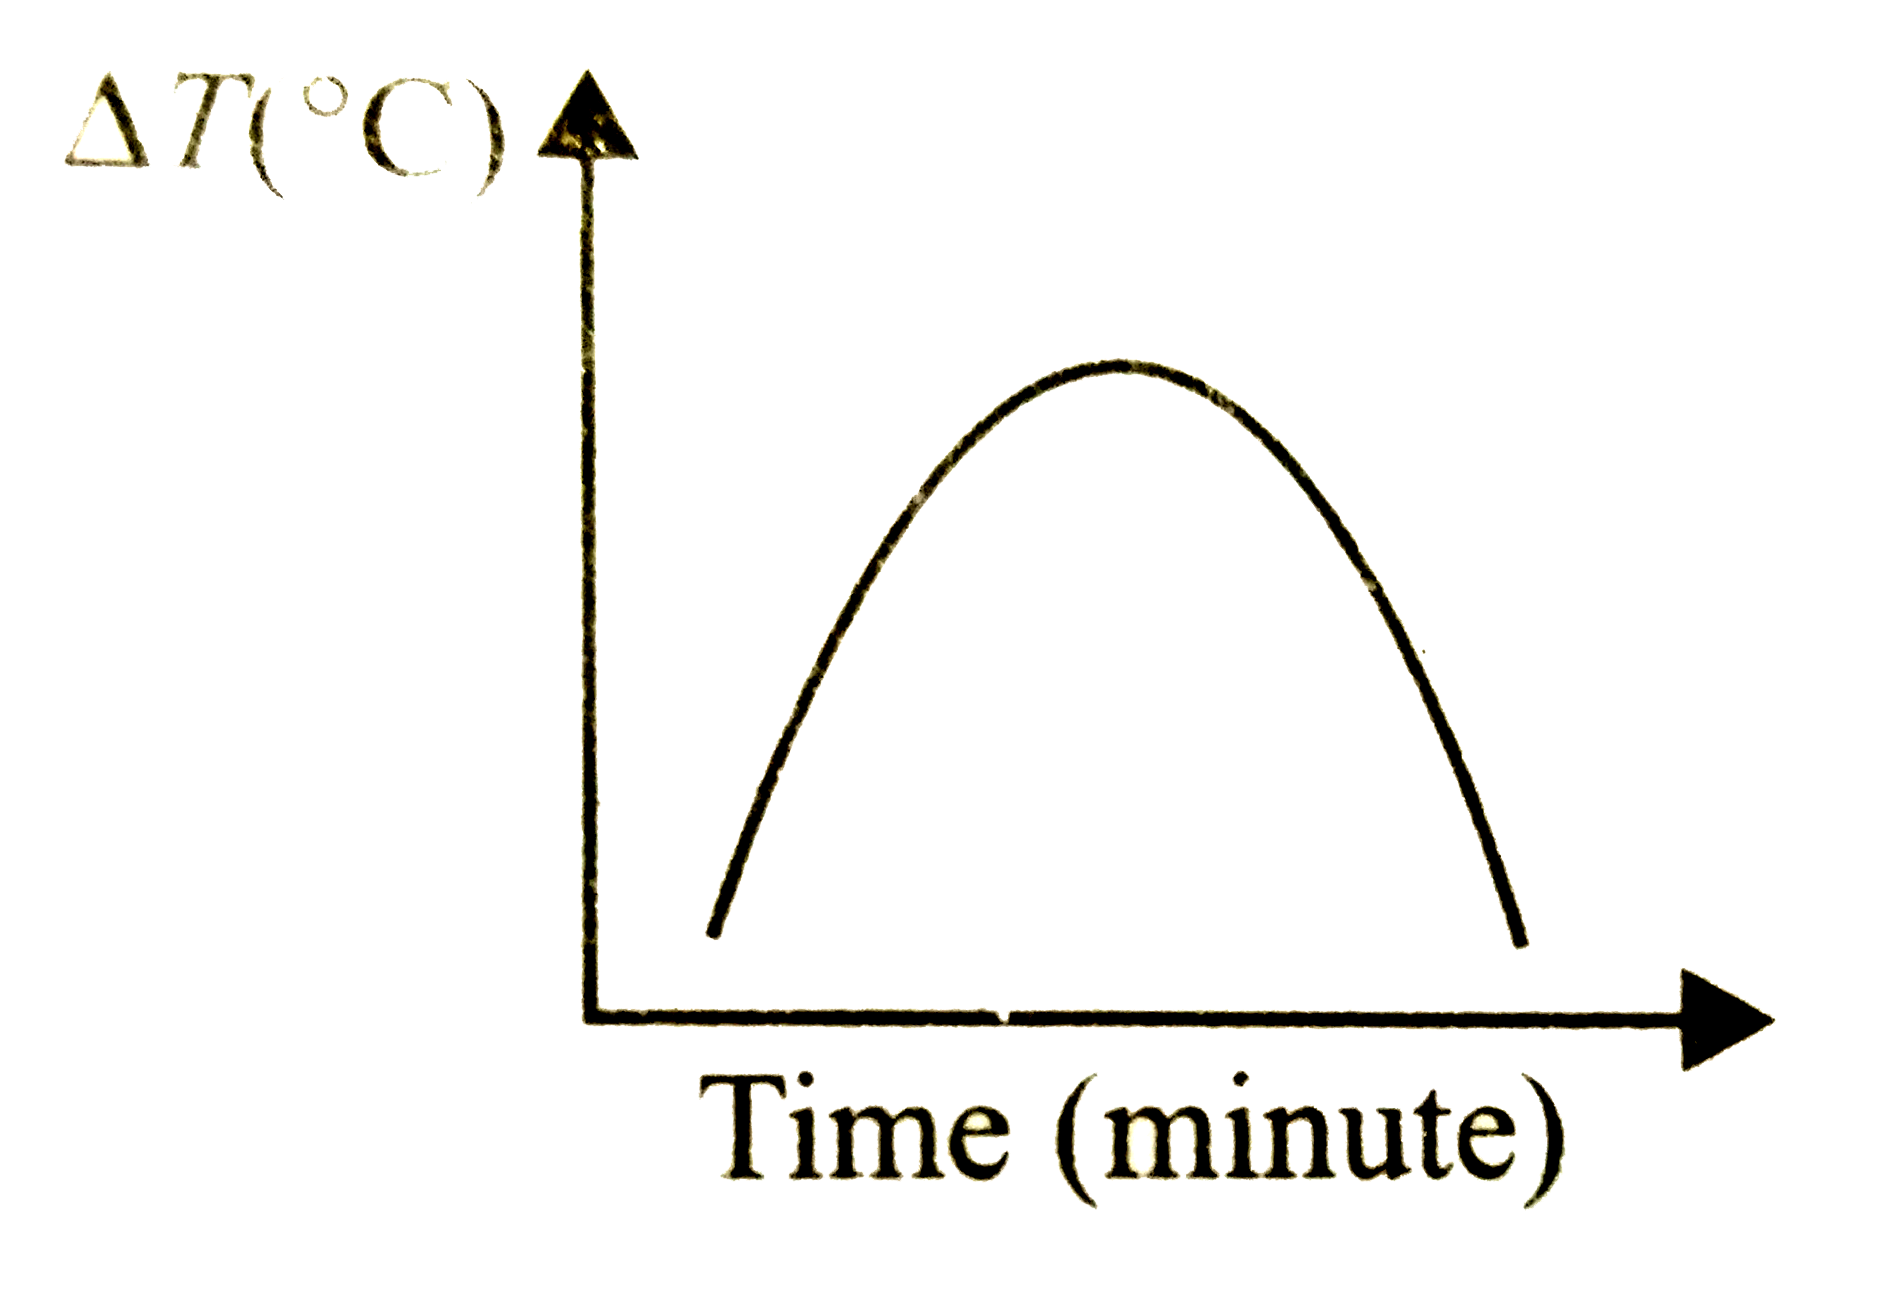
A hot liquid is kept in a bog room. Accoding to Newton's law of cooling rate of cooling liquid (represented as y) is plotted against its temperature T. Which of the following curves may represent the plot?
A
B
C
D
Text Solution
The correct Answer is:C
According to Newton(s) law of cooling.
The temperature difference
ΔT=T2−T1=ce−Kt
where c and K are positive constant.
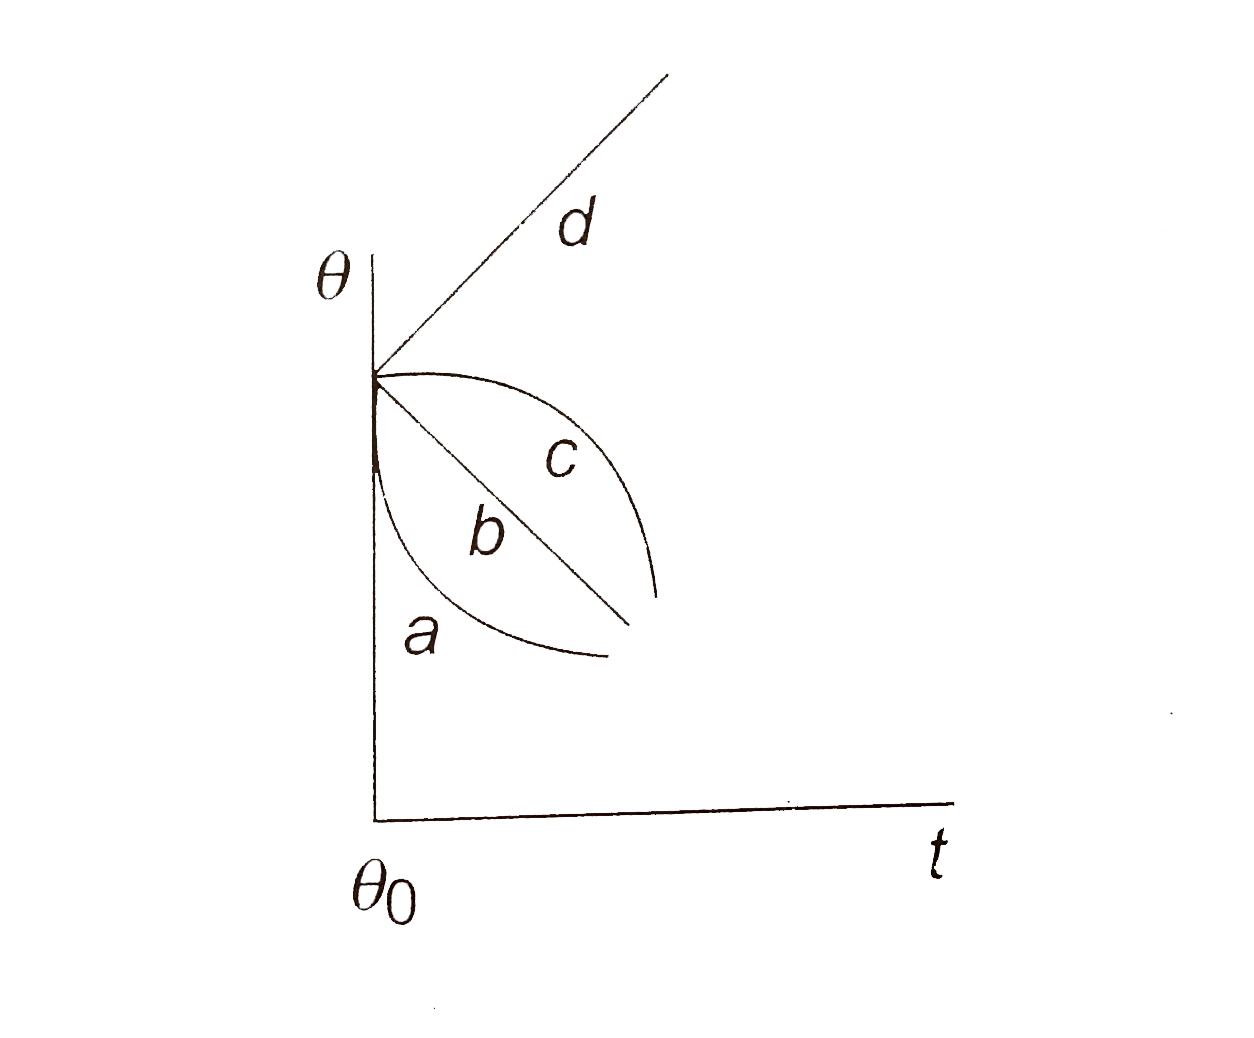
From the above expression the temperature difference is exponentially decreasing with time. Hence the curve (c ) is correct option.
|
Topper's Solved these Questions
- THERMAL PROPERTIES OF MATTERBOOK - NCERT FINGERTPS ENGLISHCHAPTER - THERMAL PROPERTIES OF MATTEREXERCISE - Higher Order
8 Videos
- THERMAL PROPERTIES OF MATTERBOOK - NCERT FINGERTPS ENGLISHCHAPTER - THERMAL PROPERTIES OF MATTEREXERCISE - Exampler Problems
8 Videos
- THERMAL PROPERTIES OF MATTERBOOK - NCERT FINGERTPS ENGLISHCHAPTER - THERMAL PROPERTIES OF MATTEREXERCISE - Change of State
13 Videos
- SYSTEM OF PARTICLES AND ROTATIONAL MOTIONSBOOK - NCERT FINGERTPS ENGLISHCHAPTER - SYSTEM OF PARTICLES AND ROTATIONAL MOTIONSEXERCISE - NCERT Exemplar
8 Videos
- THERMODYNAMICSBOOK - NCERT FINGERTPS ENGLISHCHAPTER - THERMODYNAMICSEXERCISE - Assertion And Reason
15 Videos
Similar Questions
Knowledge Check
Which of the following plots does not represent Boyle's law?
A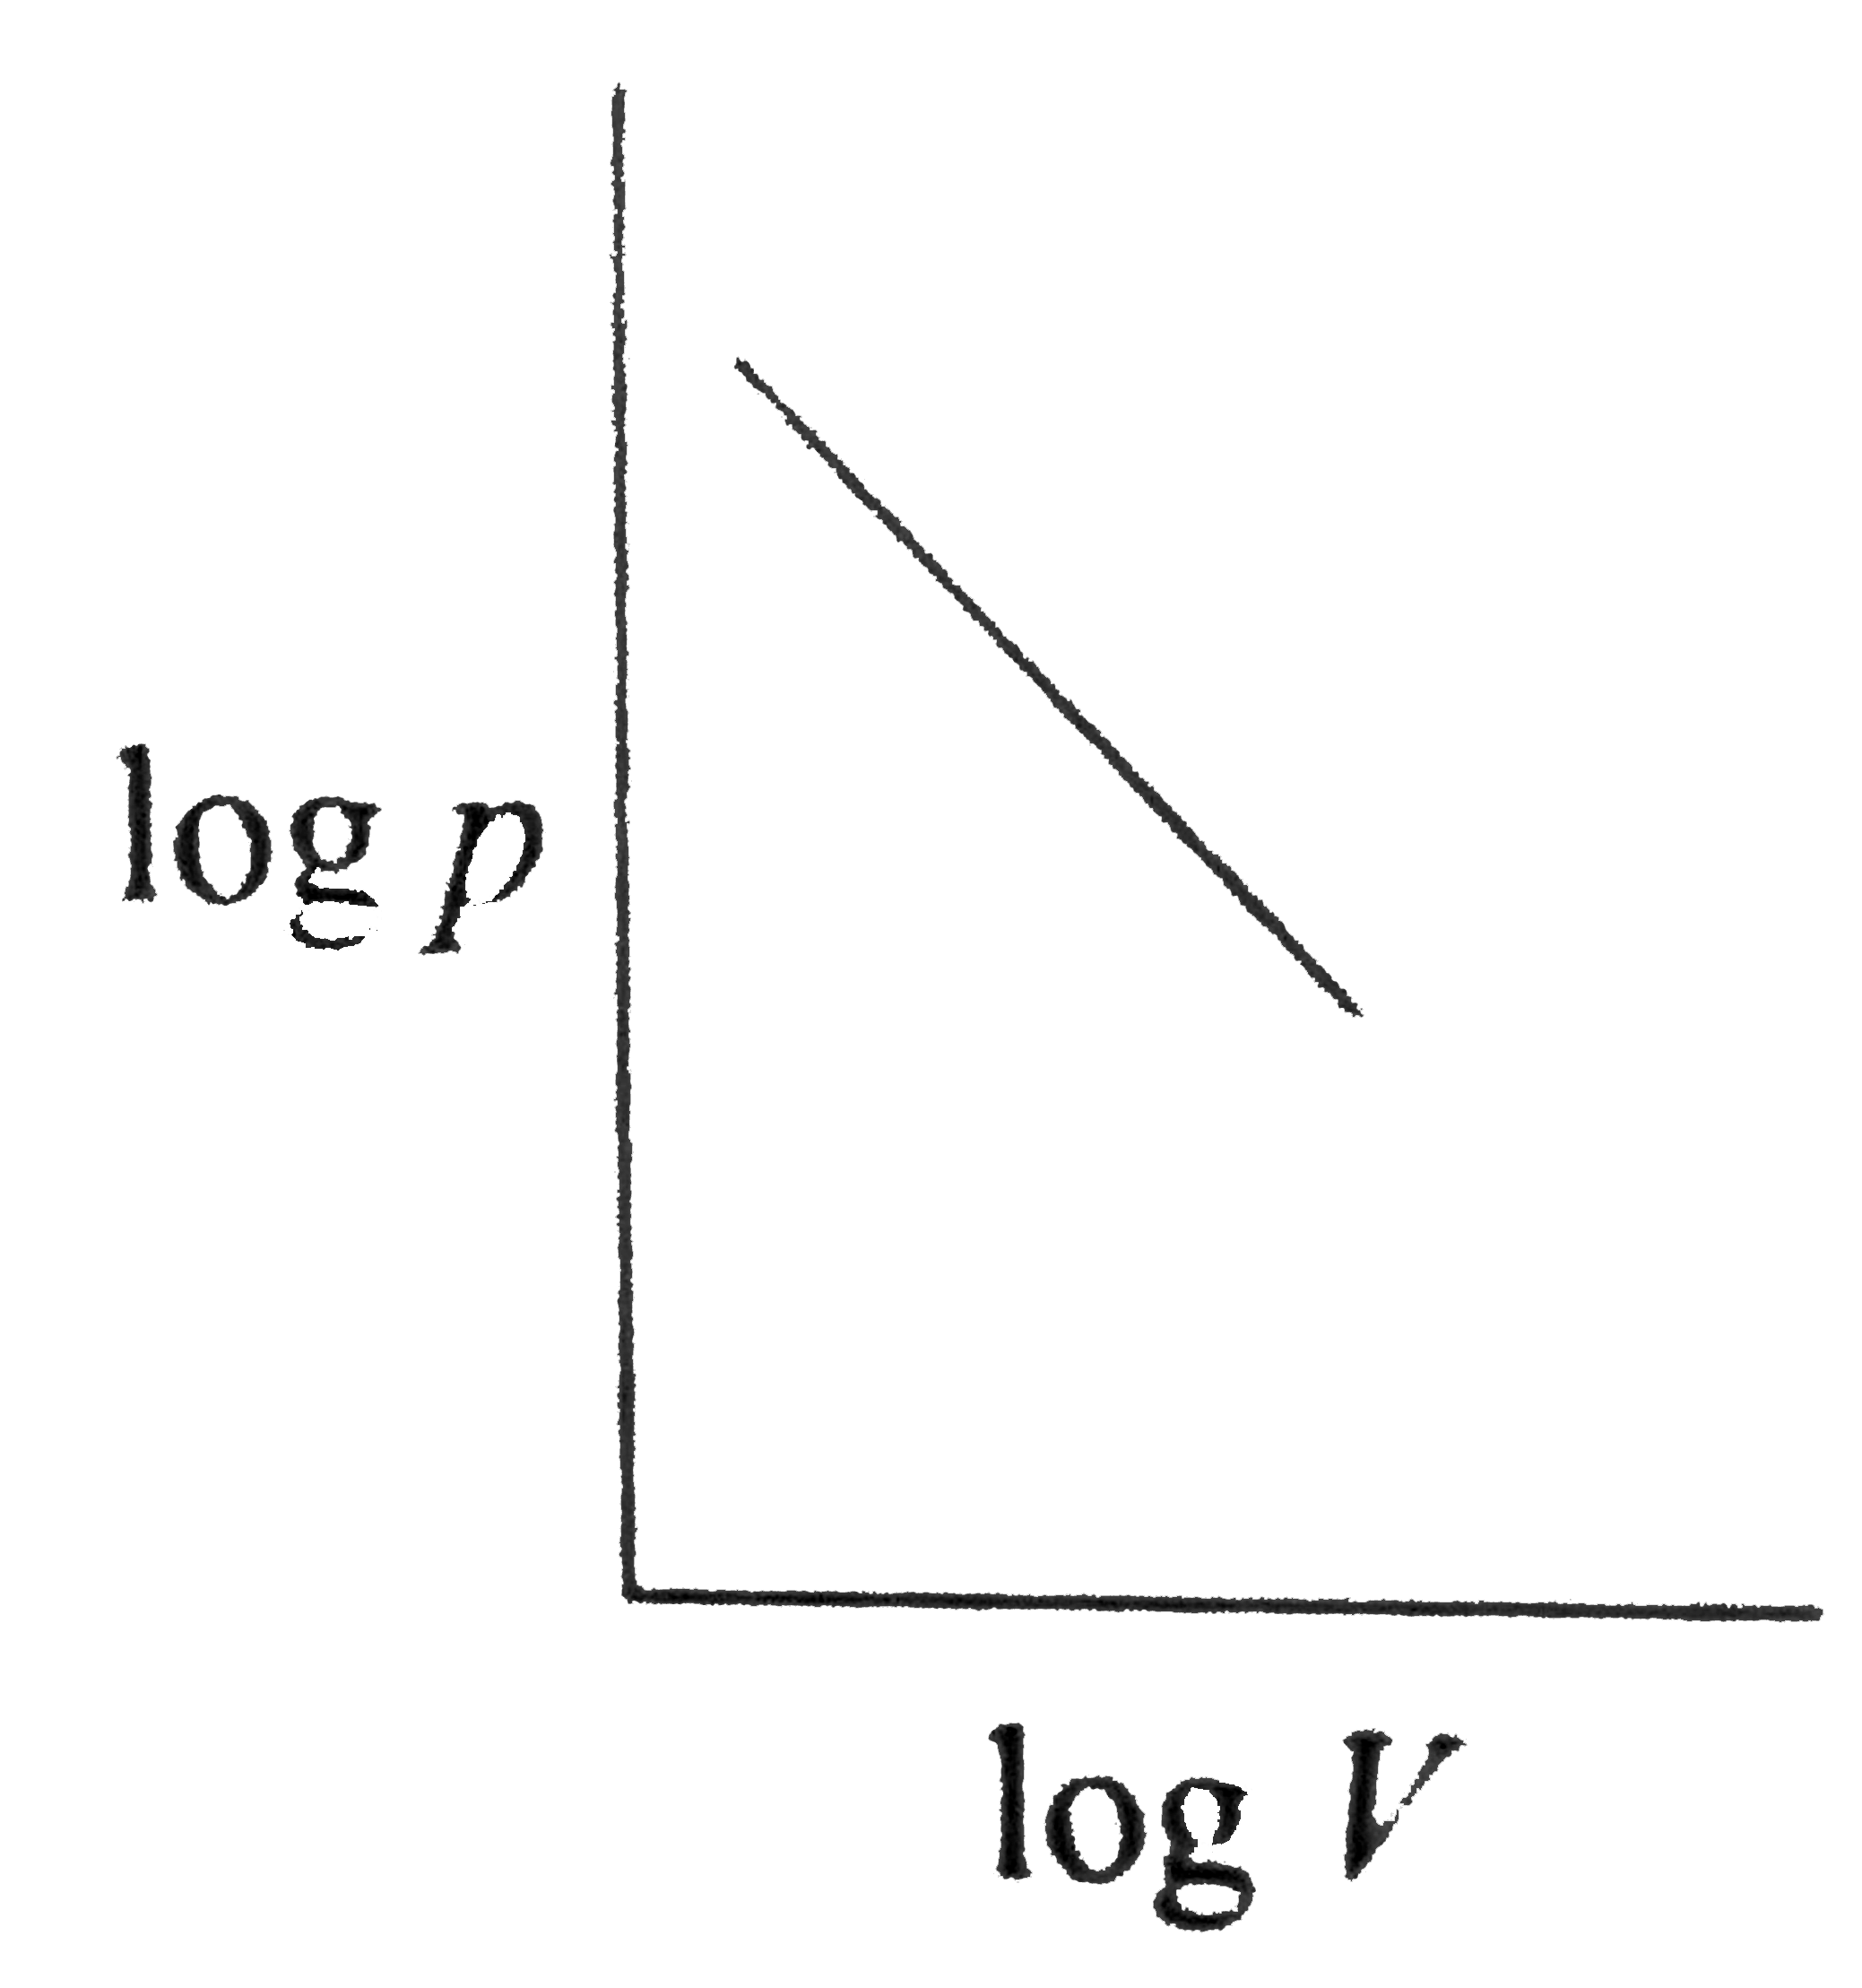 B
B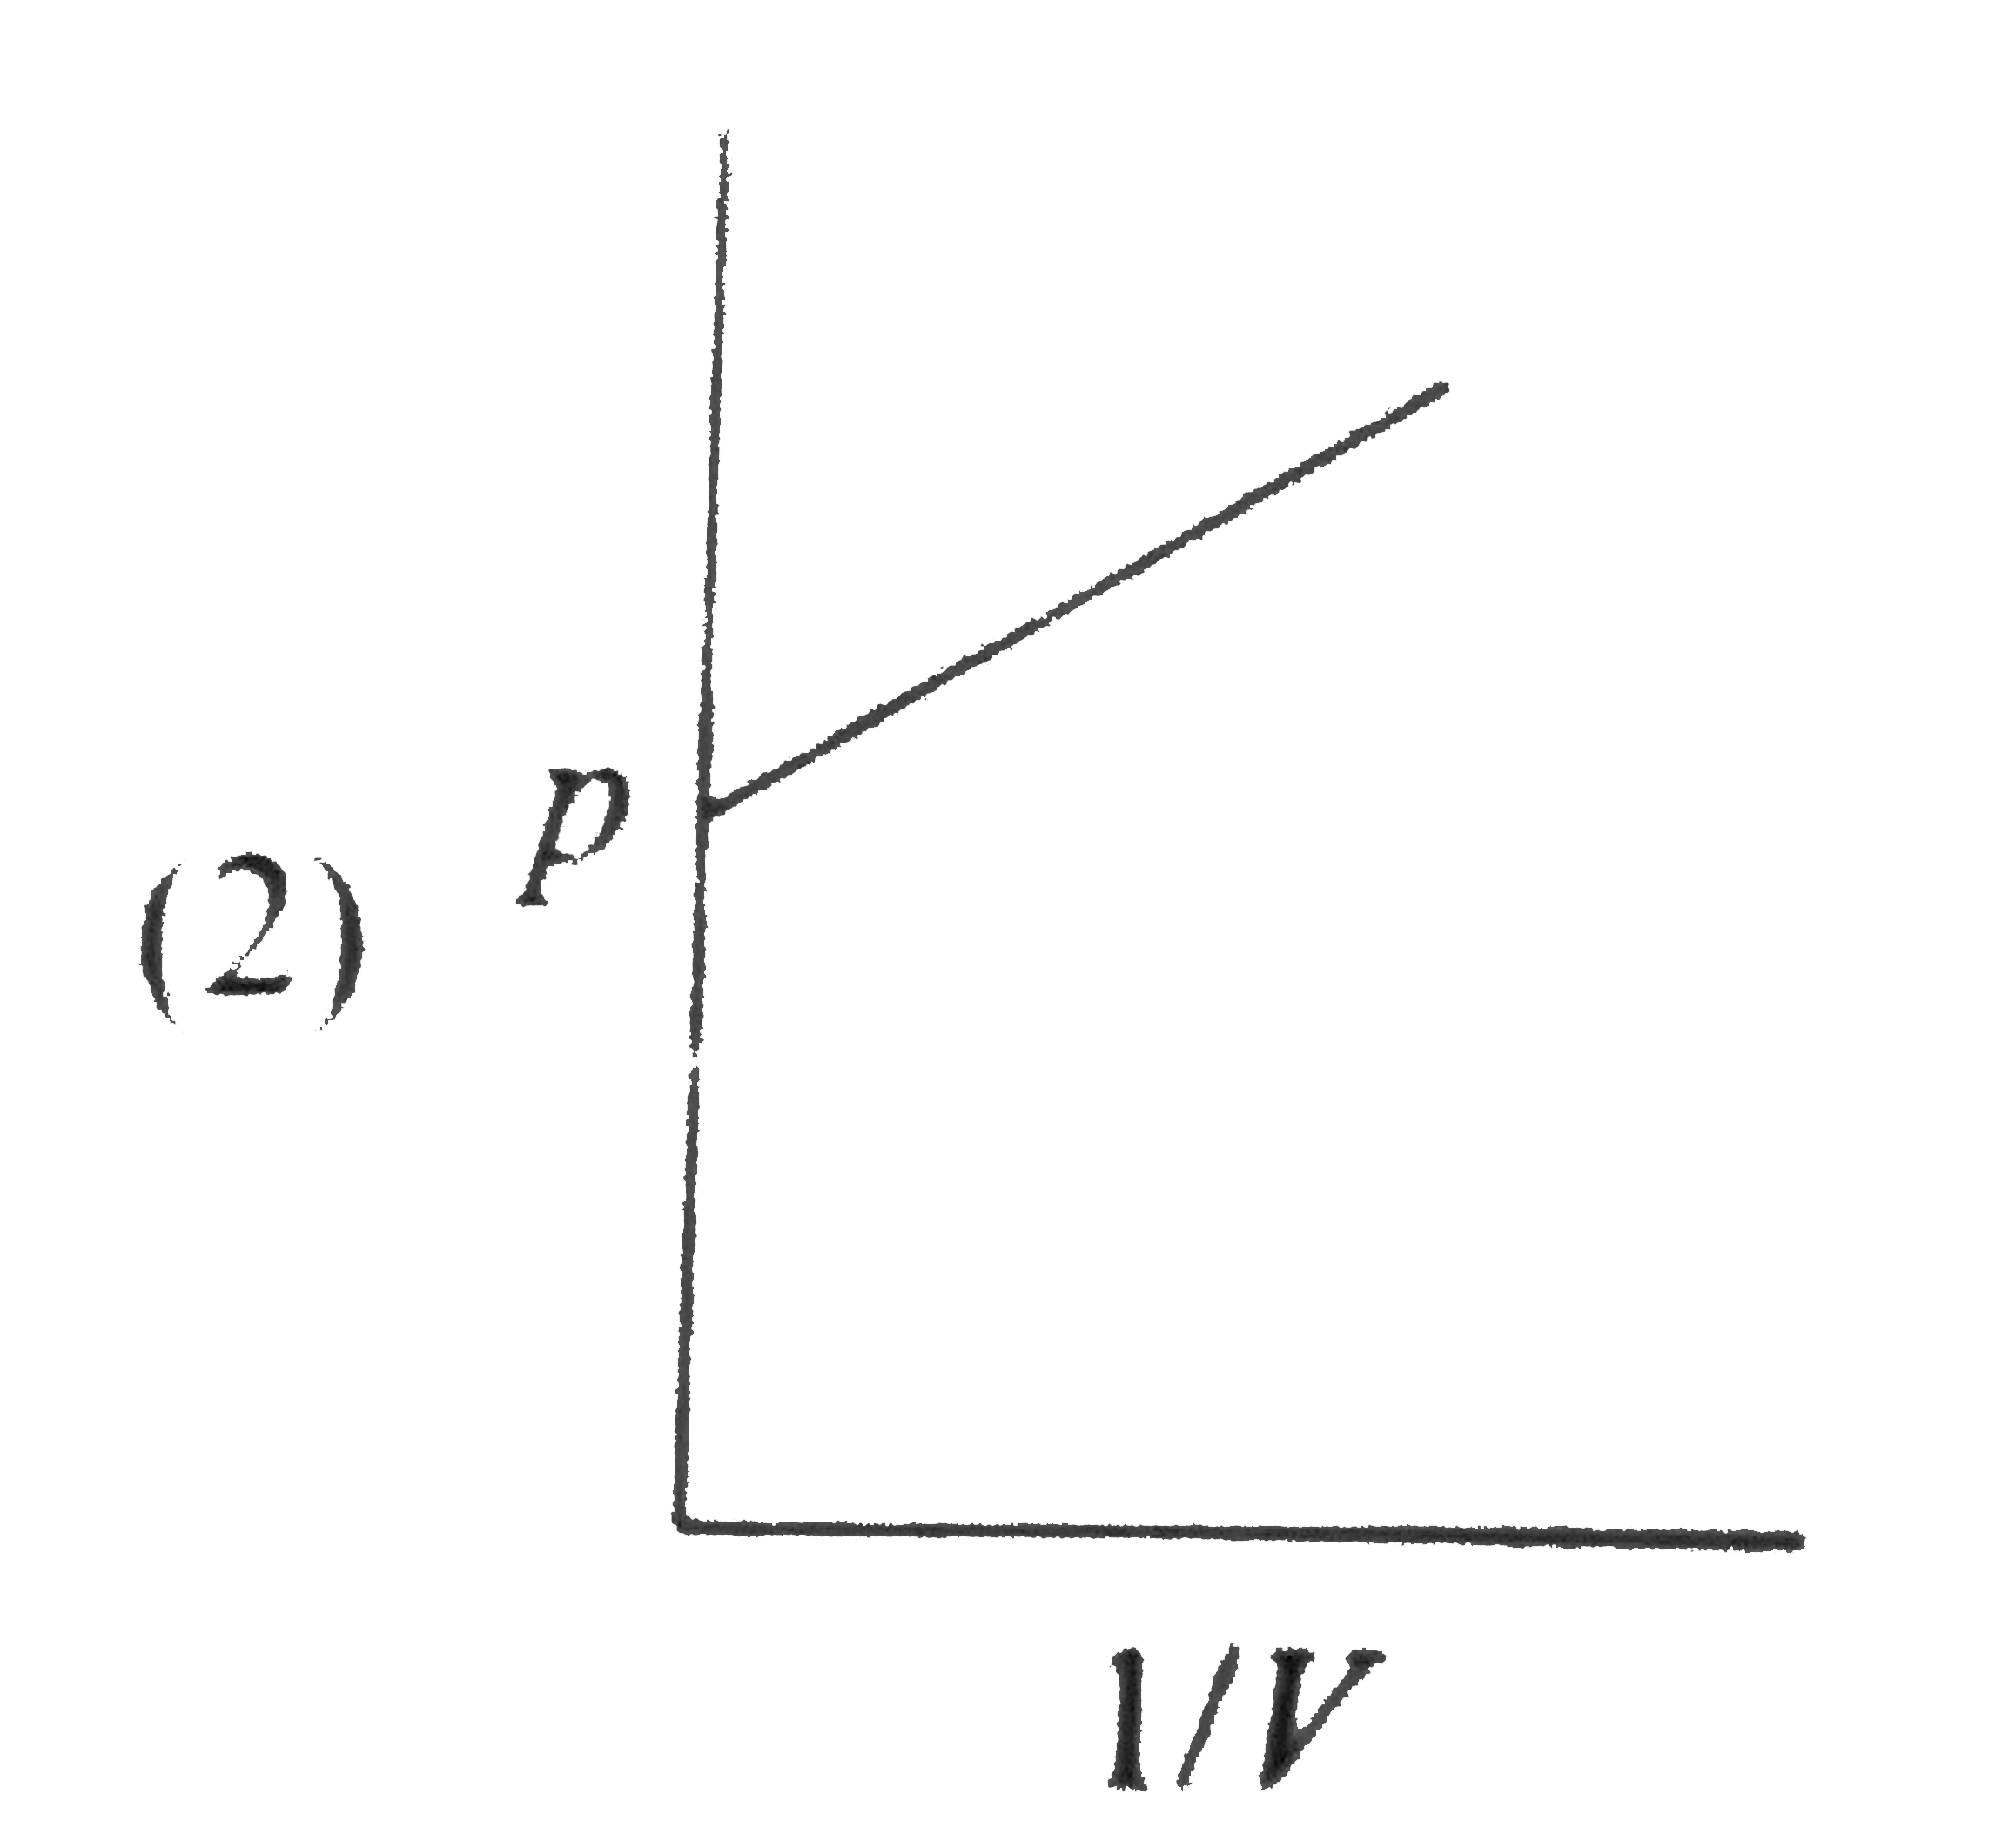 C
C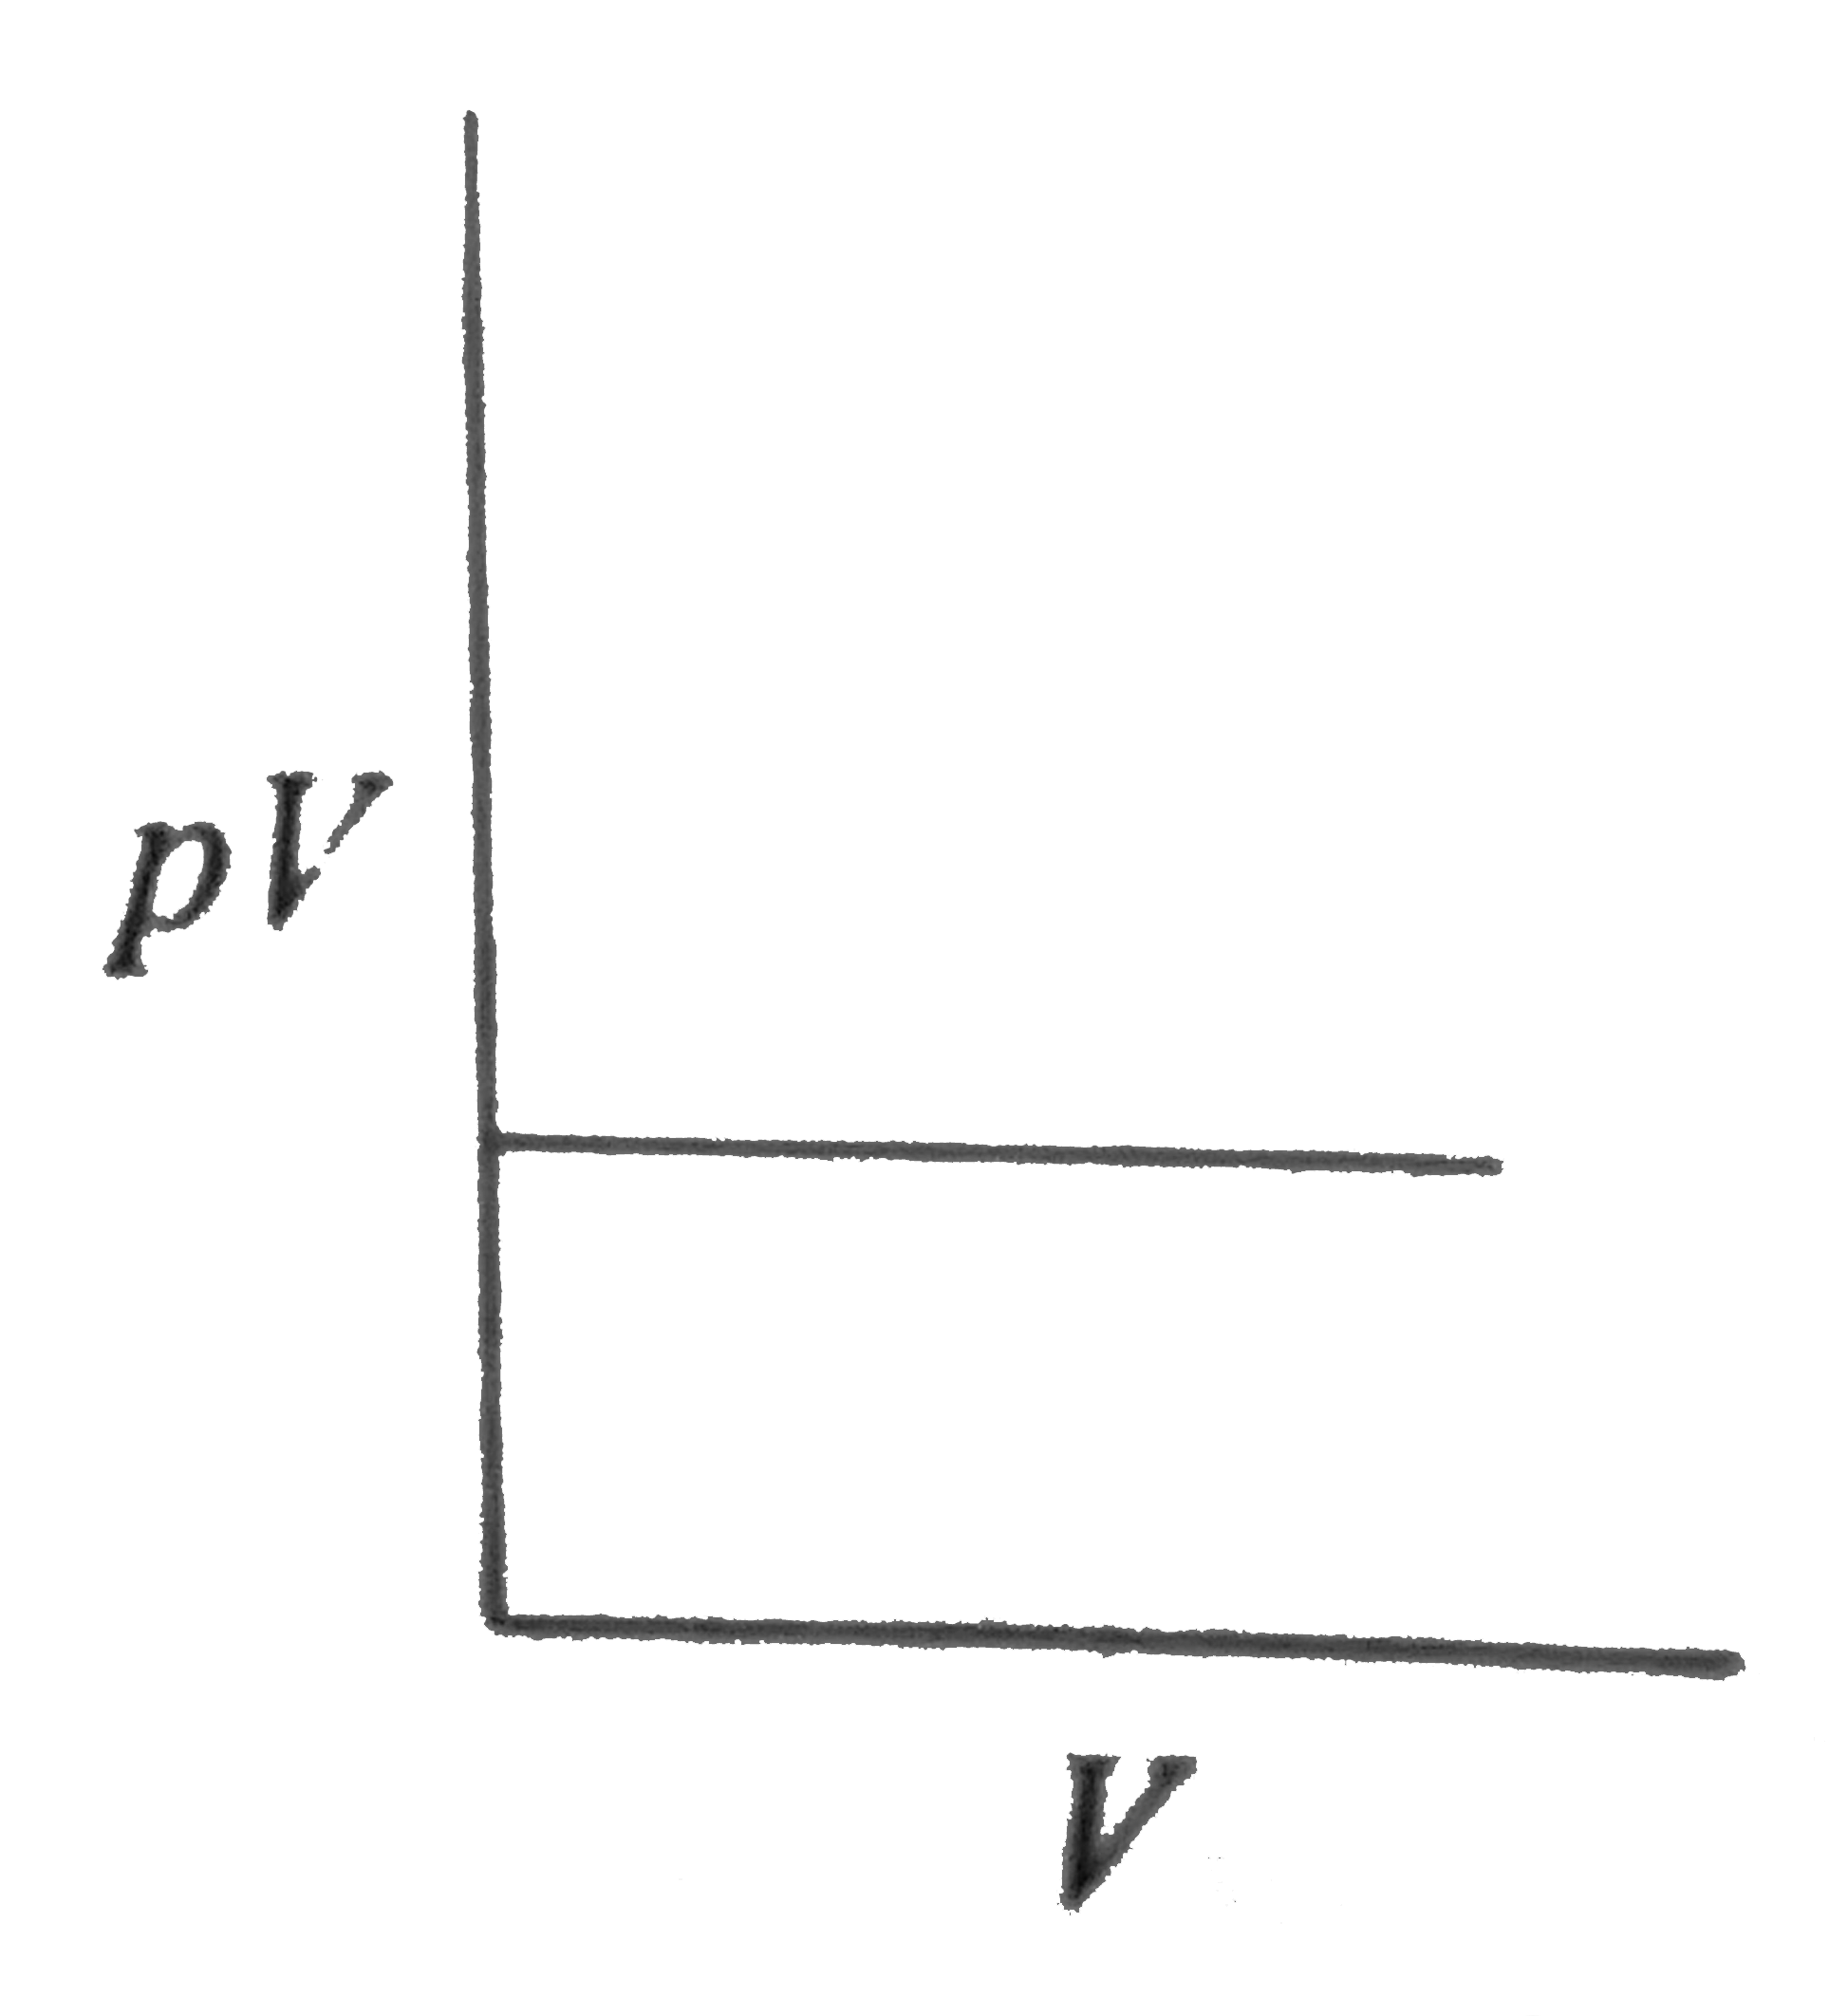 D
D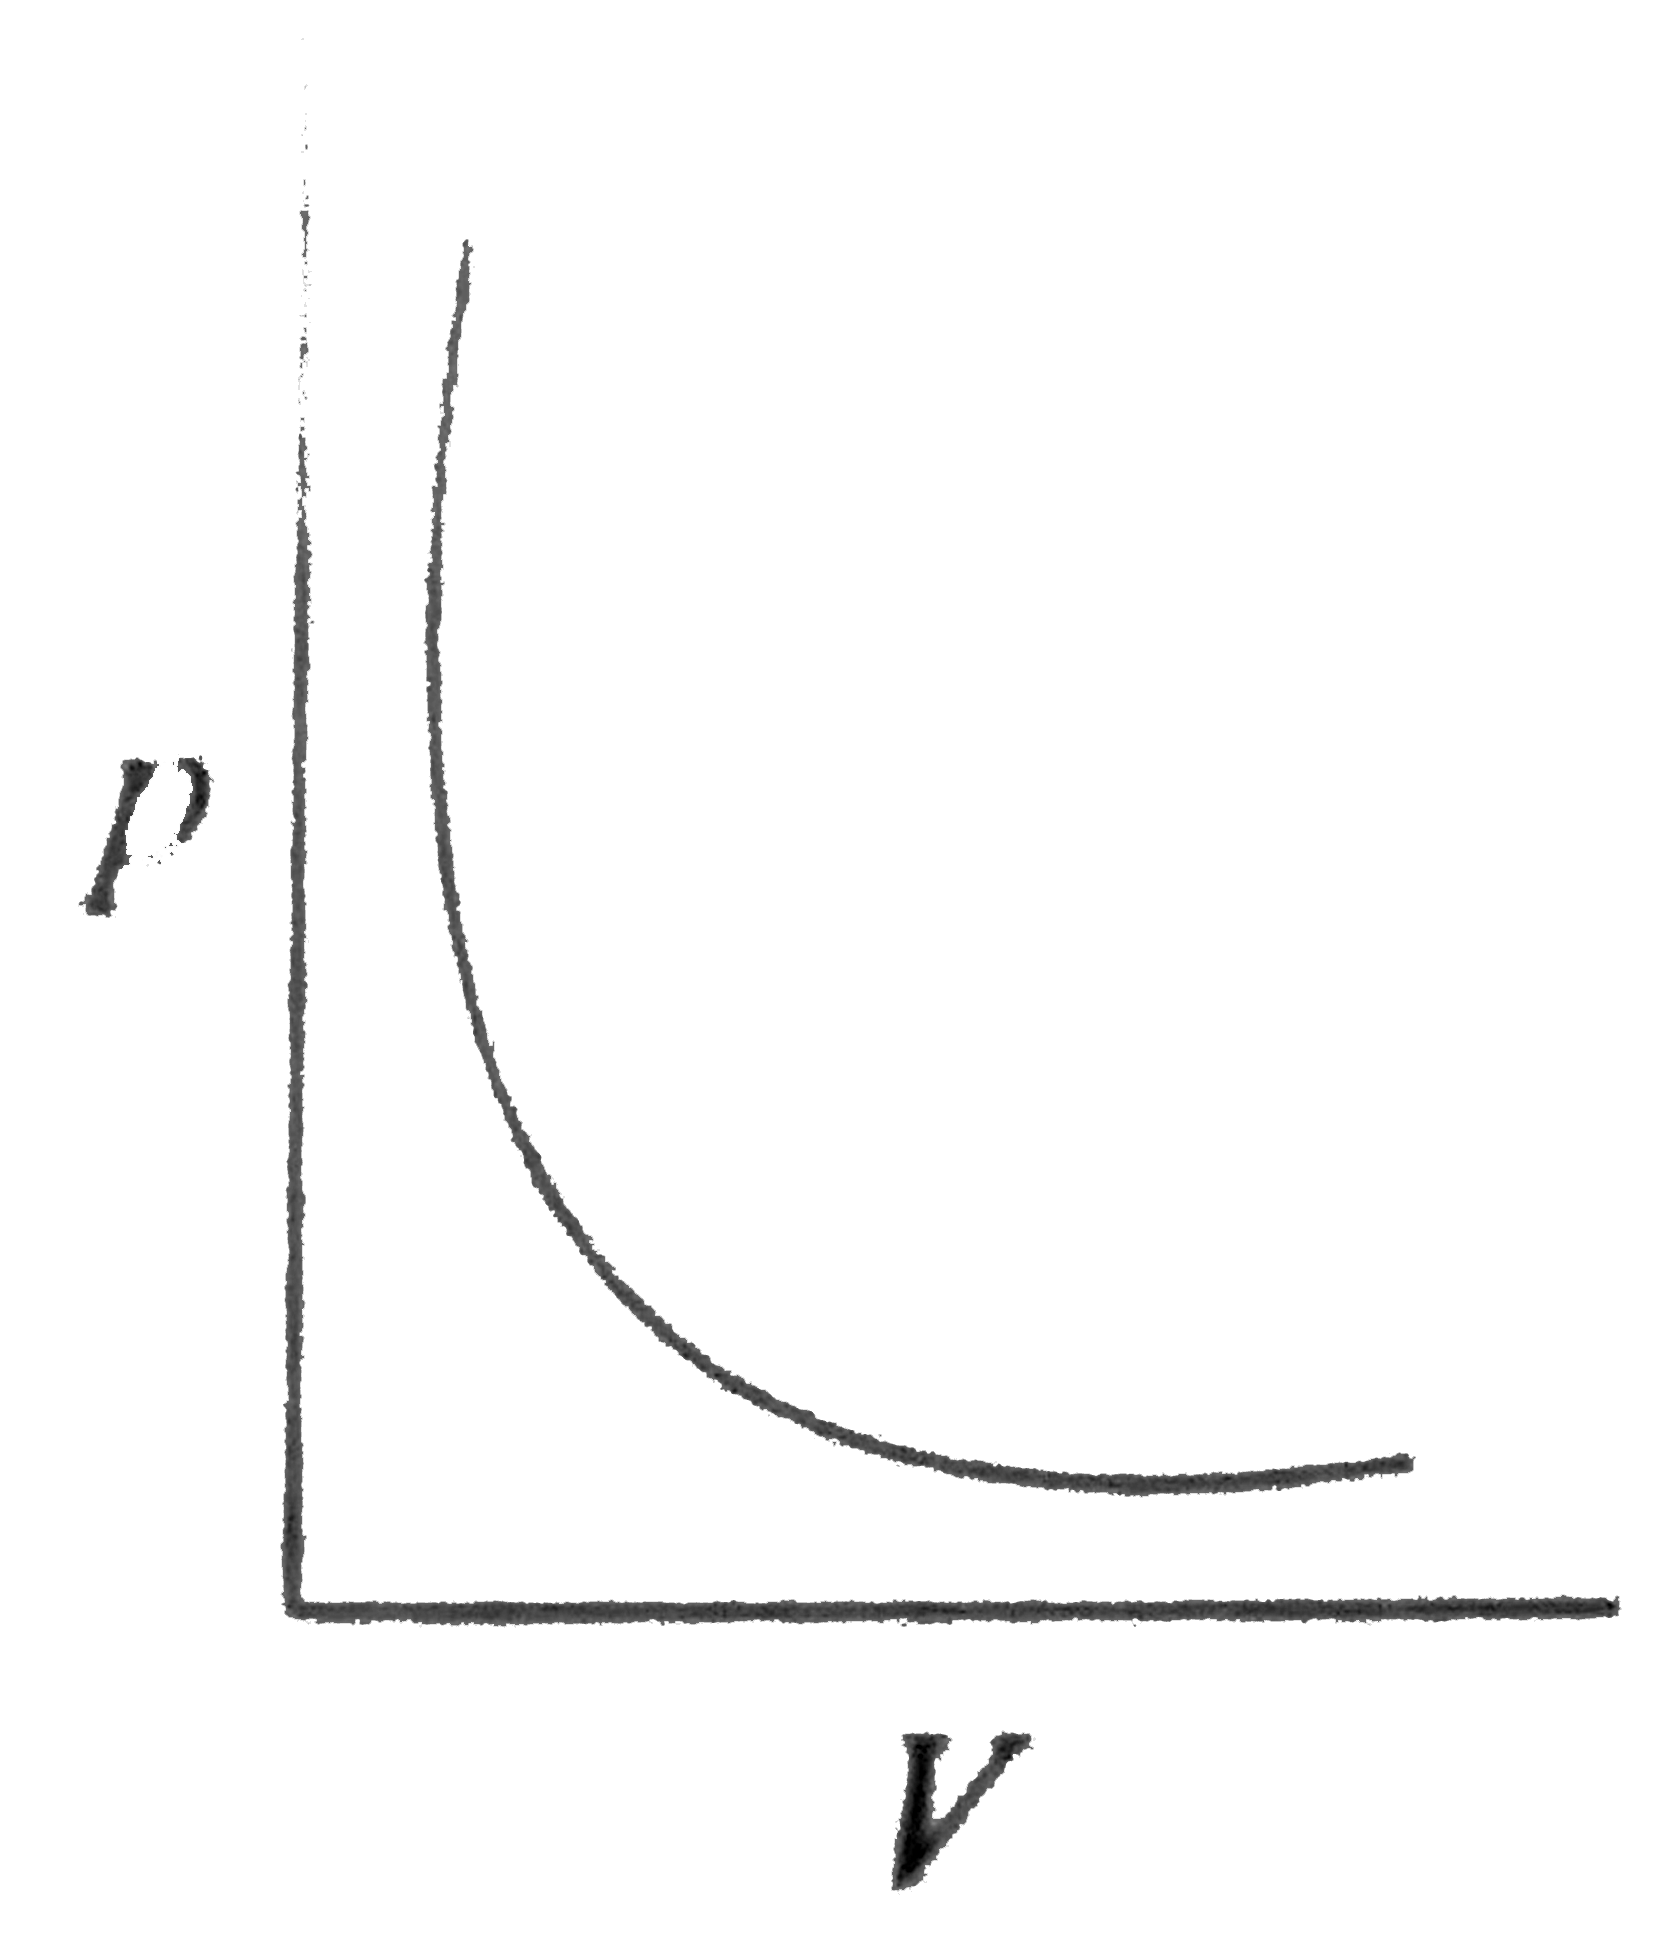
A hot liquid is kept in a big room. Its temperature is plotted as a function of time. Which of the following curves may present the plot ?
 AaBbCcDd
The rate of decay (R) of nuclei in a radioactive sample is plotted against time (t). Which of the following best represents the resulting curve ?
A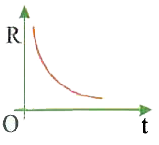 B
B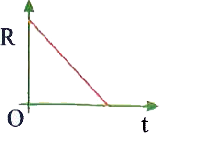 C
C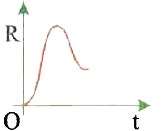 D
D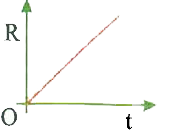
A hot liquid is kept in a big room. Its temperature is plotted as a function of time. Which of the following curves may represent the plot?
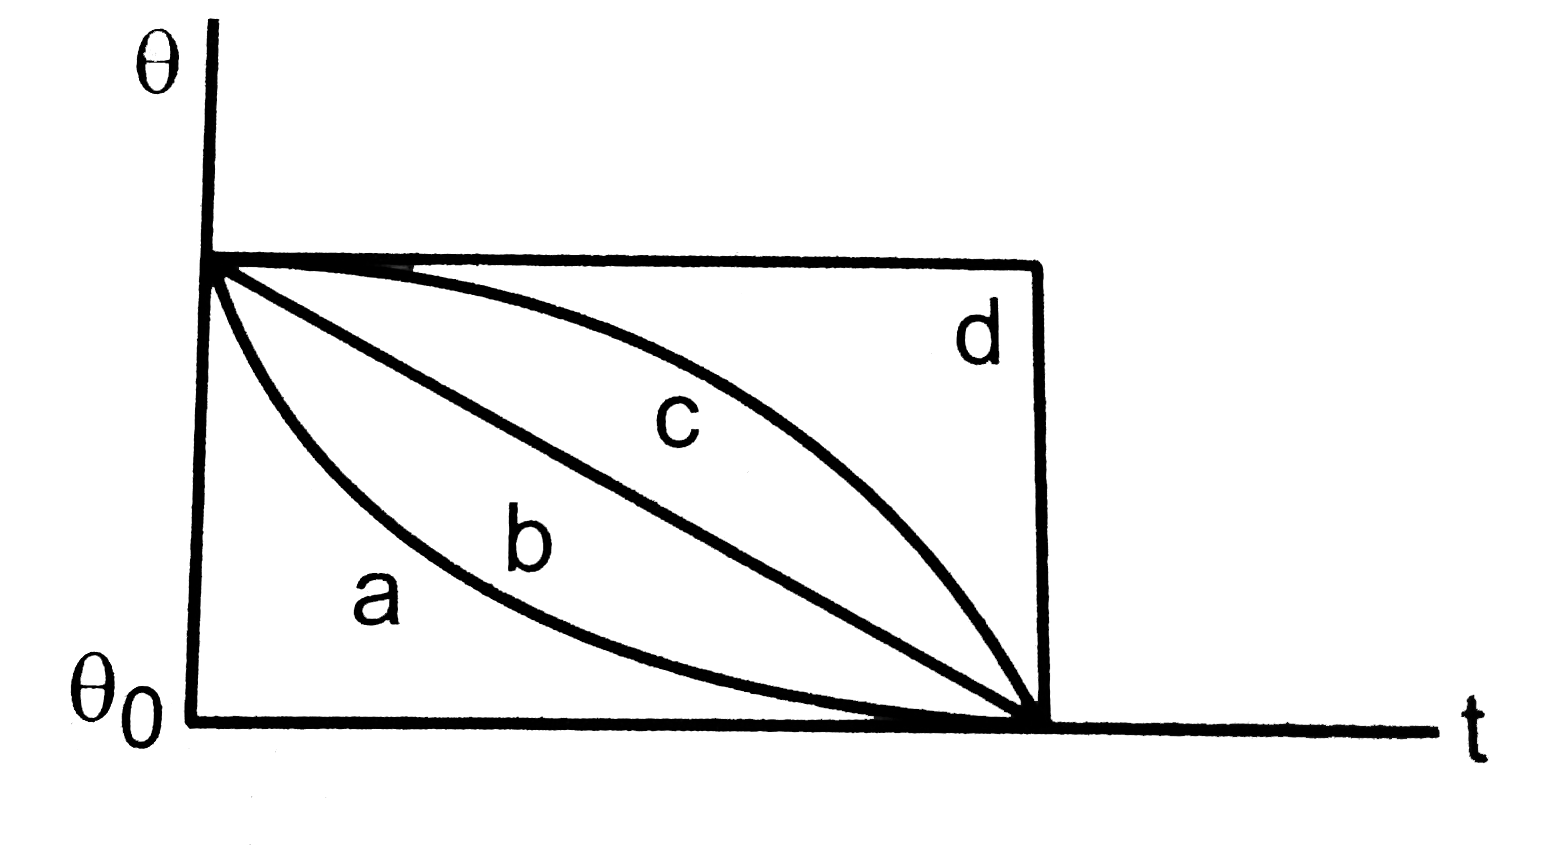
View SolutionA hot liquid is kept in a big room. Its temperature is plotted as a function of time. Which of the following curves may represent the plot?

View SolutionWhich of the following graphs represents rate of cooling of hot water?
View SolutionThe rate of decay (R) of nuclei in a radioactive sample is plotted against time (t). Which of the following best represents the resulting curve ?
View SolutionA cooling curve is plotted between the temperature of a hot body and time. Which of the following is not true for the cooling curve?
View Solution
