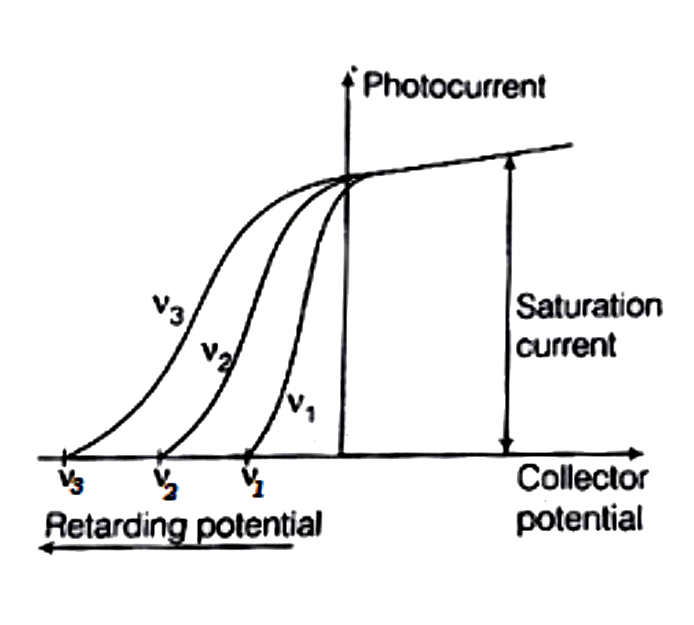
Show the variation of photocurrent with collector plate potential for different frequencies but same intensity of incident radiation.
The correct answer is
Related Solutions
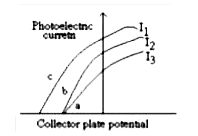
Discuss the variation of photocurrent with collector plate potential for different intensity of radiations.
View SolutionThe Fig shows a plot of three curves a, b, c showing the variation of photocurrent versis collector plate potential for the different intensities I_1, I_2 and I_3 having frequencies v_1, v_2 and v_3 respectively, incident on a photosensitive surface. Point out the two curves for which the incident radiation have same frequency but different intensities.
View SolutionThe variation of photocurrent with collector potential for different frequencies of incident radiation v_1,v_2,v_3 is as shown in the the graph , then
View SolutionThe variation of photocurrent with collector potential for different frequencies of incident radiation is as shown in the the graph , then

View Solutionविभिन्न तीव्रताओं किन्तु सामान आवृत्ति के आपतित विकिरण के लिए संग्राहक प्लेट (एनोड) के विभव के साथ प्रकाश-विद्युत धारा में परिवर्तन को प्रदर्शित कीजिए।
View SolutionDraw a plot showing the variation of photoelectric current with collector plate potential for two different frequencies, of incident radiation having the same intensity. In which case will the stopping potential be higher? Justify your answer.
View SolutionDraw a plot showing the variation of photoelectric current with collector plate potential for two different frequencies, of incident radiation having the same intensity. In which case will the stopping potential be higher? Justify your answer.
View SolutionDraw a plot showing the variation of photoelectric current with collector plate potential for two different frequencies of incident radiation having the same intensity. In which case will the stopping potential be higher? Justify your answer.
View SolutionThe variation of photo-current with collector potential for different frequencies of incident radiation V_1,V_2 and V_3 is as shows in the graph, then
View SolutionDraw the variation cureve of photo current with collector plate potential for differentfrequencies but same intensityof incident radiation.
View Solutionचित्र एक प्रकाश संवेदी सतह पर आपतित व आवृत्तियों वाली क्रमशः तीन भिन्न तीव्रताओं के लिये प्रकाश धारा व संग्राहक प्लेट विभव के परिवर्तन को दर्शाने वाले तीन वक्रों a, b,c के आरेख को दर्शाता है। उन दो चक्रों को चुनिये जिसकी आपतित विकिरणों की आवृत्ति समान परन्तु तीव्रतायें भिन्न है।

View SolutionThe graph of Fig. shows the variation of photoelectric current with collector plate potential for different frequencies of incident radiations. (i) Which physical parameter is kept constant for the three curves? (ii) Which frequency (v_1,v_2 or v_3) is the highest?
View SolutionThree light beams of same frequency and different intensity and are incident on the same metal. Draw a graph showing variation of photocurrent with intensity in same speed
View SolutionDefine photoelectric effect. Draw a graph to show the variation of stopping potential with frequency of incident radiation on a metal plate.
View SolutionDraw a plot showing the variation of photoelectric current with collector plate potential for two different frequencies, , of incident radiation having the same intensity. In which case will the stopping potential be higher ? Justify your answer.
View SolutionDraw a plot showing the variation of potoelectric current with collector plate potential for two different frequencies, v_(1) gt v_(2) , of incident radiation having the same intensity. In which case will the stopping potential be hgiher ? Justify your answer.
View SolutionDraw suitable graphs to show the variation of photoelectric current with collector plate potential for (i) a fixed frequency but different intensities I_(1) gt I_(2) gt I_(3) of radiation. (ii) a fixed intensity but different frequencies v_(1) gt v_(2) gt v_(3) of radiation.
View SolutionDarw graphs showing variation of photoelctric current with applied voltage for two incident radiations of equal frequecny and different intensities. Mark the graph for the radiaiton of higher intensity.
View SolutionDraw graphs showing variation of photoelectric current with applied voltage for three incident radiations of equal frequency and different intensities. Mark the graph for the radiation of higher intensity.
View SolutionWhat is the photoelectric effect? With the help of suitable graph show the variation of photocurrent with (i) the intensity of incident radiation. (ii) the voltage applied between cathode and anode. (iii) the frequency of incident radiation.
View Solution