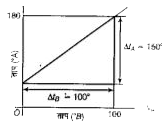
The graph between two temperature scales A and B is shown in Fig. 11.1. Between upper fixed point and lower fixed point there are 150 equal division on scale A and 100 on scale B.The relationship for conversion between the two scales is given by
b tA - 30/150 = tB / 100
Related Solutions
The graph between two temperature scales A and B is shown in figure. Between upper fixed point and lower fixed point there are 150 equal division on A and 100 on scale B. The relationship for conversion between the two scales is given by
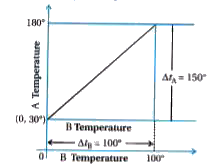
View SolutionThe graph between two temperature scales A and B is shown in Fig. 11.1 Between upper fixed point and lower fixed point there
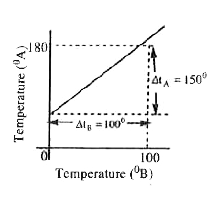
View Solutionदो ताप पैमाने A एवं B के मध्य ग्राफ को चित्र में दिखाया गया है। ऊपरी स्थिर बिन्दु एवं निचले स्थिर बिन्दु के मध्य पैमाने A पर 150 समान भाग तथा पैमाने B पर 100 भाग हैं। दोनों पैमानों के मध्य परिवर्तन के लिए सम्बन्ध हैं -
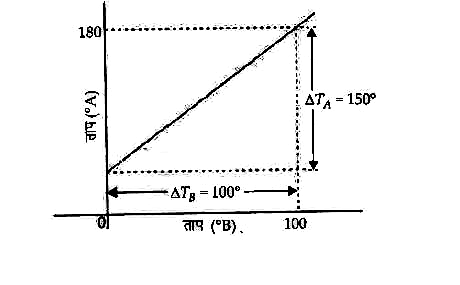
View SolutionPassage - I: The graph between two temperature scales A and B is as shown in fig. Between upper fixed and lower fixed points there are 150 equal divisions on scale A and 100 on scale B. Lower fixed point on scale B and scale A.
View SolutionThe graph between two temperature scales and is shown in Fig. Between upper fixed point and lower fixed point there are equal divisions on scales and on scale . The relation between the temperature in two scales is given by_
_S01_001_Q01.png)
View SolutionThe graph between two temperature scales and is shown in Fig. Between upper fixed point and lower fixed point there are equal divisions on scales and on scale . The relation between the temperature in two scales is given by_
_S01_001_Q01.png)
View SolutionThe graph between two temperature scales and is shown in Fig. Between upper fixed point and lower fixed point there are equal divisions on scales and on scale . The relation between the temperature in two scales is given by_
_S01_001_Q01.png)
View SolutionThe graph between two temperature scales A and B is shown in Fig. Between upper fixed point and lower fixed point there are 150 equal divisions on scales A and 100 on scale B . The relation between the temperature in two scales is given by_
View Solutionचित्र 11.1 में दो तापक्रमों A तथा B के बीच ग्राफ दर्शाया गया है। स्केल A तथा B पर निम्न नियत तापांक तथा उच्च नियत तापांक के बीच क्रमशः 150 तथा 100 समान भाग है|
दोनों स्केलों के बीच रूपांतरण के लिए दिया गया संबंध है -
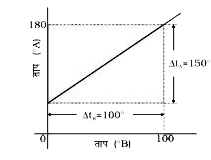
View SolutionPassage - I: The graph between two temperature scales A and B is as shown in fig. Between upper fixed and lower fixed points there are 150 equal divisions on scale A and 100 on scale B. The relation between two scales A and B is given by
View Solutionचित्र में दो तापमान पैमानों A व B के मध्य ग्राफ दर्शाया गया है। निम्न नियत ताप तथा उच्च नियत ताप के मध्य क्रमश 150 तथा 100 समान भाग है । दोनों पैमानों के मध्य रुअंतरण सम्बन्ध होगा
View SolutionA faulty thermometer has its lower fixed point marked as 110^(@) and upper fixed point marked as 110^(@) and upper fixed point marked as 110^(@) . If the temperature of the body shown in this scale is 62^(@) , the temperature shown on the Celsius scale is
View SolutionThe difference between lower fixed point and upper fixed point is divided into_______parts on a Celsius scale
View SolutionDirections: In the following questions, a statement of assertion is followed by a statement of reason.
Assertion : The most common scales used to measure the temperature are celsius scale and fahrenheit scale.
Reason : The interval between upper fixed point and lower fixed point of these scales is divided into 100 equal parts.
Mark the correct choice as:
View Solutionफॉरेनहाइट स्केल का निम्न नियत बिन्दु तथा ऊपरी नियत बिन्दु होता है
View Solutionफारेनहाइट मापक्रम में ऊपरी नियत बिंदु 100 होता है।
View Solutionफारेनहाइट मापक्रम में ऊपरी नियत बिंदु 100 होता है।
View SolutionMention different scales of temperature, mentioning their lower and upper fixed points, Establish a relation between them.
View SolutionThe upper fixed point on Kelvin scale is
View SolutionWhat are two fixed points on a temperature scale?
View Solution