Draw a more than ogive for the following data :Class0-1010-2020-3030-4040-5050-6060-7070-80Frequency5910128754
More than ogive is as shown below :
Related Solutions
Find the mean deviation about the mean for the following data: Marks obtained 10-20 20-30 30-40 40-50 50-60 60-70 70-80 Number of students 2 3 8 14 8 3 2
View SolutionCalculate the mean and S.D. for the following data: Expenditure (in Rs.) 0-10 10-20 20-30 30-40 40-50 Frequency: 14 13 27 21 15
View SolutionCalculate the mean and standard deviation for the following table given the age distribution of a group of people: Age: 20-30 30-40 40-50 50-60 60-70 70-80 80-90 No. of persons: 3 51 122 141 130 51 2
View SolutionCompute mean deviation from mean of the following distribution: Marks 10-20 20-30 30-40 40-50 50-60 60-70 70-80 80-90 No. of students 8 10 15 2 20 18 9 5
View SolutionFind the deviation from the mean and from median of the following distribution: Marks 0-10 10-20 20-30 30-40 40-50 No. of Students 5 8 15 16 6
View SolutionCompute the mean deviation from the median of the following distribution: Class 0-10 10-20 20-30 30-40 40-50 Frequency 5 10 20 5 10
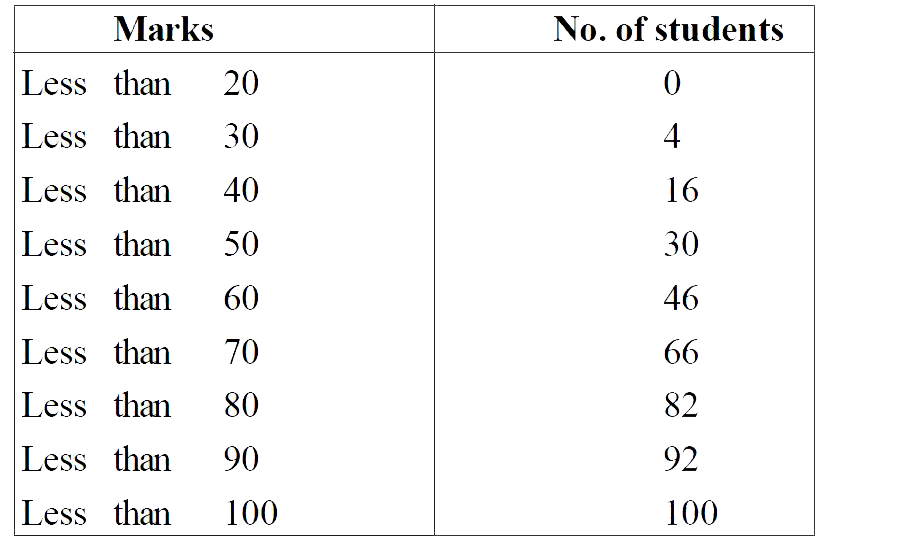
View SolutionDraw a 'more than ogive' for the following data:

View SolutionDraw 'less than' as well as 'more than' ogives for the following data :
View SolutionDraw 'less than' and 'more than' ogive curves from the following data :

View SolutionIf the mean of the following distribution is 54, find the value of Class: 0-20 20-40 40-60 60-80 80-100 Frequency: 7 10 9 13
View SolutionIf the mean of the following distributions 54, find the value of Class: 0-20 20-40 40-60 60-80 80-100 Frequency: 7 10 9 13
View SolutionConstruct a less than ogive and a more than ogive from the following data :

View SolutionConstruct a less than ogive and a more than ogive from the following data :

View SolutionDraw a 'less than' ogive of the following data

View SolutionFrom the data given below draw a more than ogive and find the median.

View SolutionCalculate the standard deviation for the following data: Class 0-30 30-60 60-90 90-120 120-150 10-180 180-210 Frequency: 9 17 43 82 81 44 24
View SolutionDraw a more than ogive from the given data and estimate median with the help of ogive. :

View SolutionFor a given data with 50 observations 'the less than ogive' and the more than ogive intersect at (15.5, 20). The median of the data is ........
View SolutionFor a given data with,60 observations, 'the less than ogive' and 'the more than ogive' intersect at (66.5, 30). The median of the data is ..........
View SolutionFor a given data with 120 observations, the 'less than ogive' and the 'more than ogive' intersect at (42.5,60) the median of the data is........
View Solution