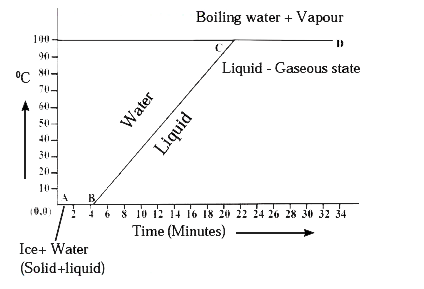
Explain the following temperature vs time graph.
During heating ice the change in temperature with time is shown in the graphSeg AB: Seg AB represents conversion of ice in to water at constant temperature. During melting of ice at 0oC ice absorb heat energy and this continues till all the ice converts into water.Seg BC: once all ice is transformed into water temperature of water starts rising it increases up to 100oC. Seg BC represents rise in temperature of water from 0oC to 100oC.Seg CD: even though the heat energy is supplied to the water after 100oC its temperature does not rise. The heat energy absorbed by water is used to break the bonds between molecules of the liquid to convert it into gaseous state.
Related Solutions
Explain the following temperature Vs. time graph:
View SolutionAnswer the following questions : Explain the following temperature vs time graph
View SolutionExplain the following temperature versus time graph.

View SolutionWhich of the following v Vs t graph are correct representation for the acceleration Vs time graph shown below

View Solutionतथा के ग्राफो की प्रकृति बताइए |
View SolutionSlope of the distance vs time graph ……………..
View SolutionPressure vs volume graph at constant temperature is known as…………….
View SolutionDensity vs volume graph is shown in the figure. Find corresponding pressure vs temperature graph
View SolutionPressure vs volume graph is shown in the figure . Find corresponding pressure vs temperature graph :
View SolutionDensity vs volume graph is shown in the figure . Find corresponding pressure vs temperature graph :
View Solutionfor a given mass of an ideal gas at constant temperature draw and explain the graphs (i) PV^(2) vs V (ii) P^(2)V vs V.
View SolutionGraphs in Kinematics|| Displacement-time graph|| Velocity-time graph|| accn vs time graph
View SolutionExplain Graph of time against temperature for Hope's Apparatus
View SolutionState and explain Boyle's law. Draw PV vs P Graph at constant temperature.
View SolutionA ball is thrown vertically upward. For the motion of the ball till it returns to ground, draw the (i)height vs time graph (ii) velocity vs time graph (iii) acceleration vs time graph (iv) velocity vs height graph
View SolutionInstantaneous Velocity#!#Position vs time graph
View SolutionFor a falling body the nature of acceleration vs. time graph
View SolutionDraw position vs time graph of uniform velocity.
View SolutionWhich of the substances A, B or C has the highest specific heat ? The temperature vs time graph is shown

View SolutionTemperature vs. time graphs are given below for 2 substances. Compare specific heat capacity
View Solution