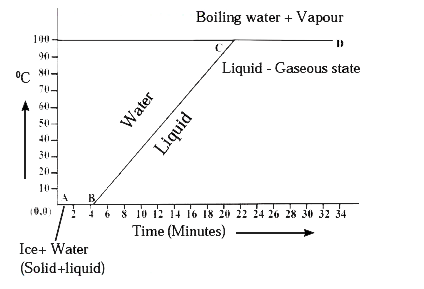
Explain the following temperature versus time graph.
 Solution in Marathi
Step by step video & image solution for Explain the following temperature versus time graph. by Physics experts to help you in doubts & scoring excellent marks in Class 10 exams.
Updated on:21/07/2023Topper's Solved these Questions
Similar Questions
Give scientific reasons:
We feel that some objects are cold, and some are hot. Is this feeling related in some way to out body temperature?
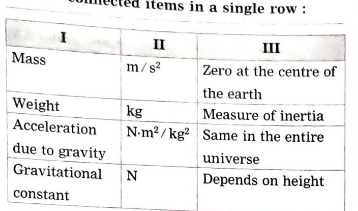
View SolutionStudy the entries in the following table and rewrite them putting the connected items in a single row.

View SolutionAnswer the following questions :
At which position will you keep an object in front of a convex lens so as to get a real image of the same size as the object ? Draw a figure.
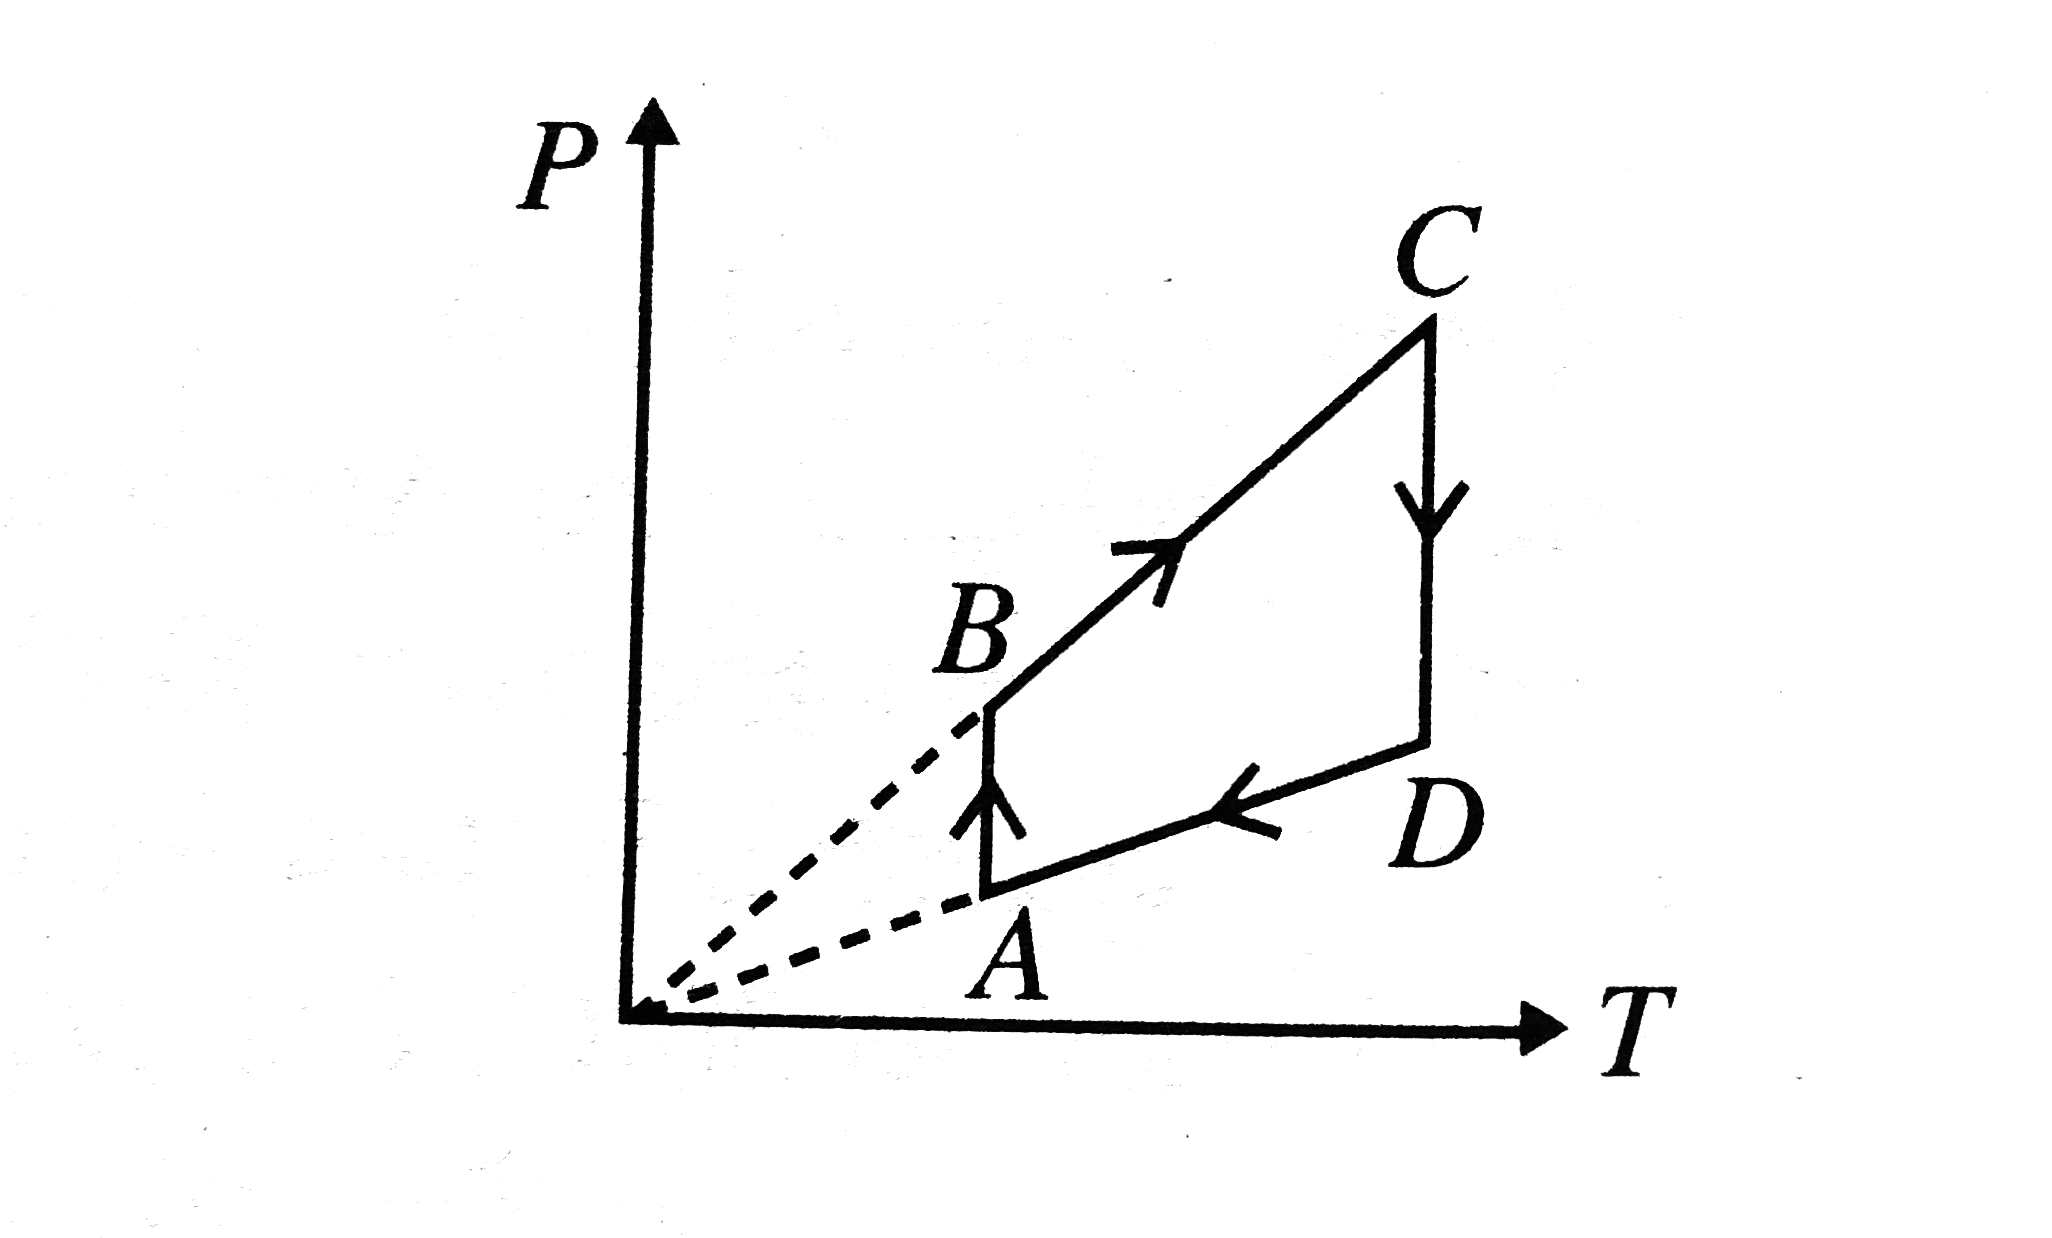
View SolutionPressure versus temperature graph of an ideal gas as shown in Fig. Corresponding density (rho) versus volume (V) graph will be
View SolutionThe graph of displacement versus time is shown. Its corresponding velocity-time graph will be.
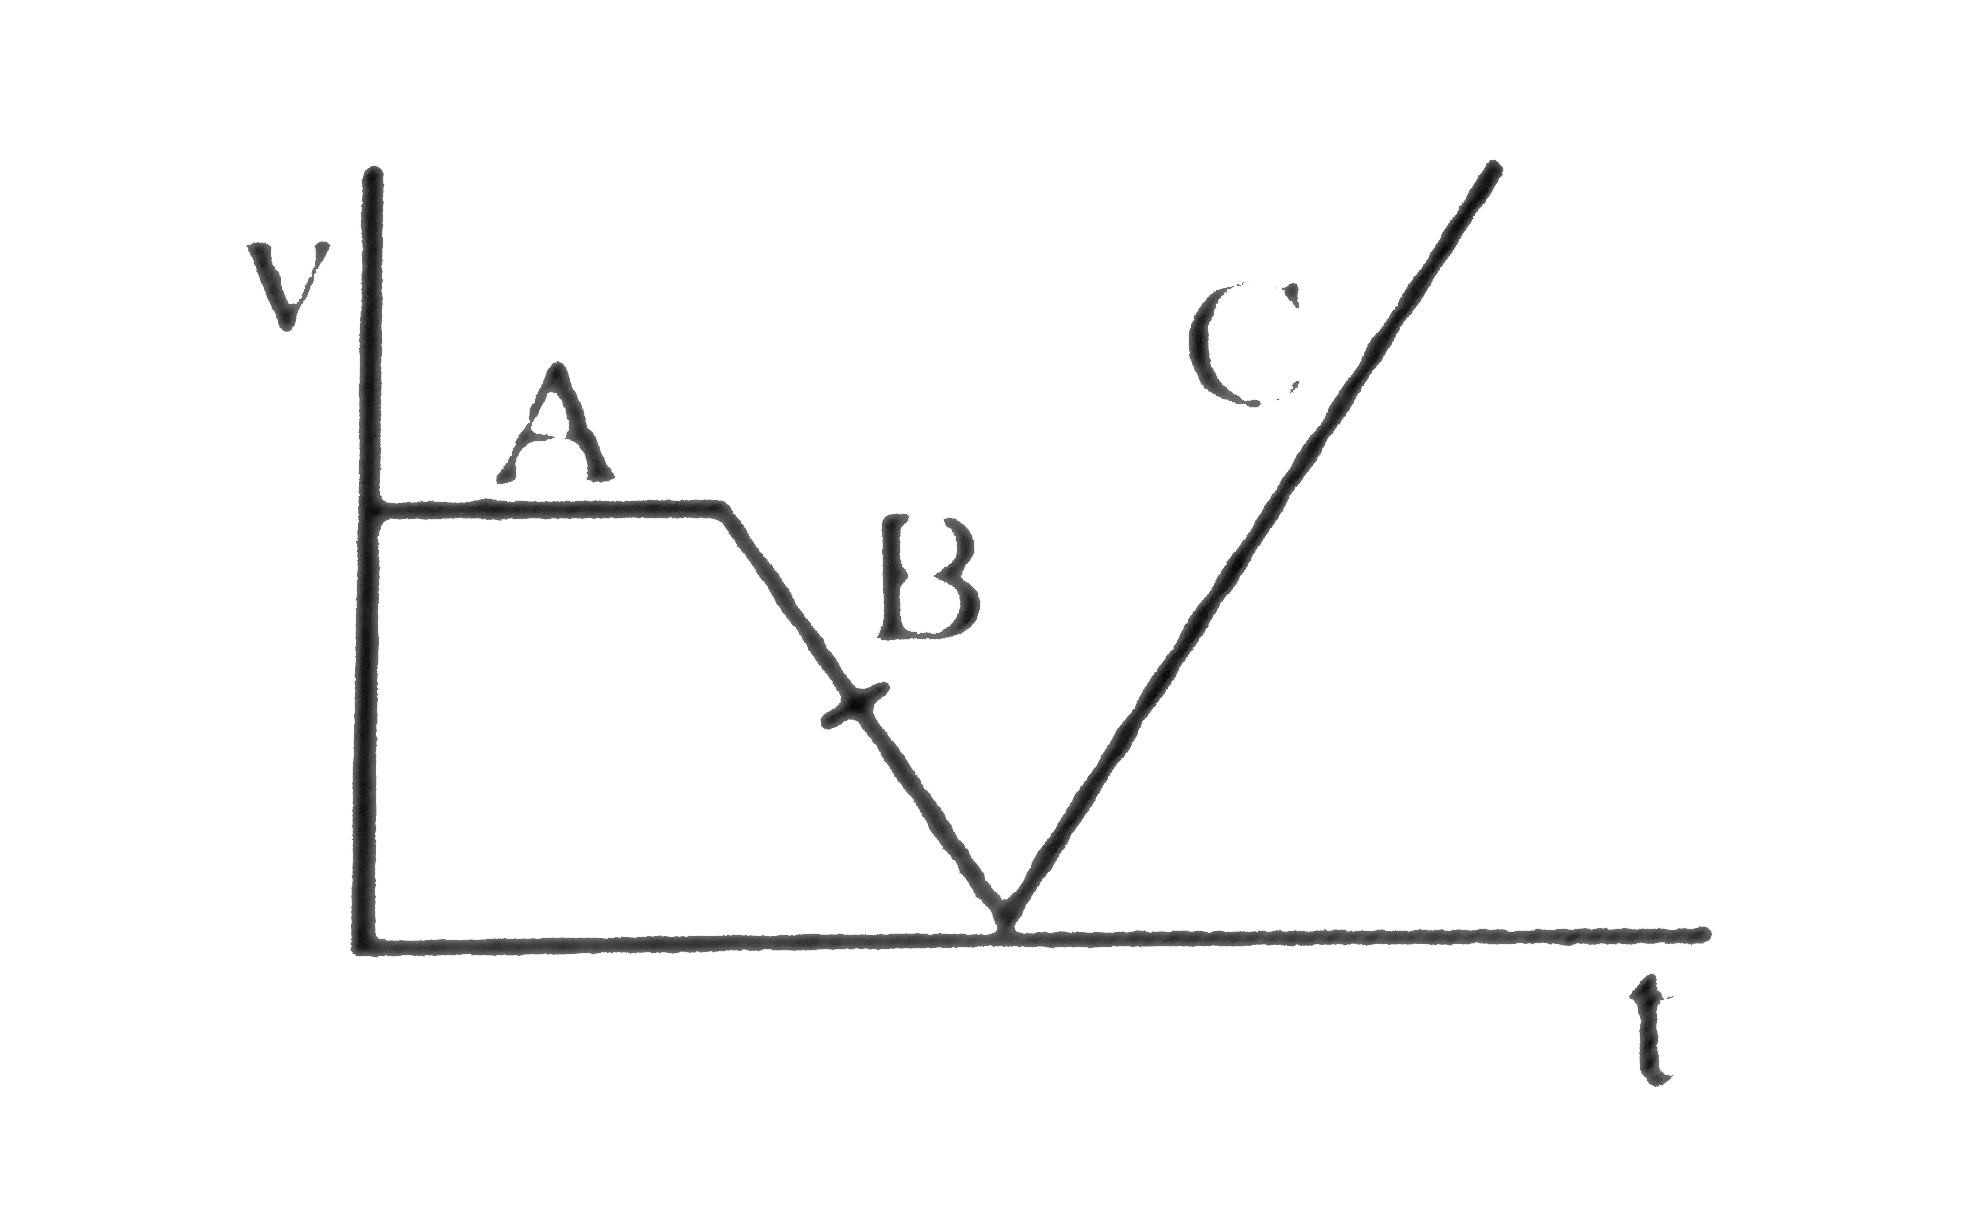
View SolutionVelocity versus time graph of a body is shown in figure. It explains that

View SolutionExplain the following temperature Vs. time graph:
View SolutionDraw a graph of temperature versus time.
View SolutionDraw a graph of temperature versus time.
View SolutionA body at temperature 310 K is kept in an atmosphere whose temperature is 300 K. The temperature versus time graph of the body will be
View SolutionWhich of the two graphs will be a straight line at constant temperature ? P versus V or P versus 1/V ? Explain.
View SolutionWhich of the two graphs will be a straight line at constant temperature P versus V or P versus 1/V Explain.
View SolutionExplain Graph of time against temperature for Hope's Apparatus
View SolutionIn the following graph (Fig. 2.4) of displacement versus time,
View SolutionPressure versus temperature graph of an ideal gas as shown in Fig.
Corresponding density (ρ) versus volume (V) graph will be

View SolutionPressure versus temperature graph of an ideal gas as shown in Fig.
Corresponding density (ρ) versus volume (V) graph will be

View Solution
