A spherical insulator of radius R is charged uniformly with a charge Q throughout its volume and contains a point charge Q16 located at its centre. Which of the following graphs best represents qualitatively, the variation of electric field intensity E with distance r from the centre?
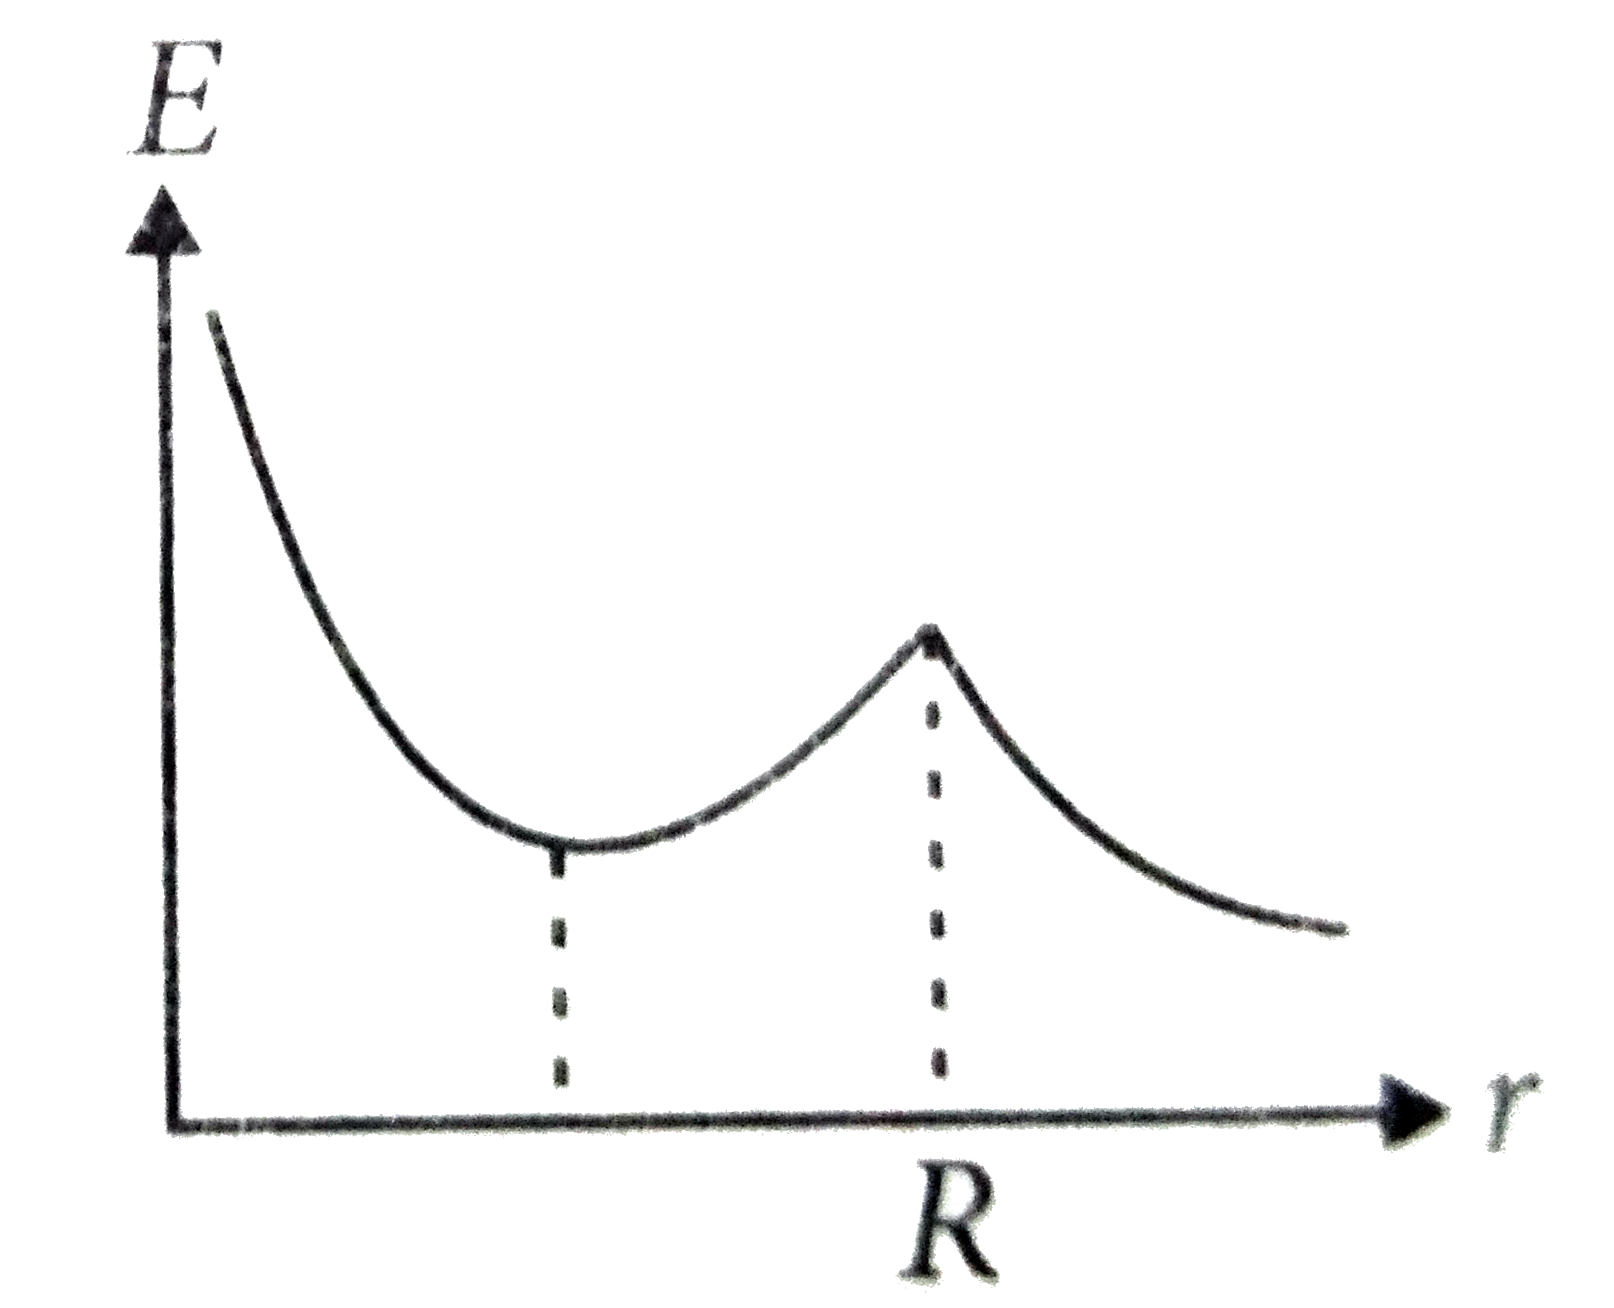
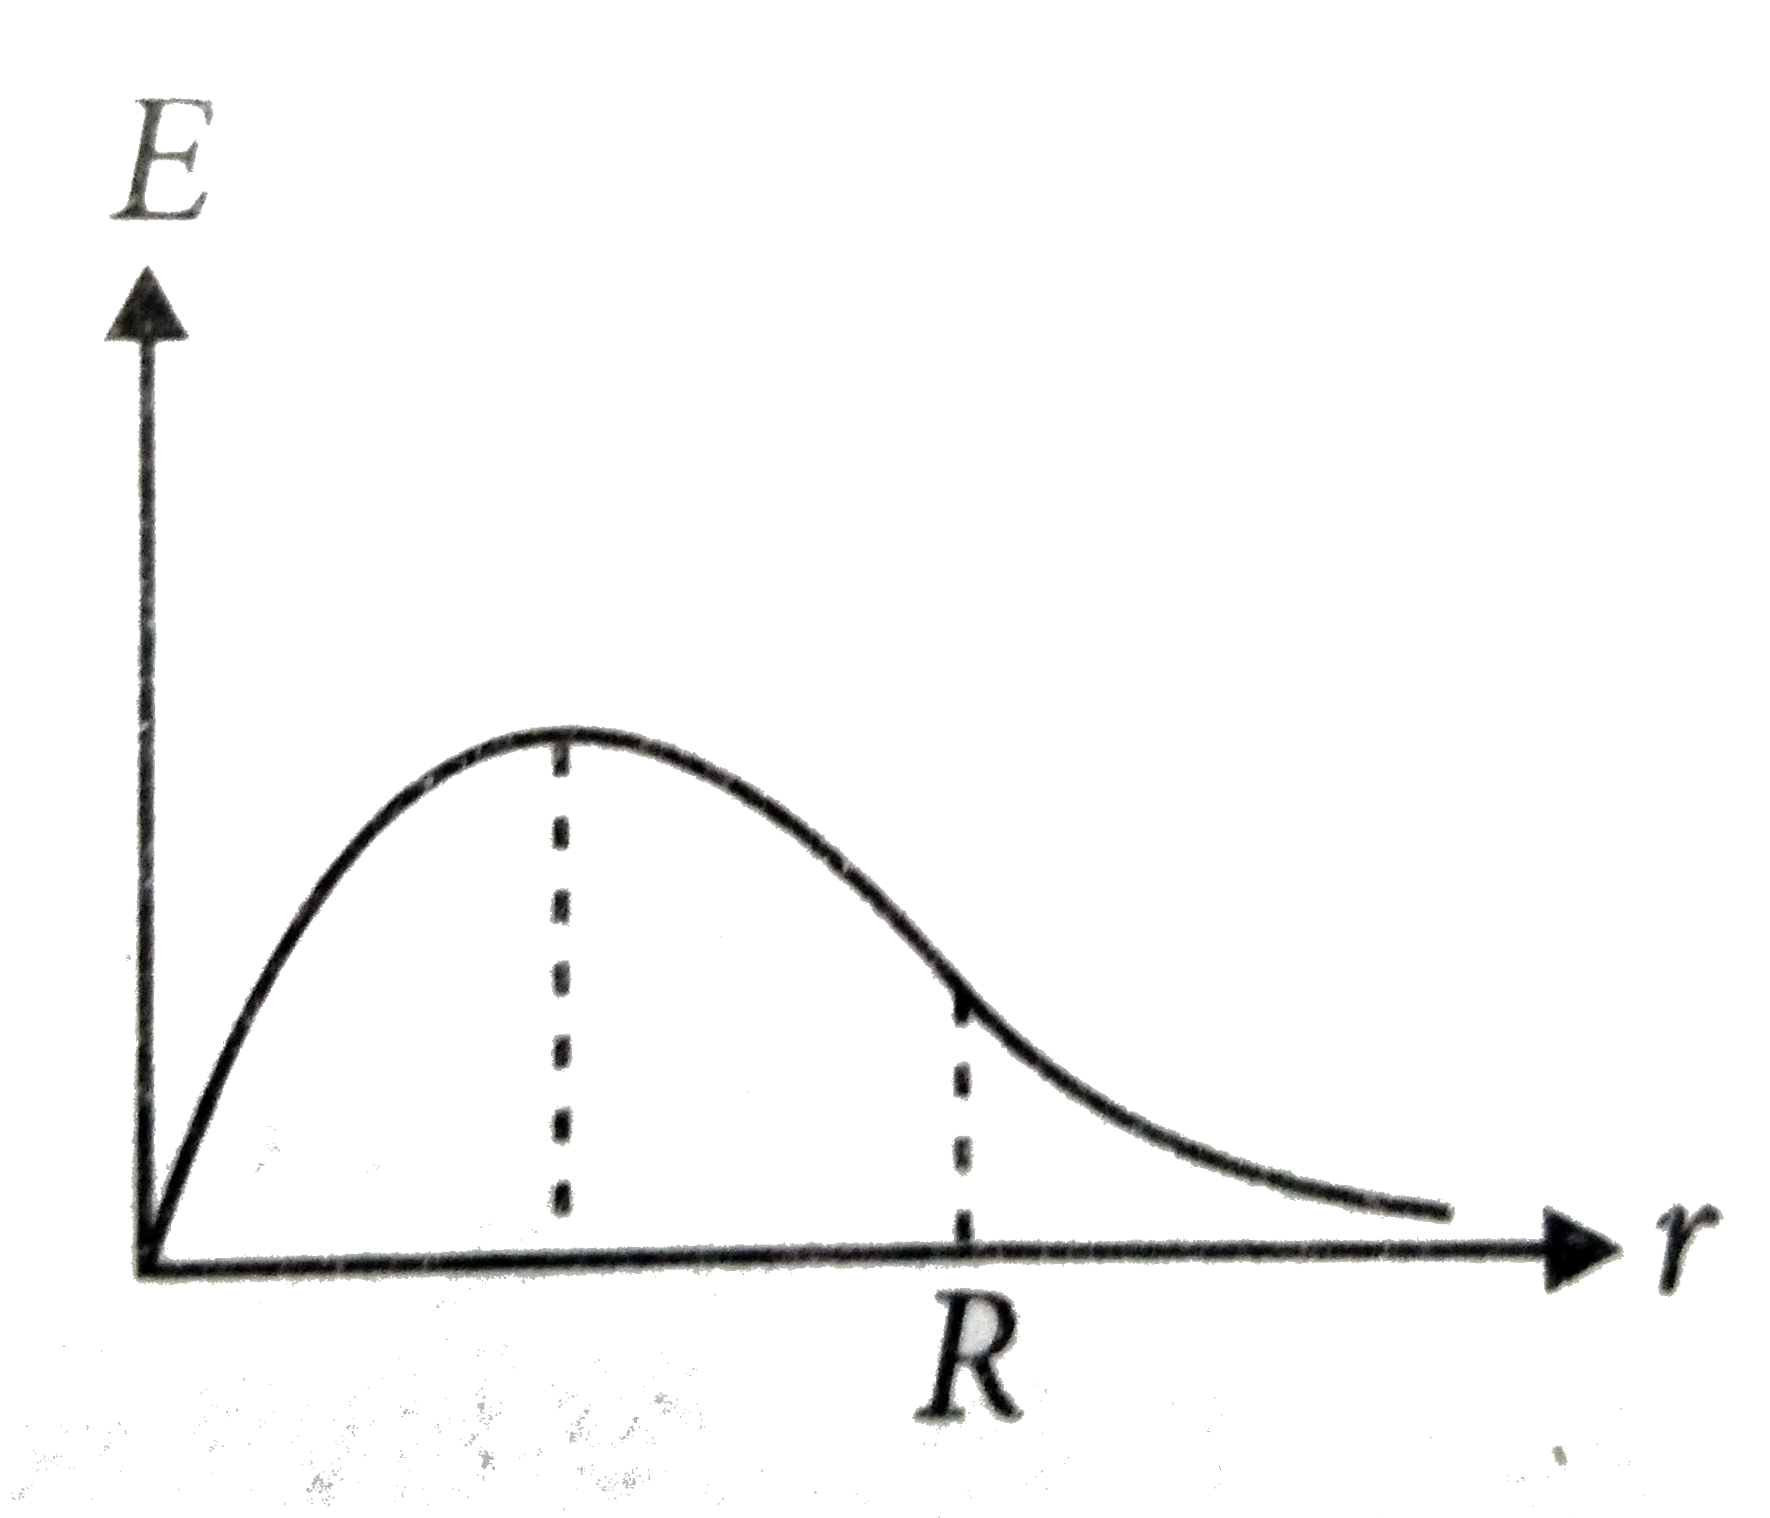
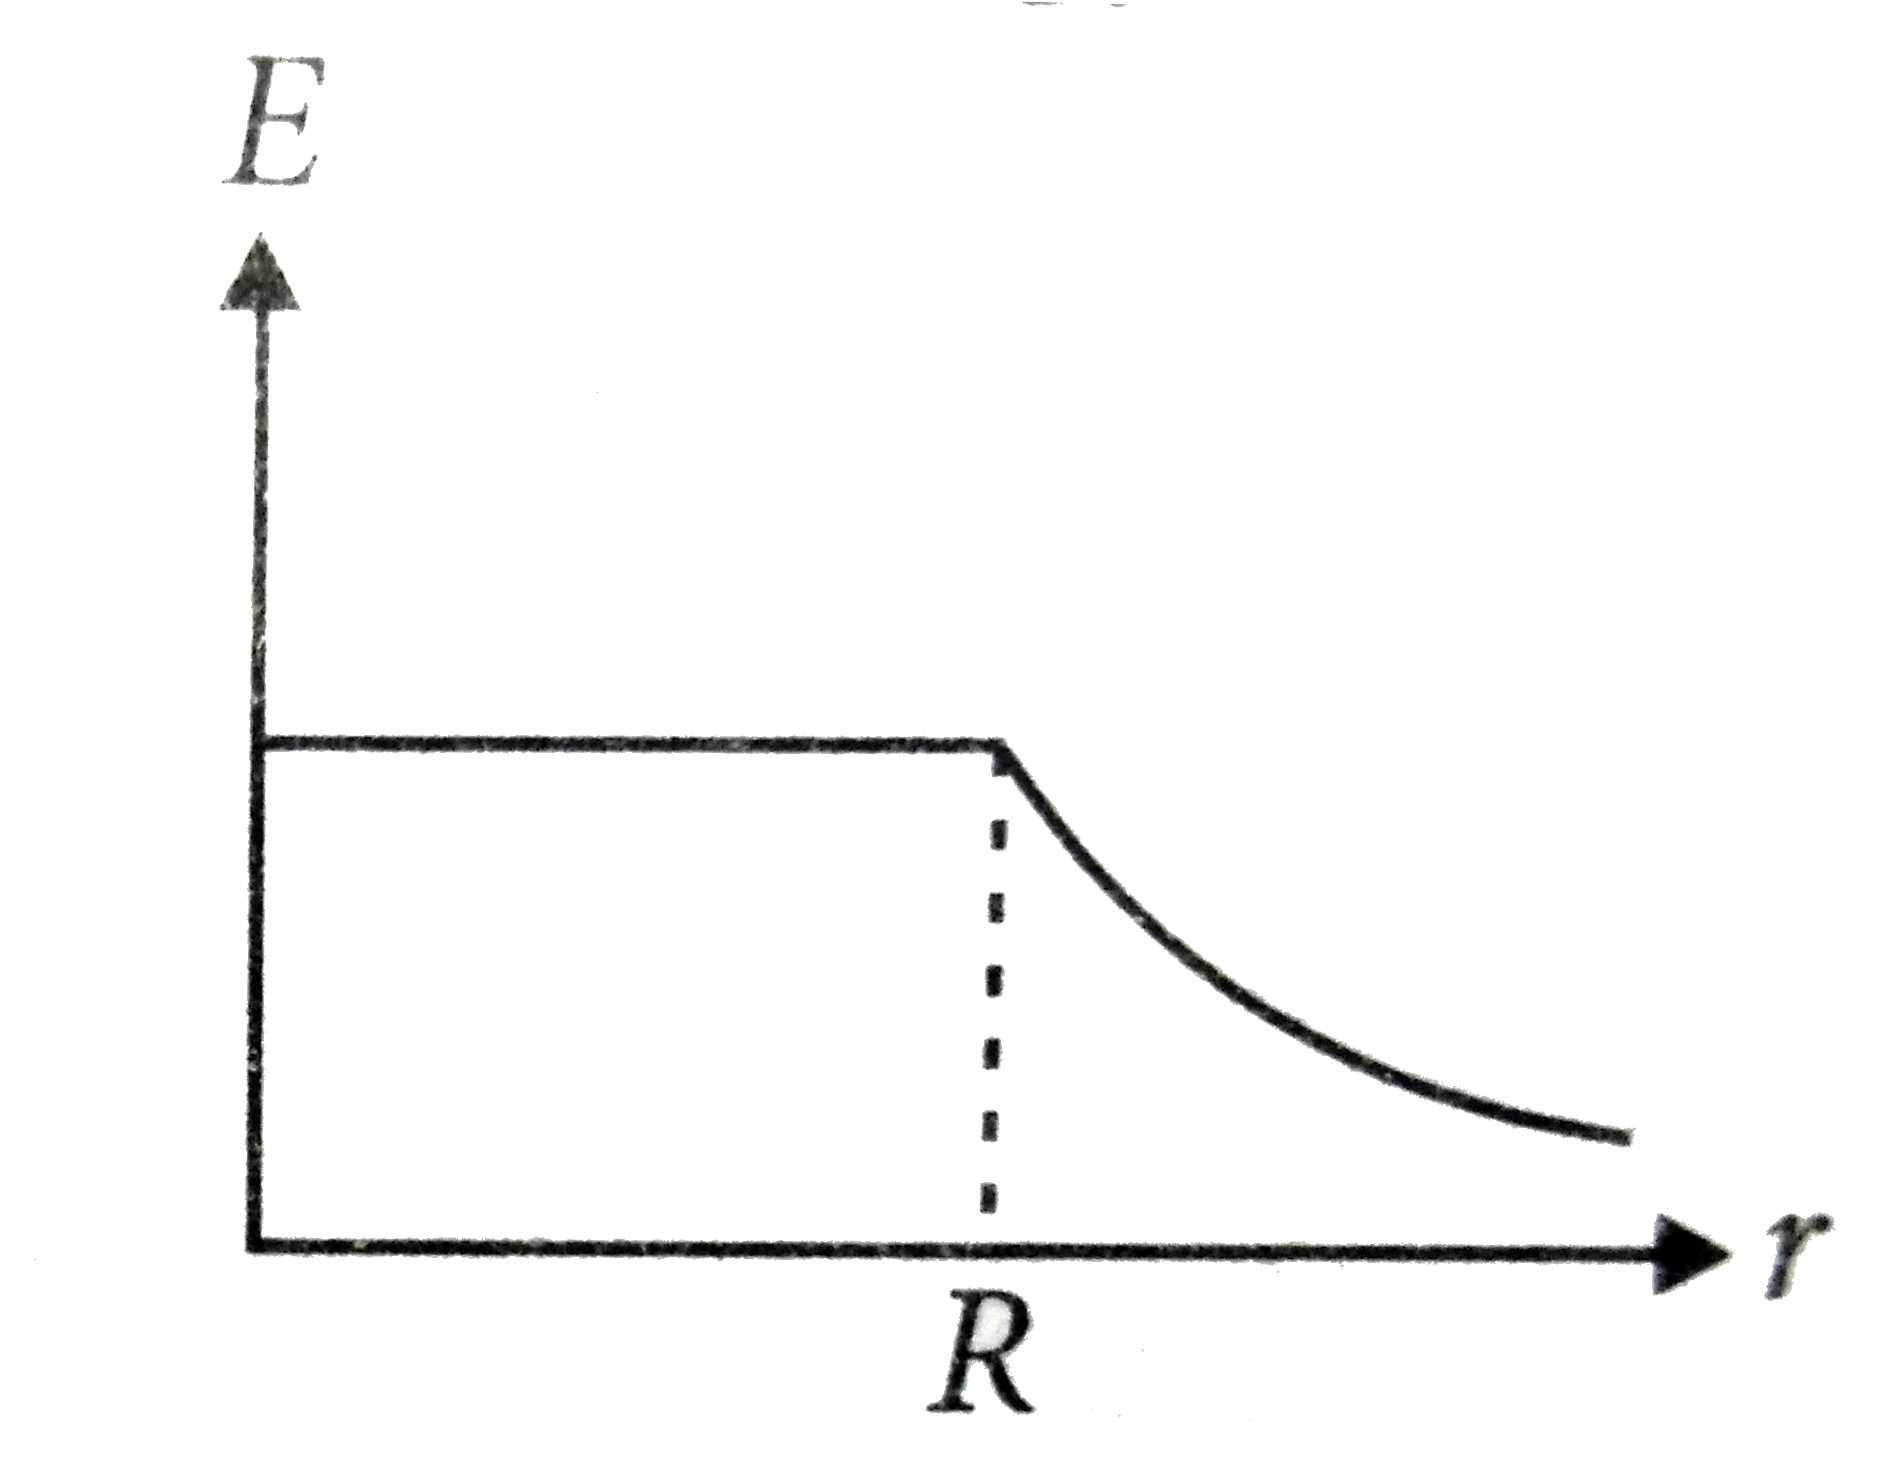
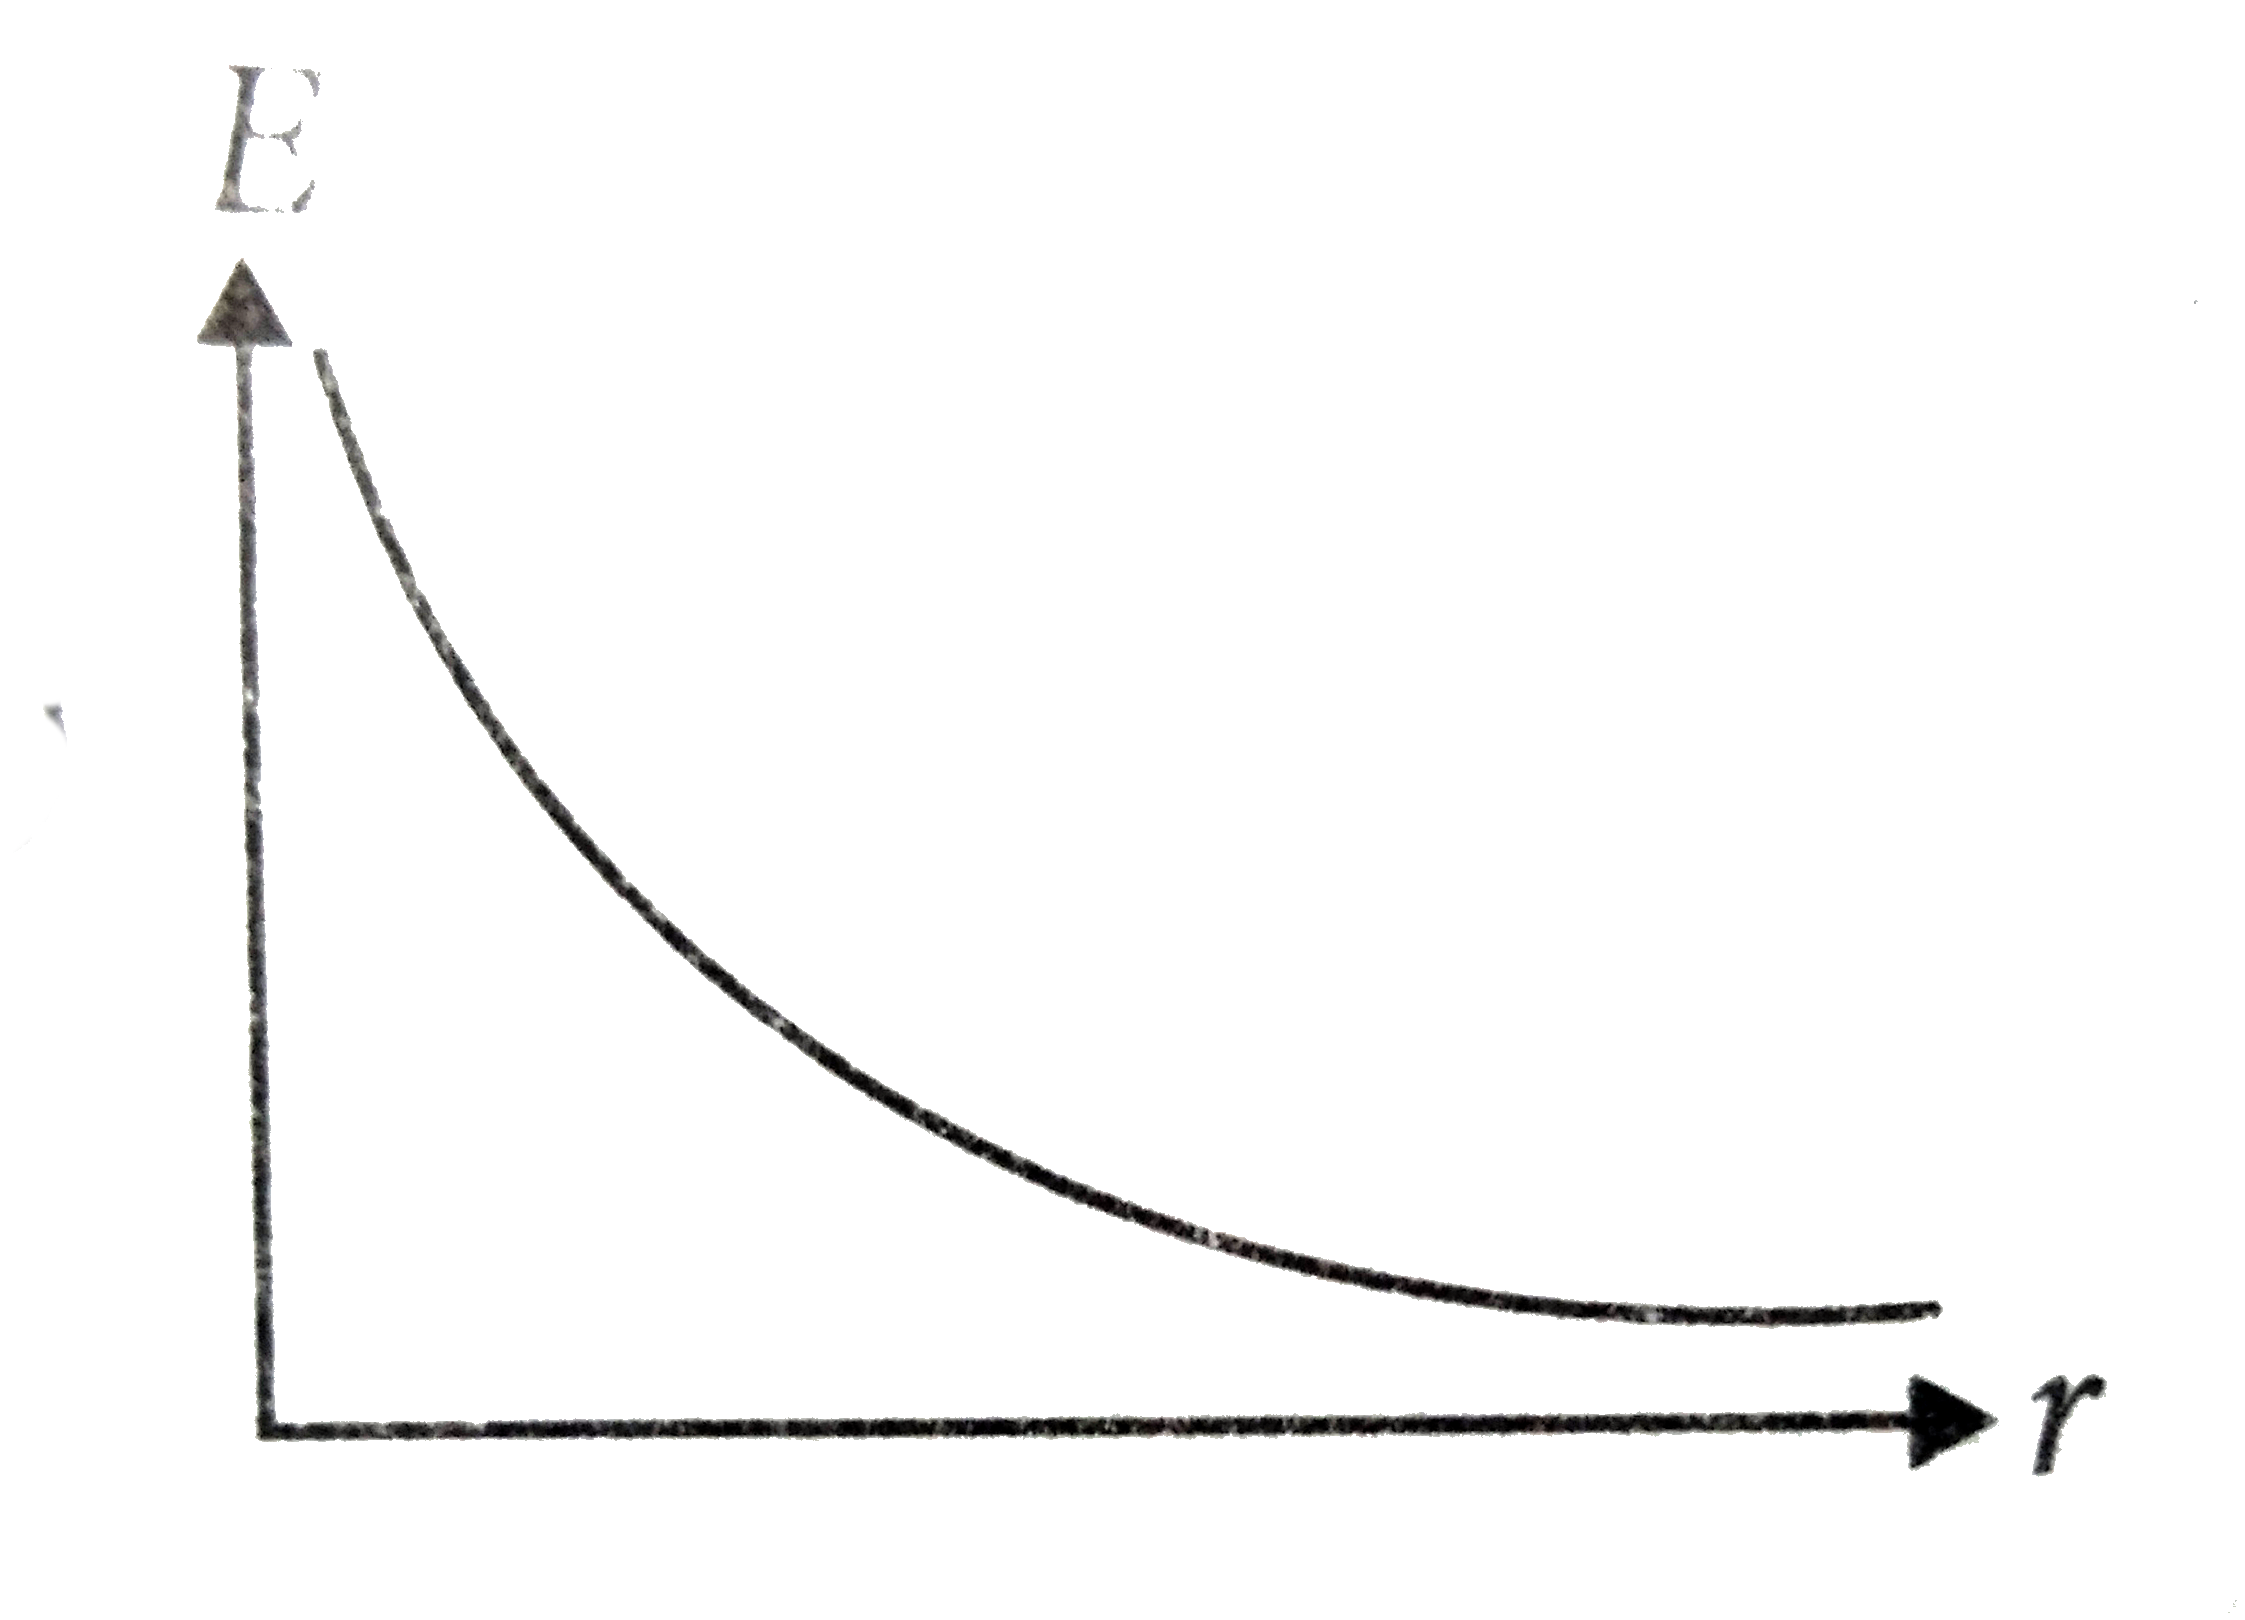
The correct Answer is:A
For (x<R),=Qx43πR33ε0+Q/164πε0x2
dEdx=0⇒Q4πε0=(1R3−216x3)=0
d2Edx2=6Q4πε0(16x4)>0
∴Atx=R2,E is minimum.
For (x>R),E=(Q+Q/16)4πε0x2
Topper's Solved these Questions
- ELECTRIC CHARGES AND FIELDSBOOK - NCERT FINGERTIPSCHAPTER - ELECTRIC CHARGES AND FIELDSEXERCISE - NCERT Exemplar
5 Videos
- ELECTRIC CHARGES AND FIELDSBOOK - NCERT FINGERTIPSCHAPTER - ELECTRIC CHARGES AND FIELDSEXERCISE - EXEMPLAR PROBLEMS
1 Videos
- ELECTRIC CHARGES AND FIELDSBOOK - NCERT FINGERTIPSCHAPTER - ELECTRIC CHARGES AND FIELDSEXERCISE - HOTS
1 Videos
- DUAL NATURE OF RADIATION AND MATTER BOOK - NCERT FINGERTIPSCHAPTER - DUAL NATURE OF RADIATION AND MATTER EXERCISE - Assertion And Reason
15 Videos
- ELECTROMAGNETIC INDUCTIONBOOK - NCERT FINGERTIPSCHAPTER - ELECTROMAGNETIC INDUCTIONEXERCISE - Assertion And Reason
15 Videos
Similar Questions
Which one of the following graphs represents the variation of electric field with distance r from the centre of a charged spherical conductor of radius R?
View SolutionWhich one of the following graphs represents the variation of electric field with distance r from the centre of a charged spherical conductor of radius R?
View Solution
Knowledge Check
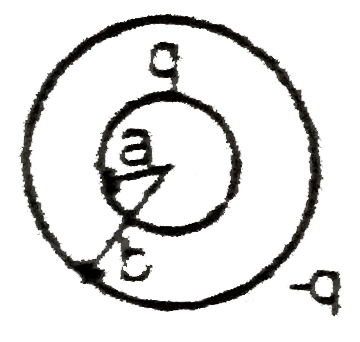
Figure shows two concentric shells of radii a and b uniformly distributed charges q and -q. Which of the following graphs gives correct variation of electric field intensity E with the distance r from the centre?
 A
A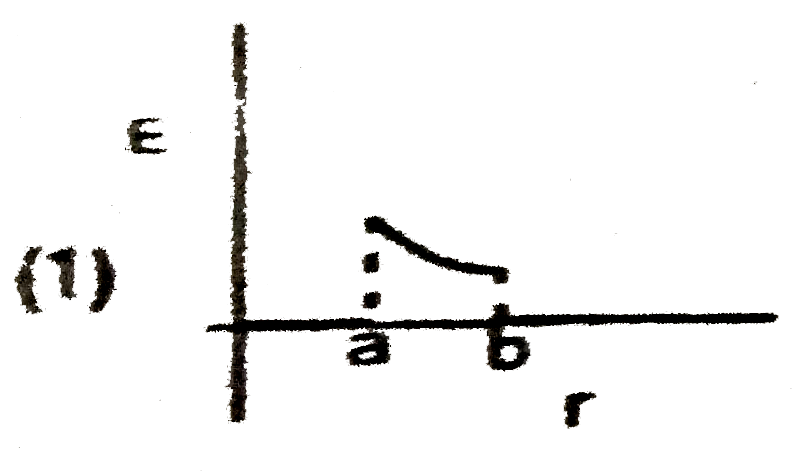 B
B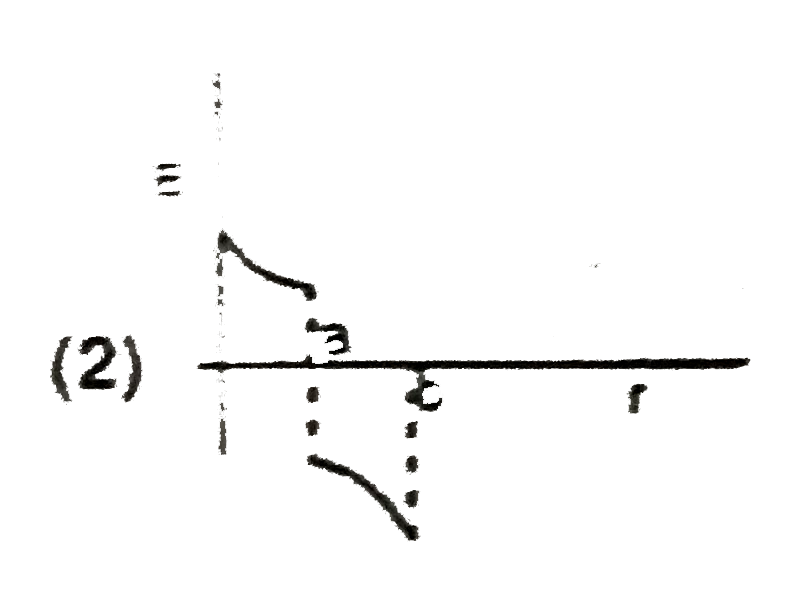 C
C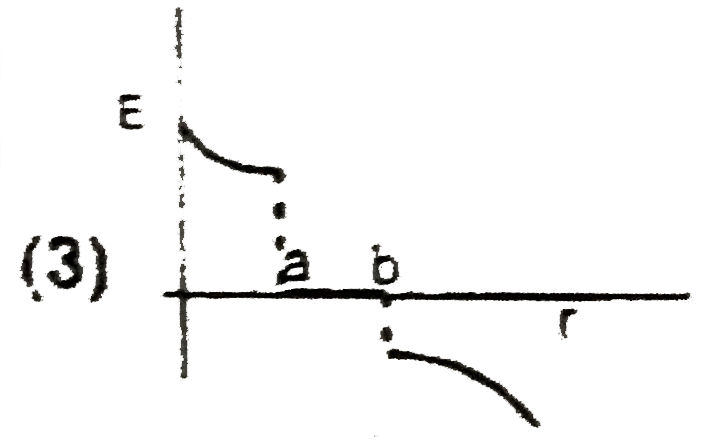 D
D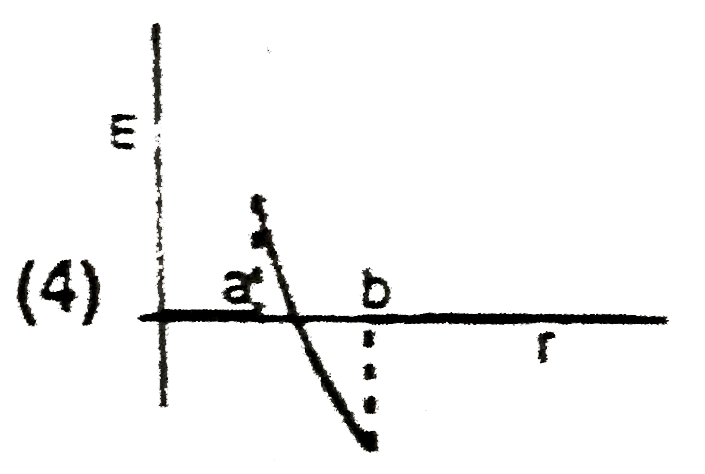
A metallic spherical shell of radius R has a charge -Q on it. A point charge +Q is placed at the centre of the shell. Which of the graphs shown below may correctly represent the variation of electric field E with distance r from the centre of shell ?
A B
B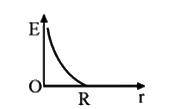 C
C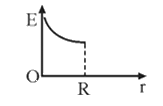 D
D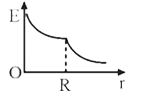
Which one of the following graphs represents the variation of electric field with distance r from the centre of a charged spherical conductor of radius R?
A B
B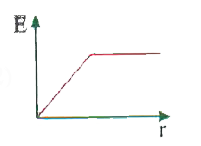 C
C D
D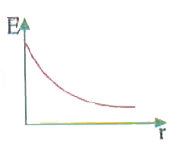
Figure shows two concentric shells of radii a and b uniformly distributed charges q and -q. Which of the following graphs gives correct variation of electric field intensity E with the distance r from the centre?

View SolutionA metallic spherical shell of radius R has a charge -Q on it. A point charge +Q is placed at the centre of the shell. Which of the graphs shown below may correctly represent the variation of electric field E with distance r from the centre of shell ?
View SolutionFor a uniformly charged non conducting sphere of radius R which of following shows a correct graph between the electric field intensity and the distance from the centre of sphere –
View SolutionFor a uniformly charged non conducting sphere of radius R which of following shows a correct graph between the electric field intensity and the distance from the centre of sphere –
View SolutionA sphere of radius R, is charged uniformly with total charge Q. Then correct statement for electric field is (r = distance from centre): -
View Solution
