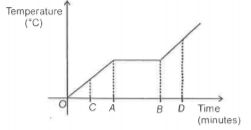
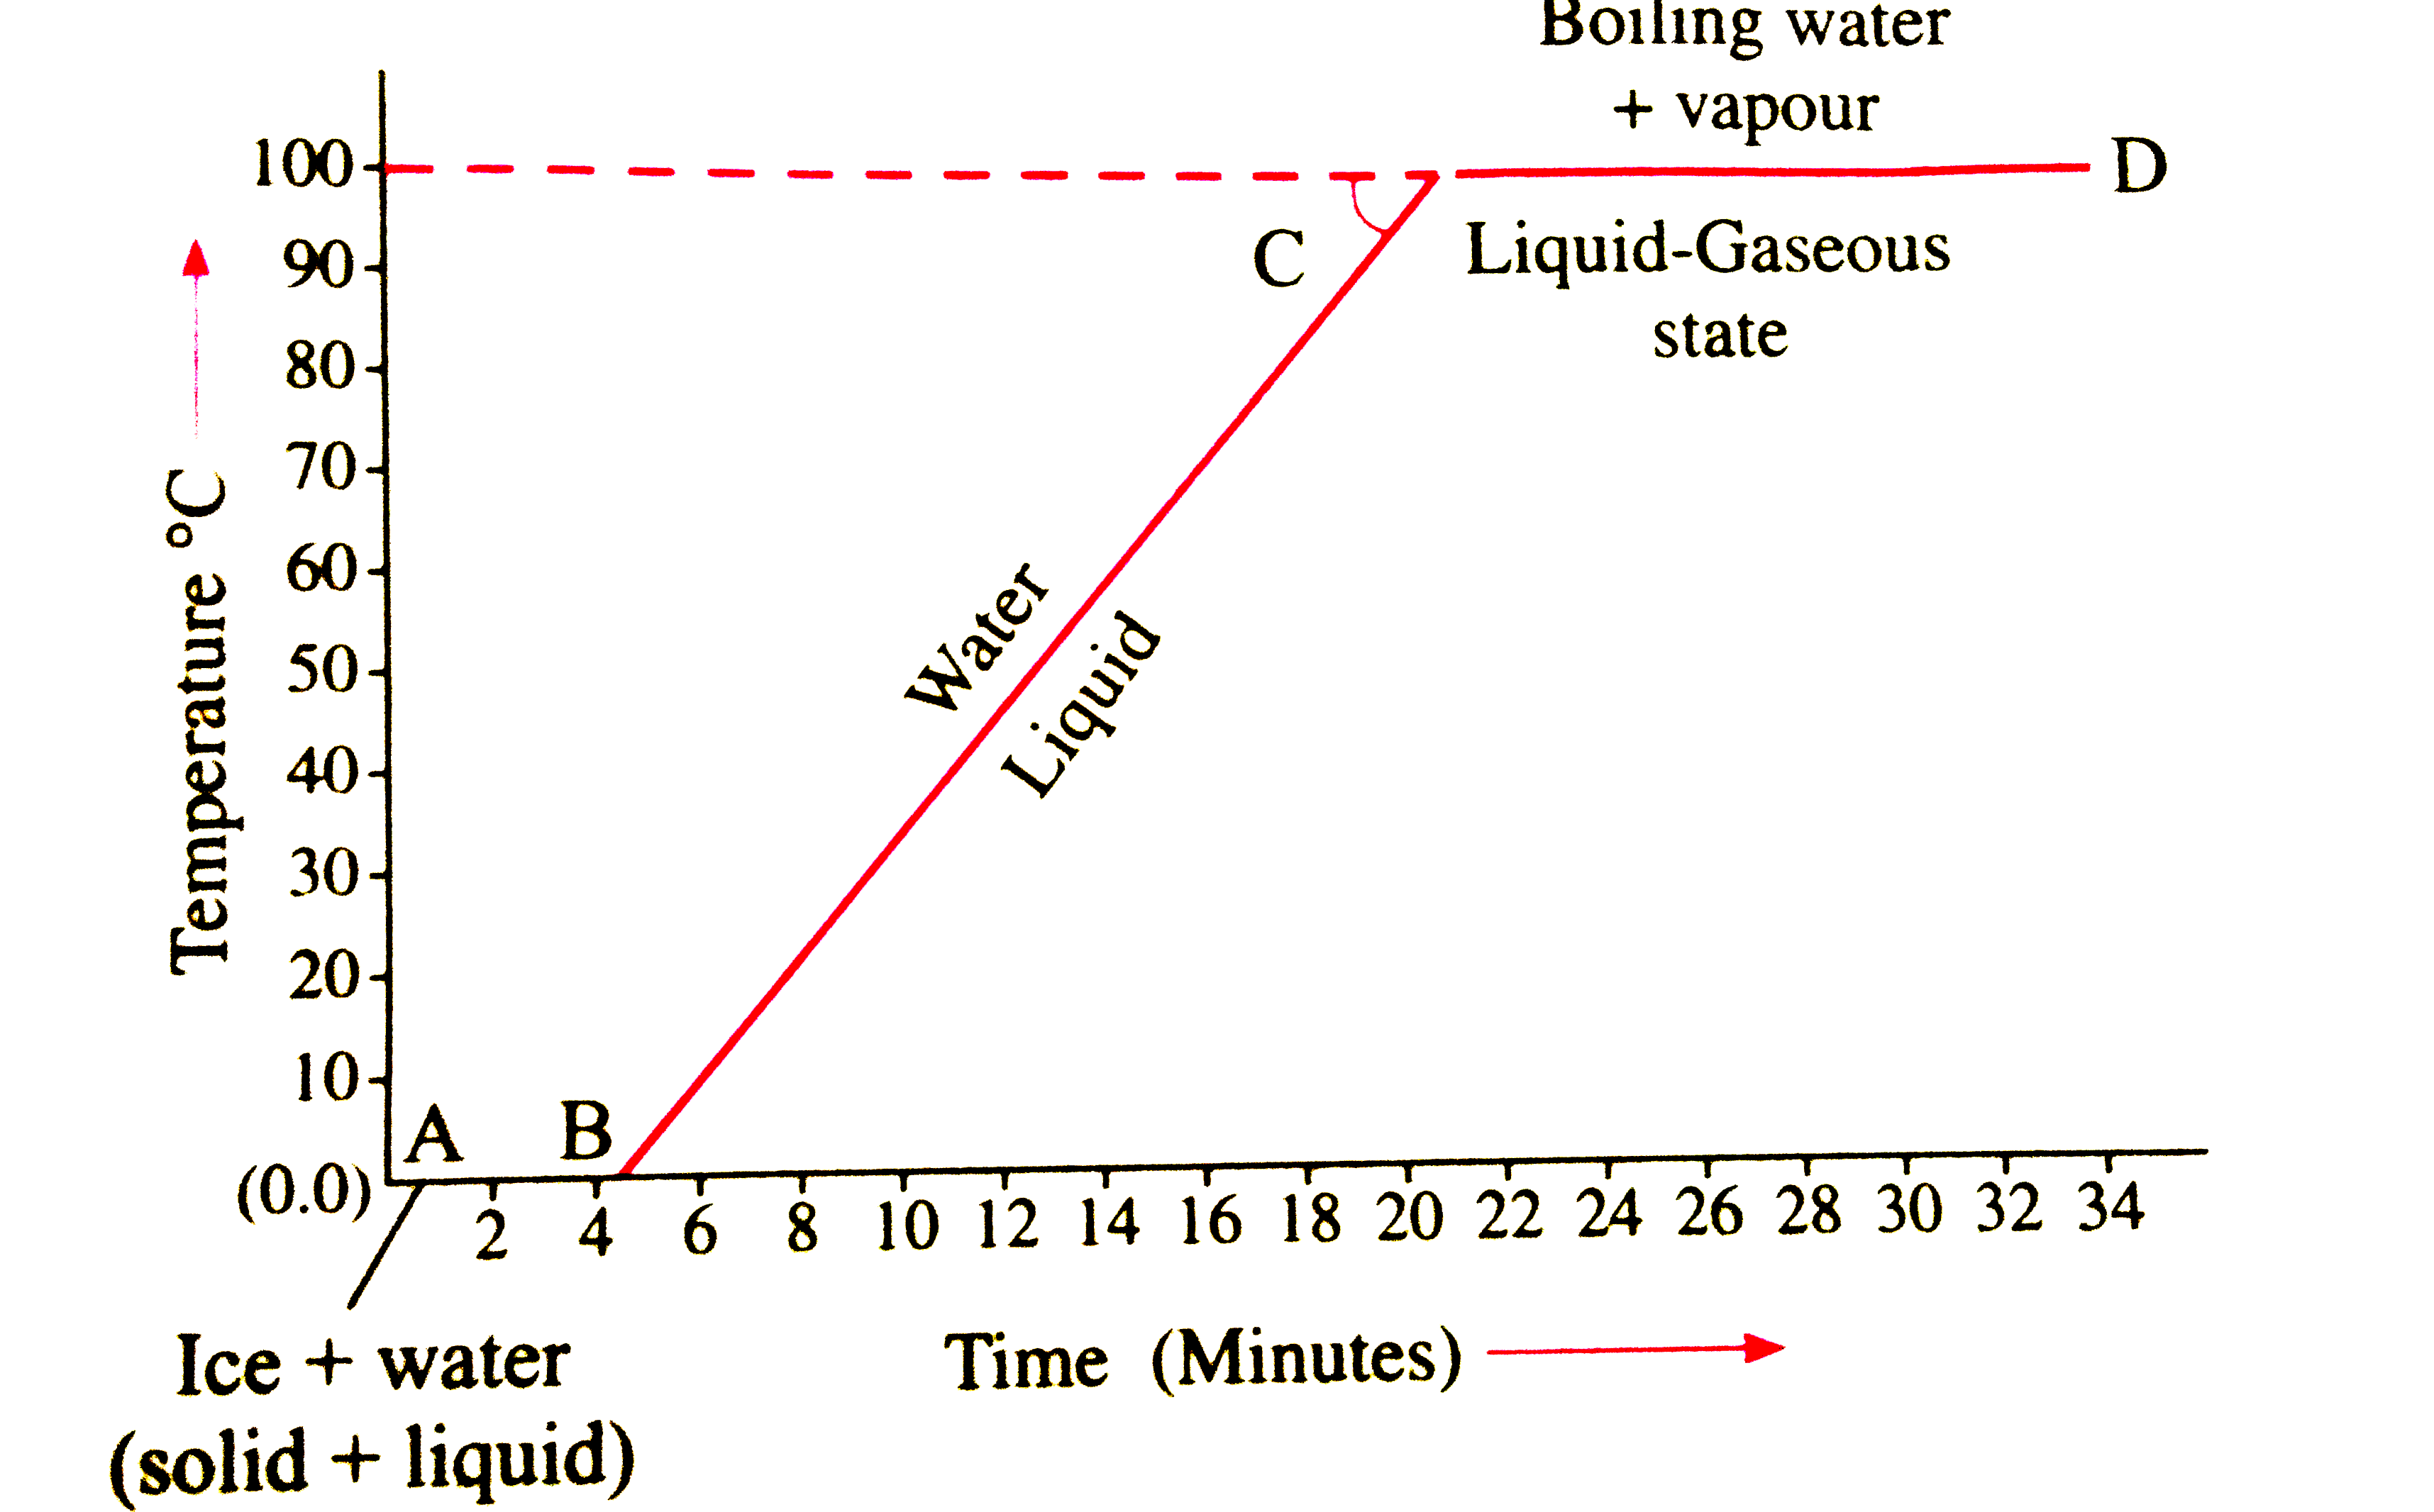
Following are the temperature - time graphs obtained by 4 students in this experiment which one is likely to be correct ?
A

B

C

D

Text Solution
The correct Answer is:D
|
Topper's Solved these Questions
Similar Questions
Knowledge Check
The temperature-time graphs obtained in Newton's cooling experiment is
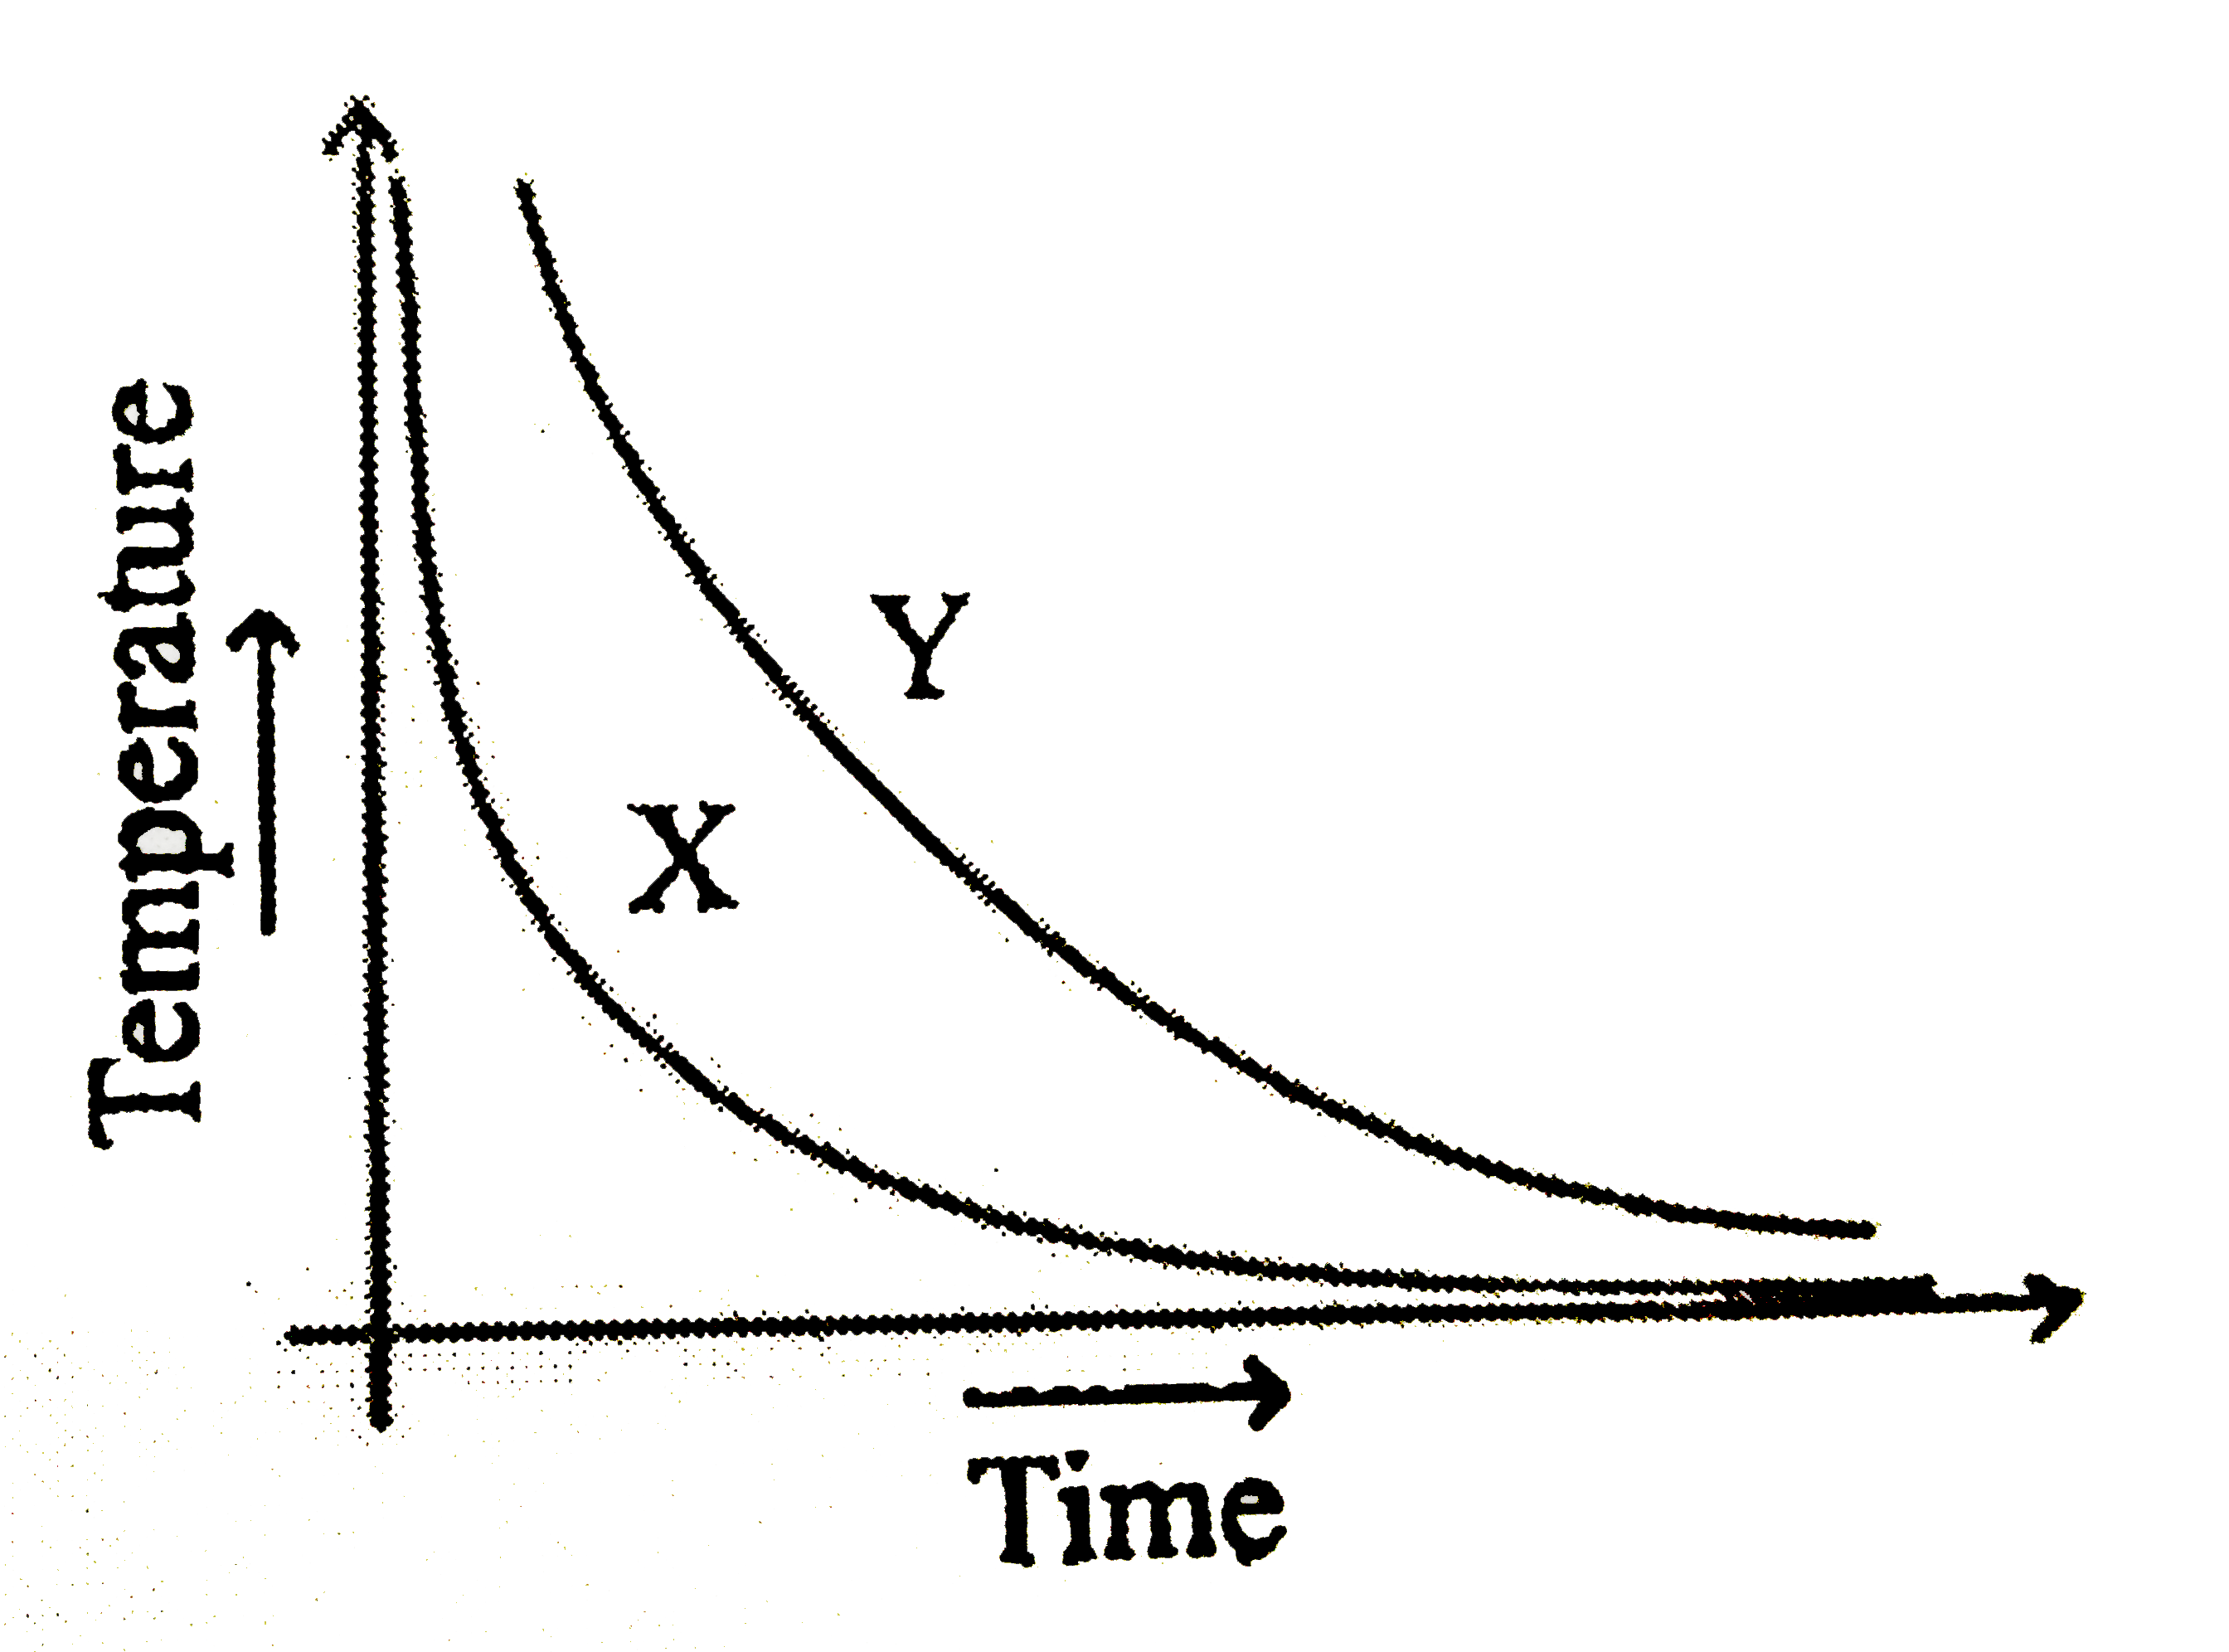
Aa straight line with positive slopeBa straight line with negative slopeCa curve with positive slopeDa curve with negativeTwo students X and Y have to do their experiment on plotting the temperature-time graph for a hot body as it cools to room temperature. They do their experiments in the same lab, using completely identical apparatus, take equal amounts of tap water heated up to the same temperature, start their observations simultaneously and note the temperature values at identically spaced intervals of time. Their temperature-time graphs, plotted on a given graph paper, with the same given choices of scales along the axis, are however, as shown: The following could be the reason for this difference:
(A) Use of an overhead fan by student X.
(B) Use of an overhead fan by student Y.
(C) Less frequent stirring of water by student X.
(D) Less frequent stirring of water by student Y.
The most likely reason is:
 AABBCCDD
Which one of the following pair is least likely to be a correct match?
AChildren enter in the world with certain knowledge about language- ChomskyBLanguage and thought are initially two different activities - VygotskyCLanguage is contingent on thought- PiagetDLanguage is a stimuli in environment - BF Skinner
Which one of the following pair is least likely to be a correct match?
View SolutionFor the following temperature-time graph, in which region the state of material changes

View SolutionWhich one of the following pairs is least likely to be a correct match?
View SolutionWhich of the following graph is correct?
View SolutionWhich of the following graph is correct
View Solution

