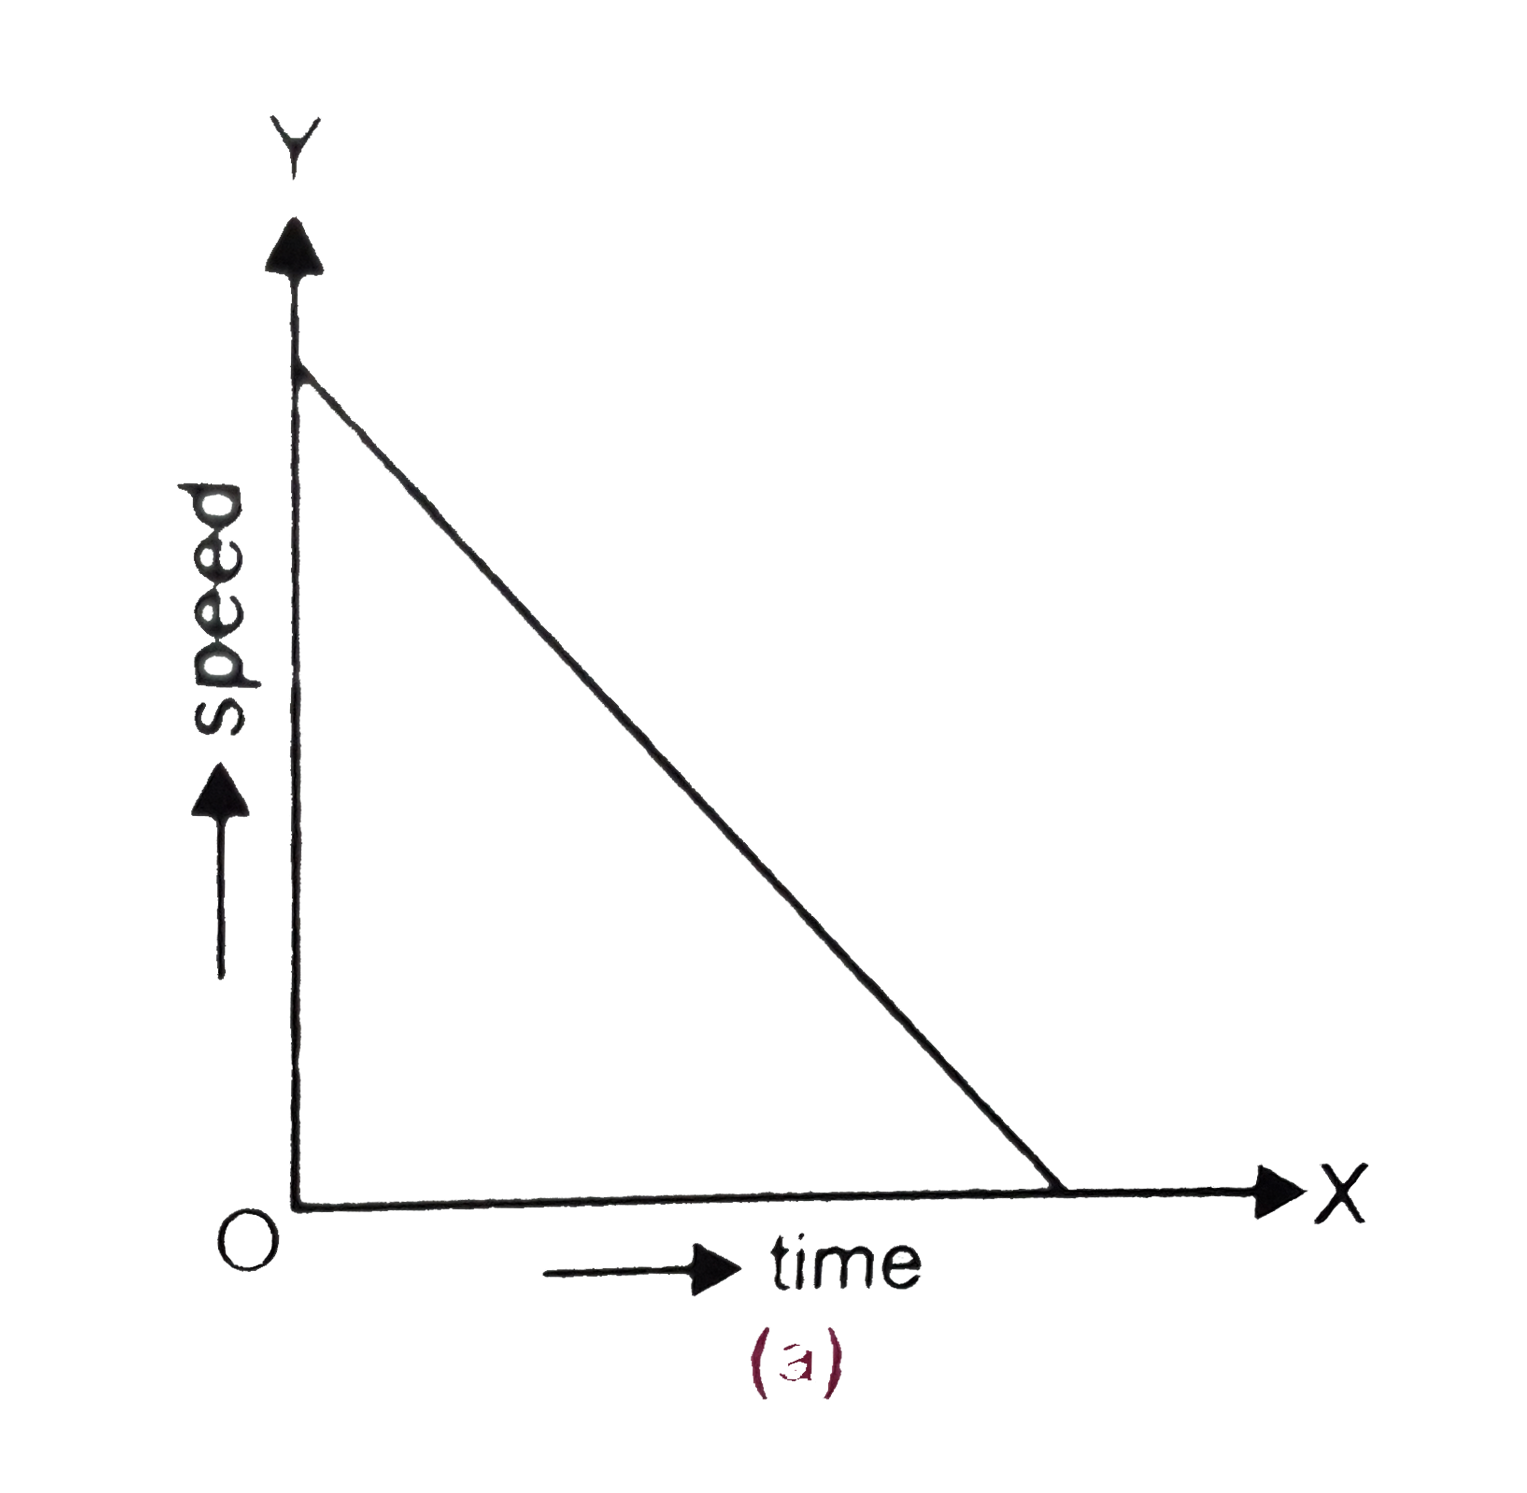
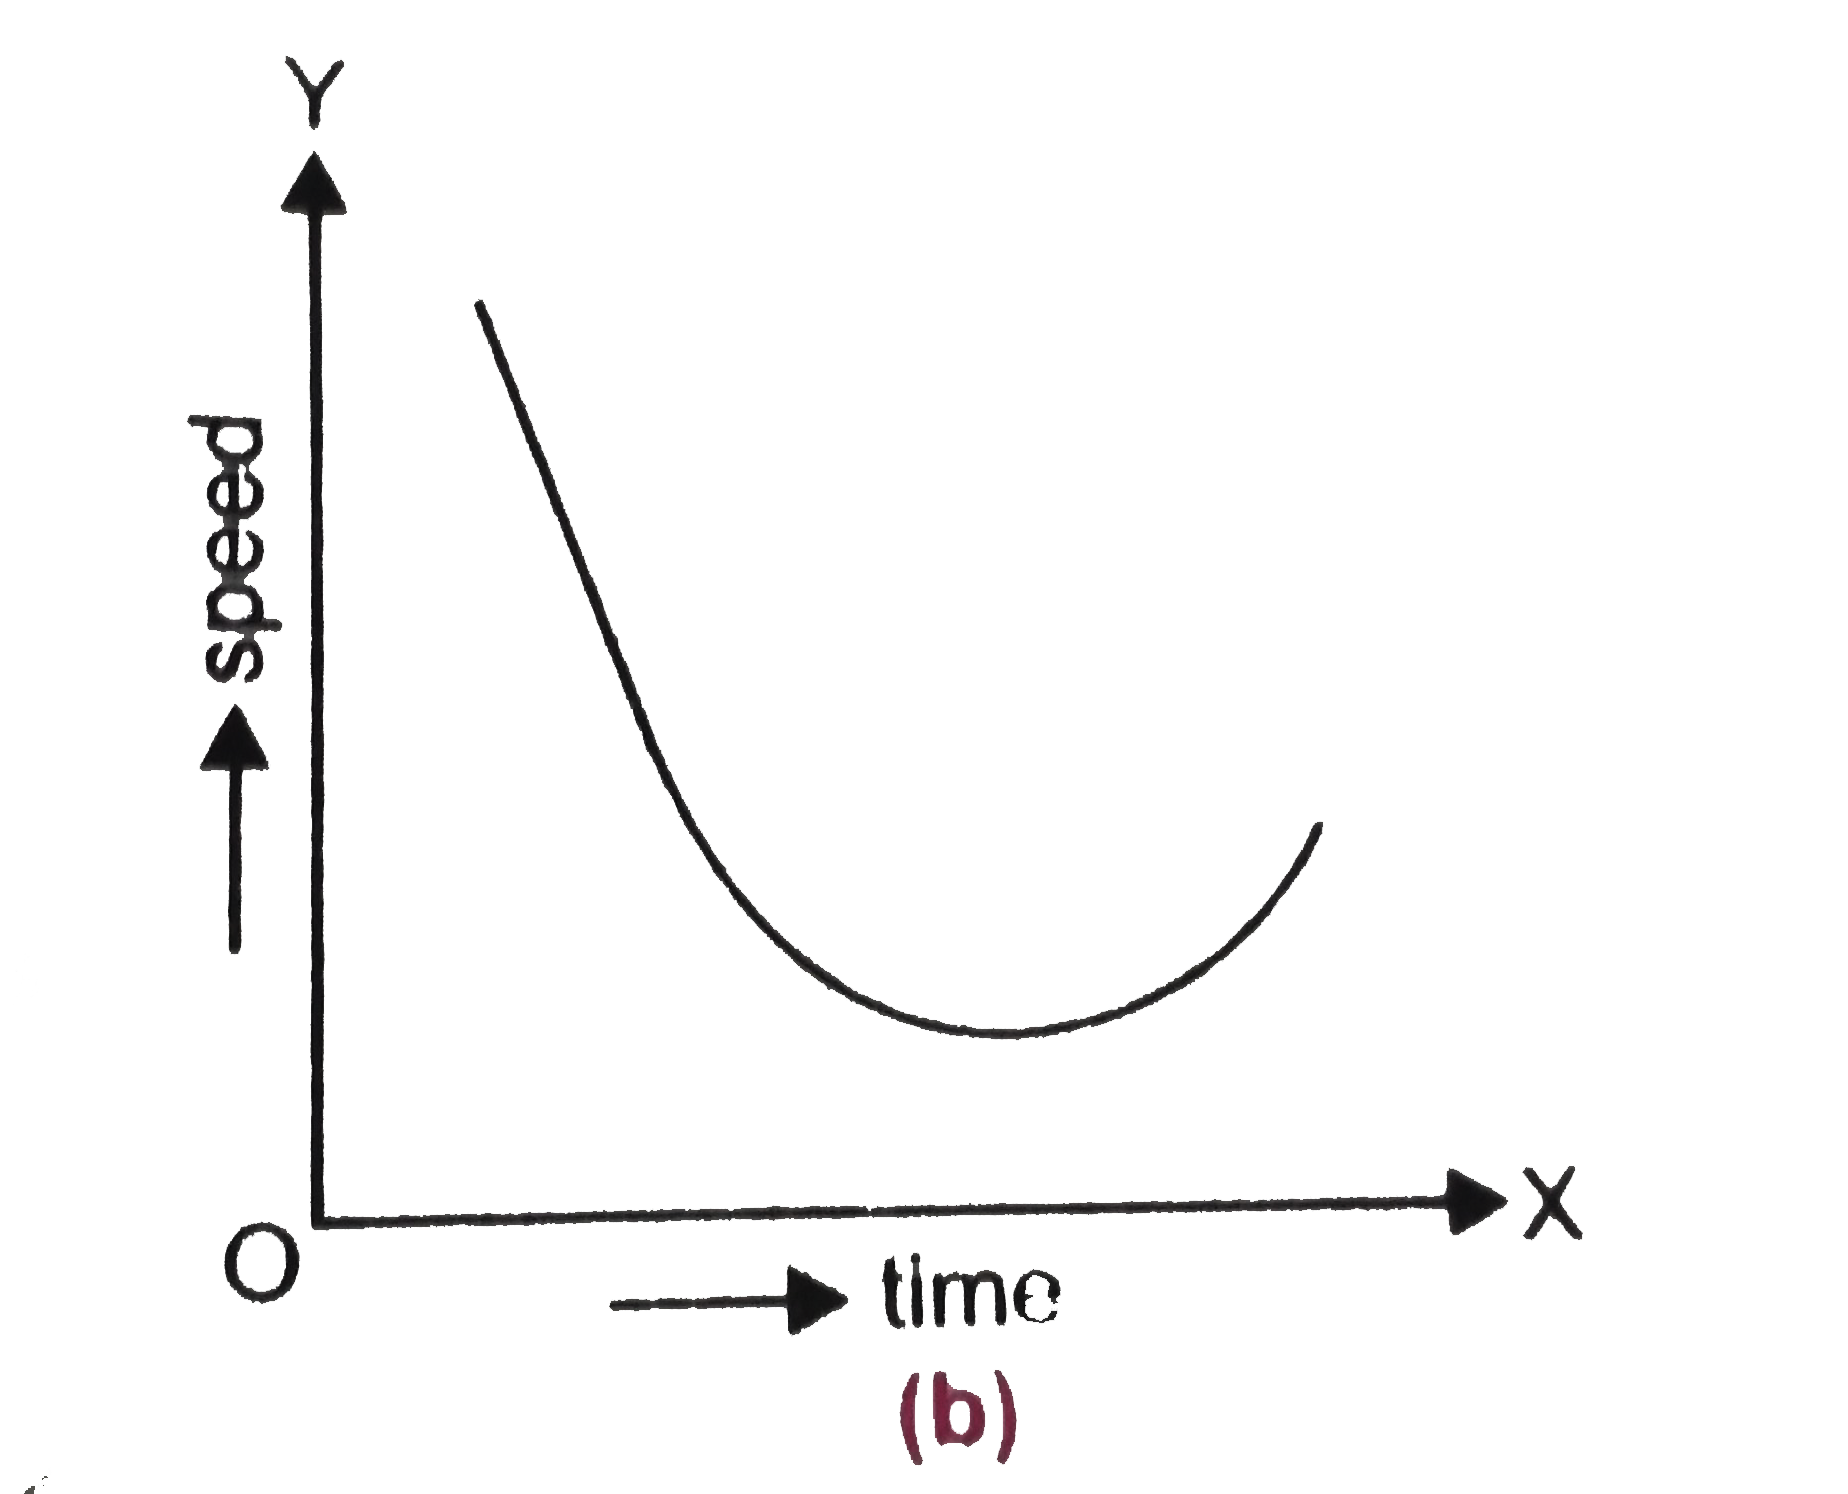
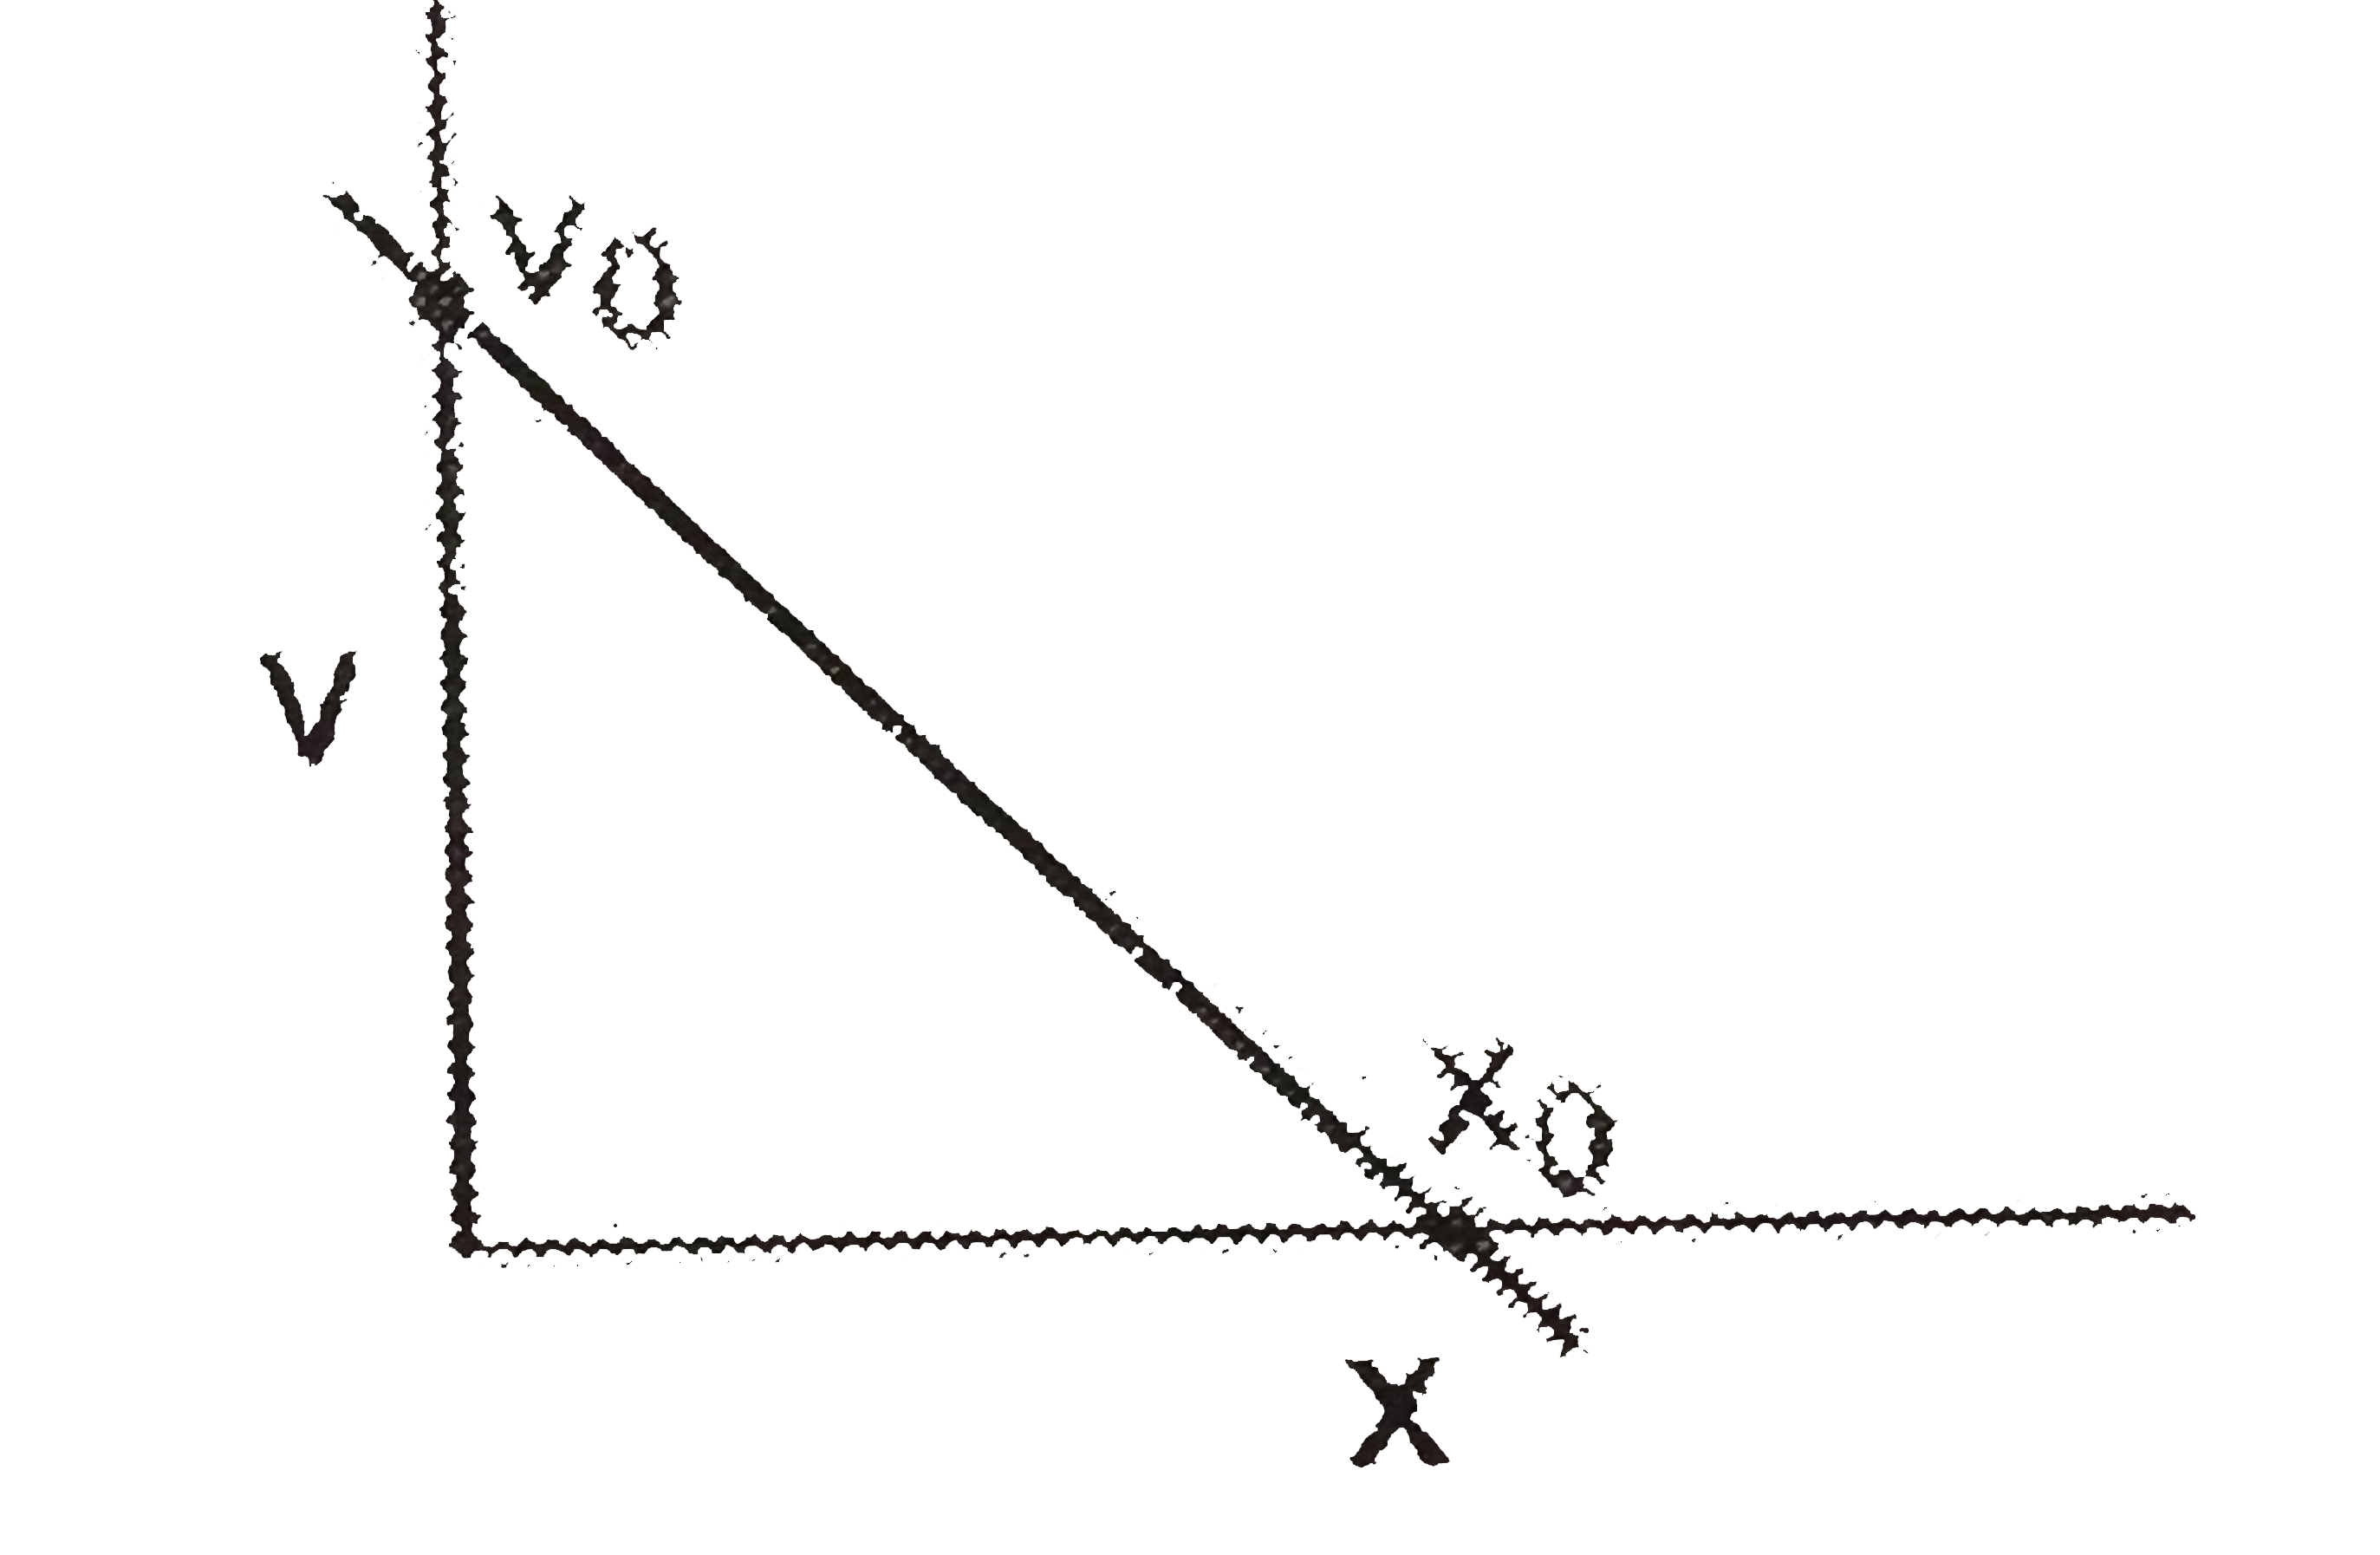
What will be the (a) ve (x) graph for the graph shown in Fig. 2 (CF). 18
 .
.
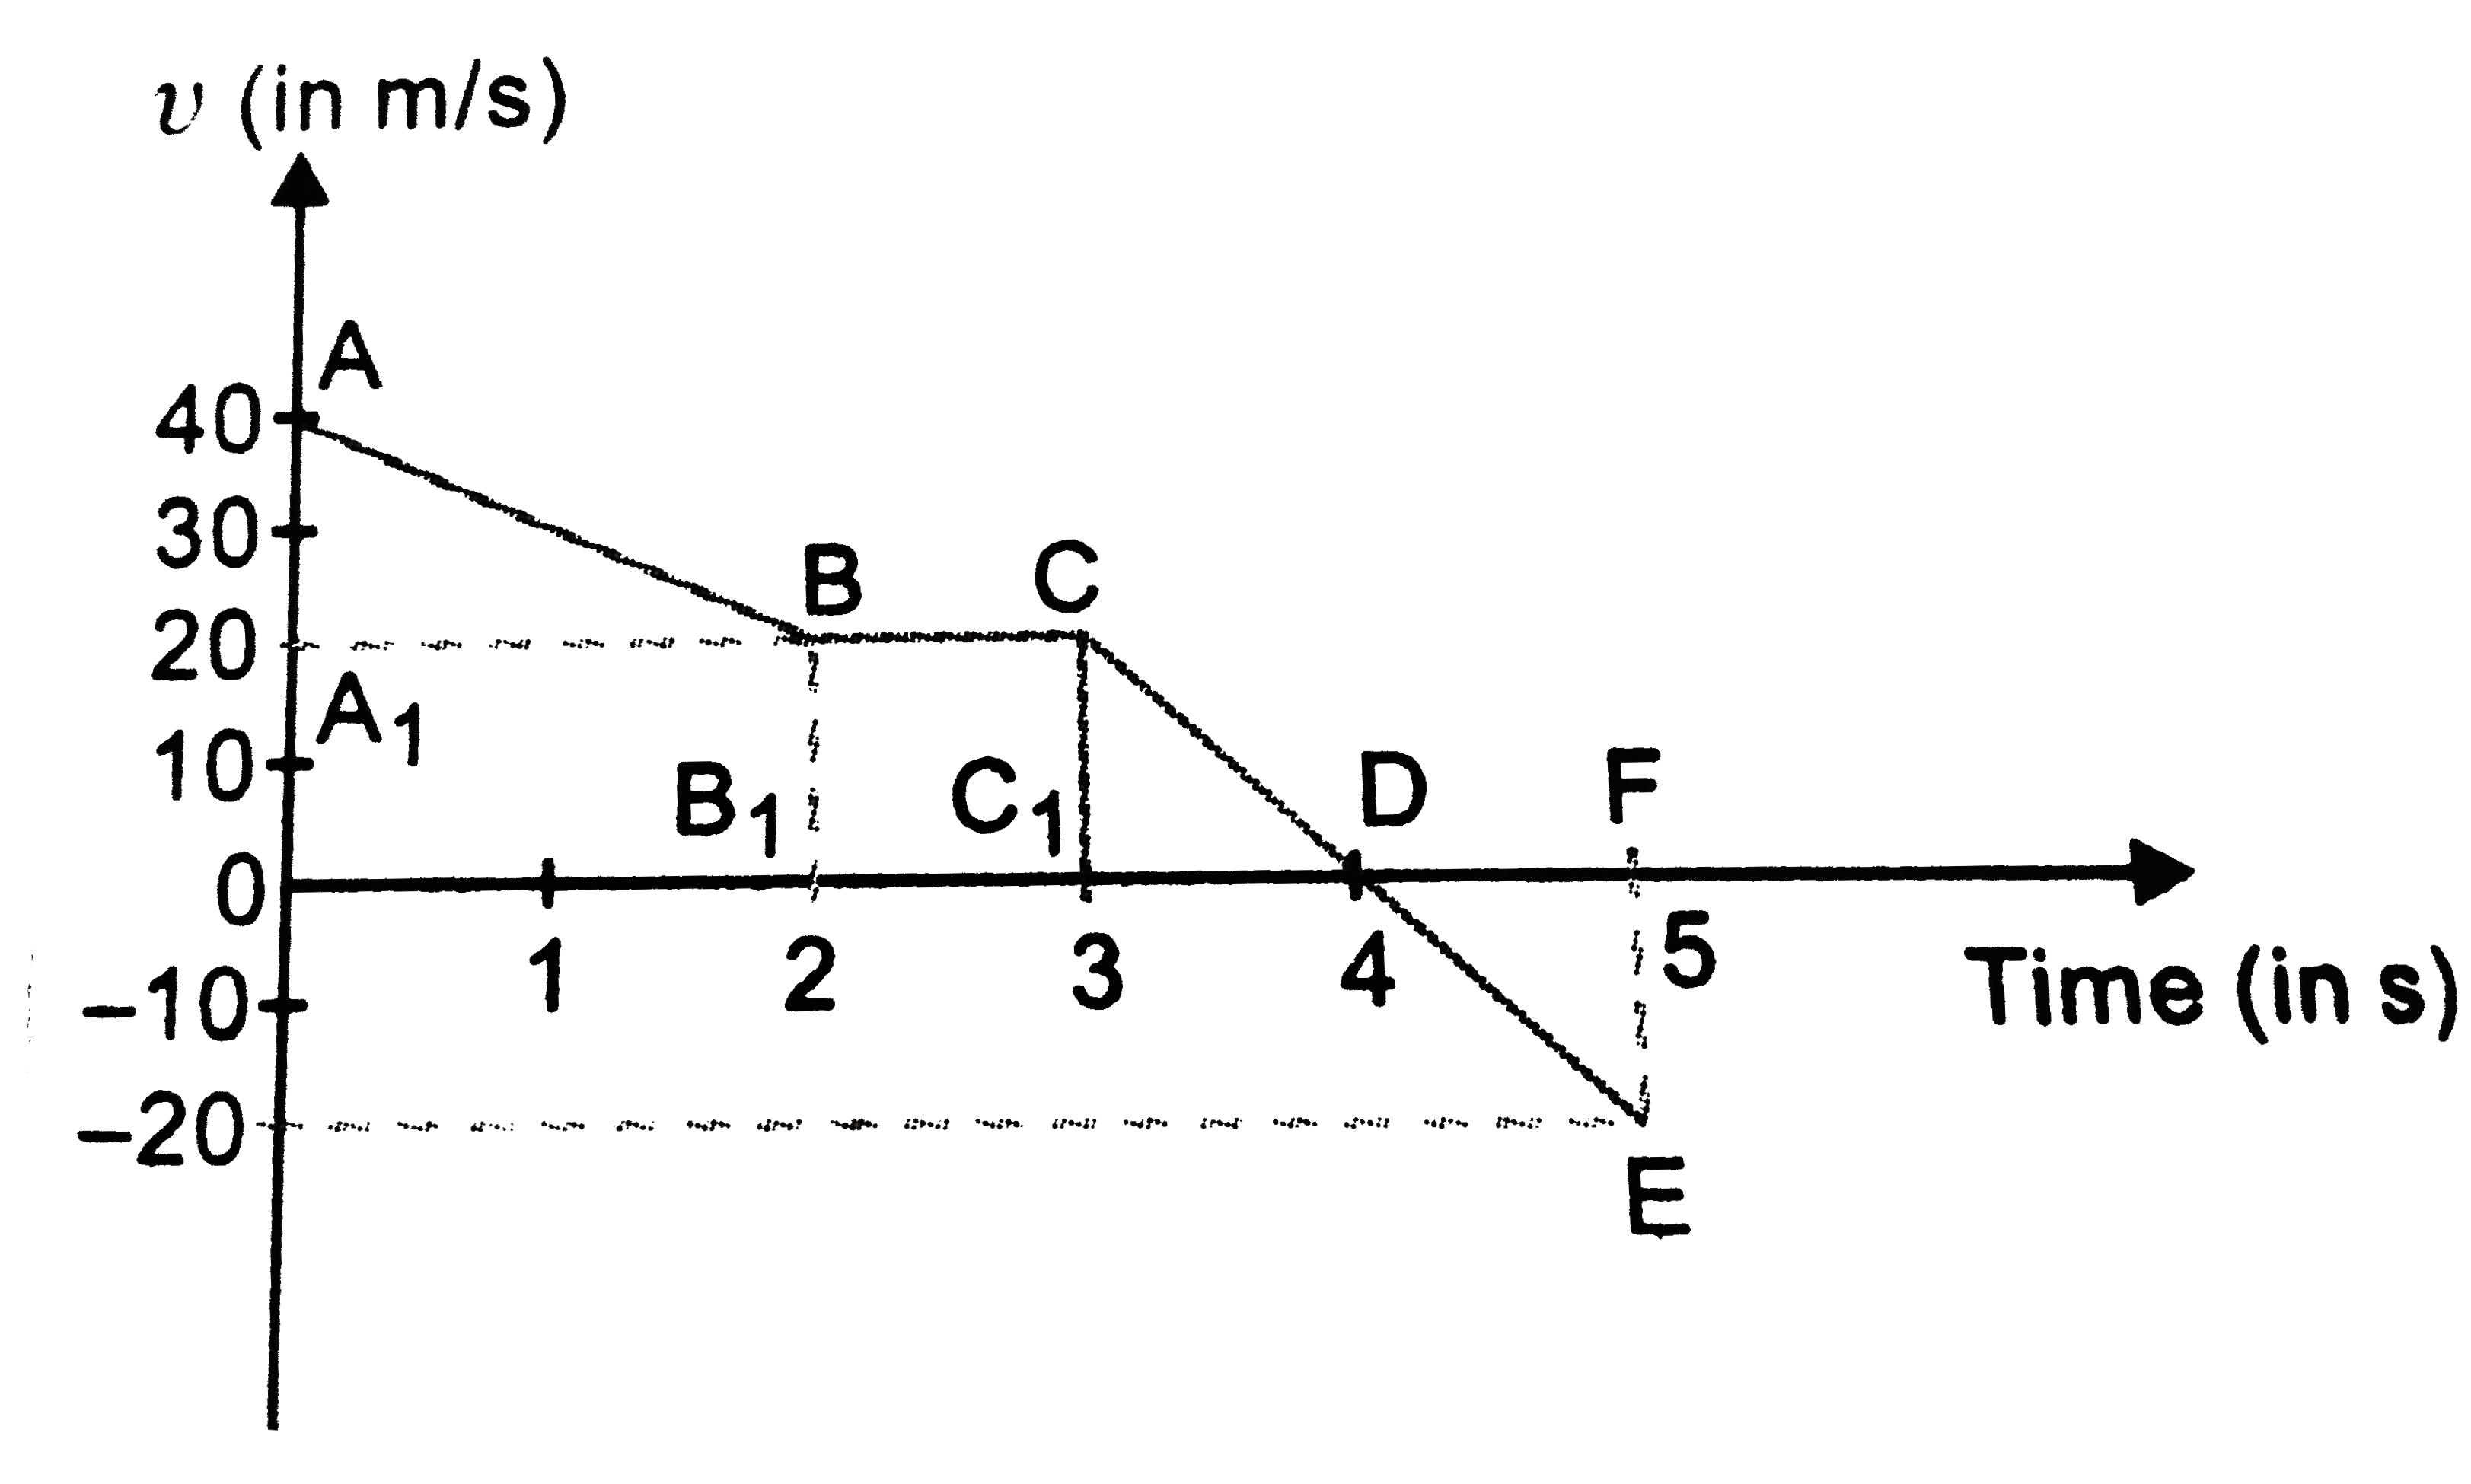
80 m
The correct Answer is:D
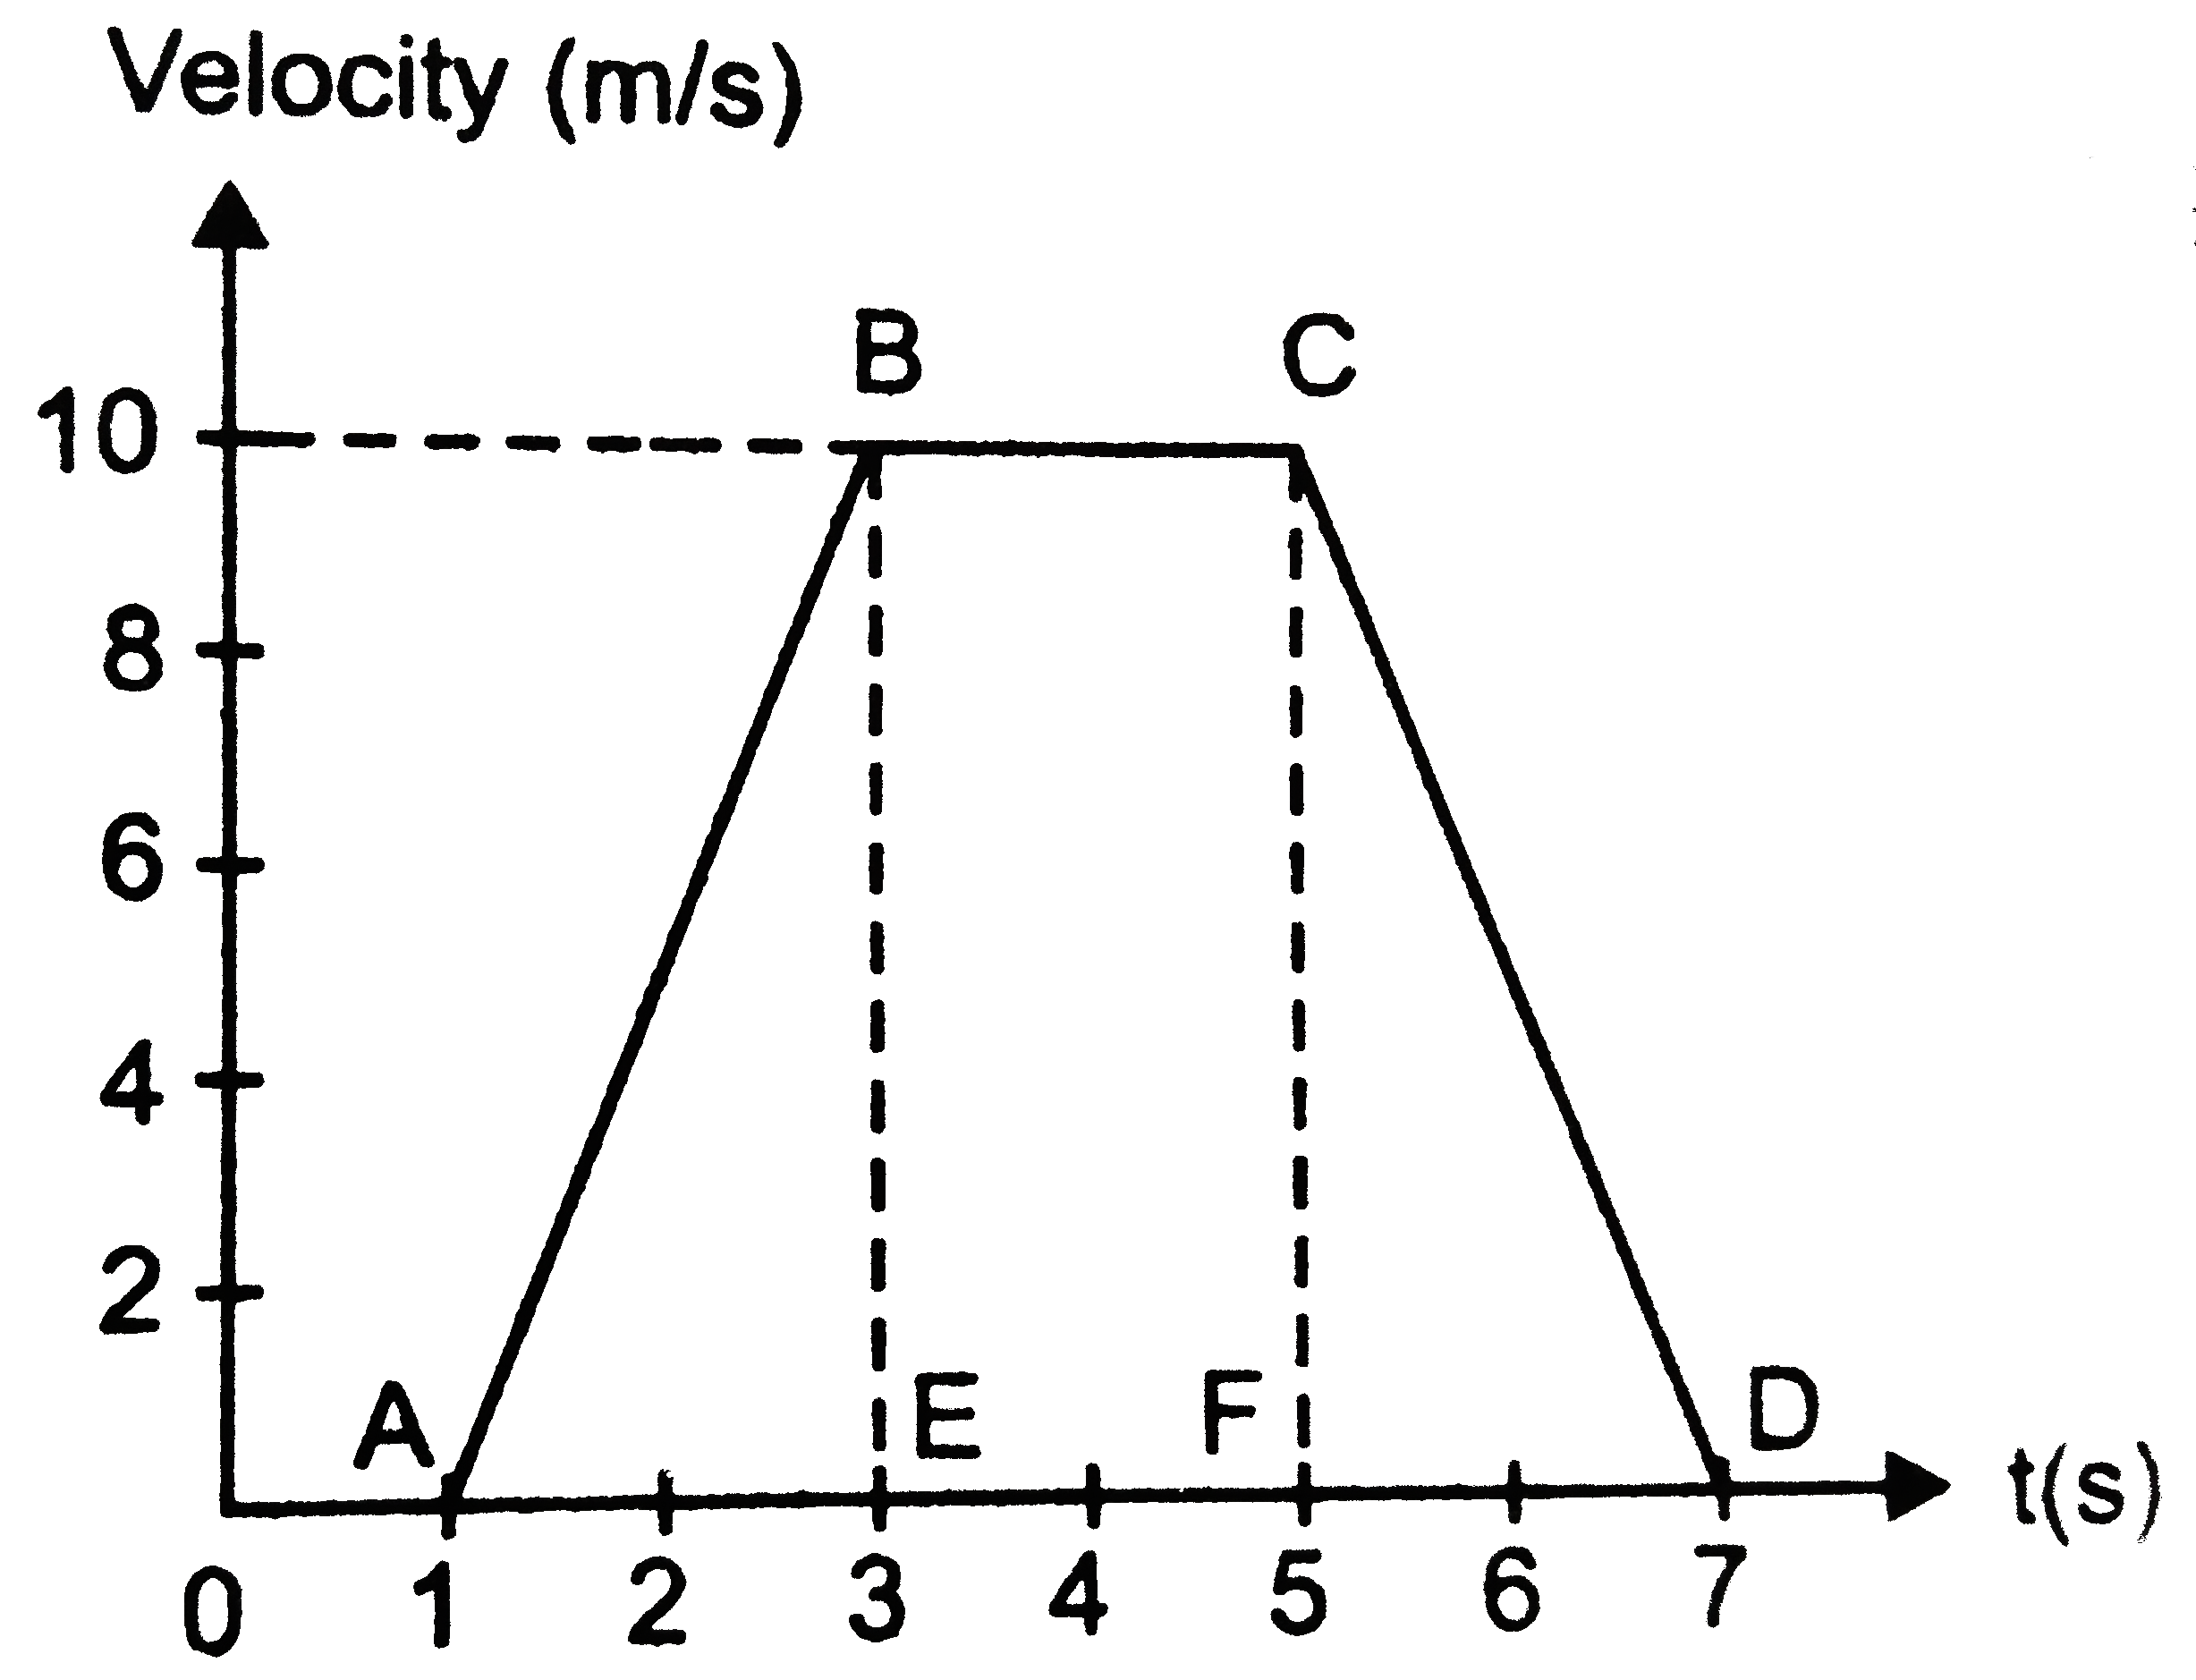
Distance travelled by hody in second is the toatl area which the velocity-time graph encloses with time axis , given by
ltBrgt
.
Topper's Solved these Questions
- BOOK - PRADEEPCHAPTER - KINEMATICSEXERCISE - 4 NCERT multiple Choice10videos
KINEMATICS
- BOOK - PRADEEPCHAPTER - KINEMATICSEXERCISE - 4 NCERT Integer type4videos
KINEMATICS
- BOOK - PRADEEPCHAPTER - KINEMATICSEXERCISE - 2 NCERT multiple15videos
KINEMATICS
- BOOK - PRADEEPCHAPTER - GRAVIATIONEXERCISE - Assertion-Reason Type Questions19videos
GRAVIATION
- BOOK - PRADEEPCHAPTER - LAWS OF MOTIONEXERCISE - Assertion- Reason Type Questions17videos
LAWS OF MOTION
Similar Questions
Knowledge Check
- Question 1 - Select One
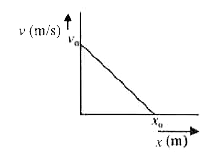
What will be the a versus x graph for the following graph?
 A
A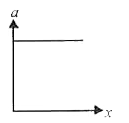 B
B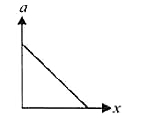 C
C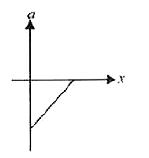 D
D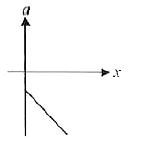
- Question 2 - Select One
Depict the shown v−x graph a−x graph:
 A
A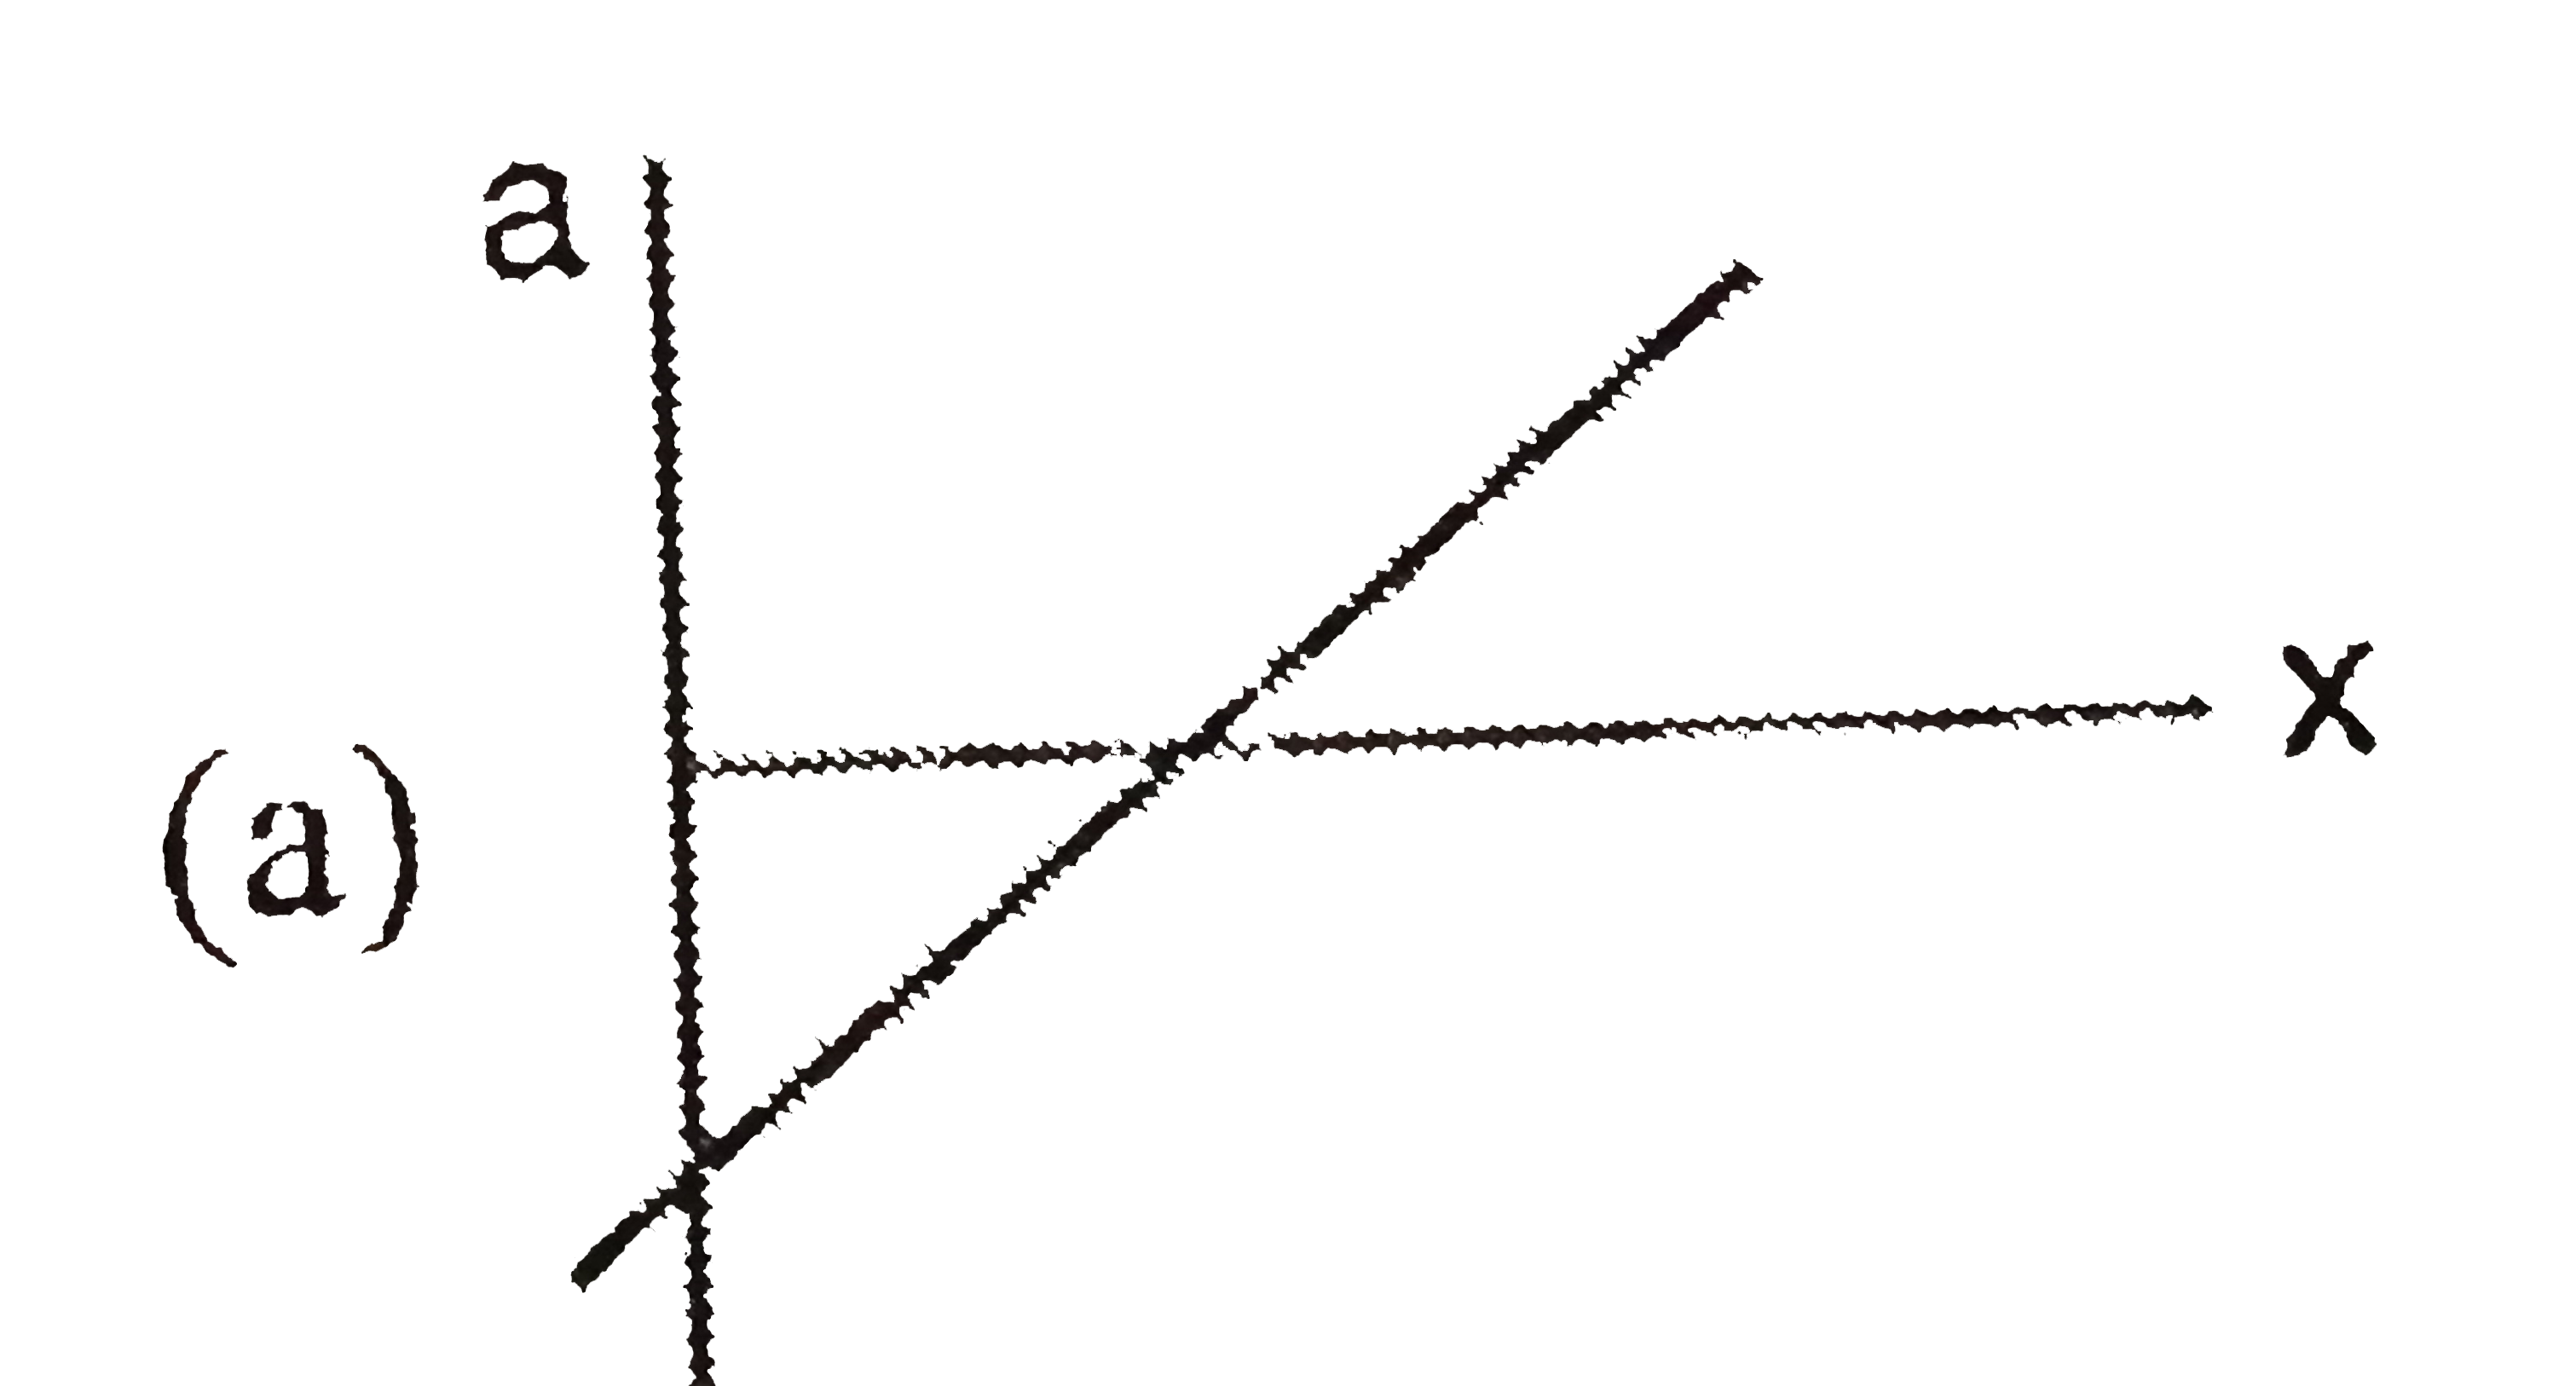 B
B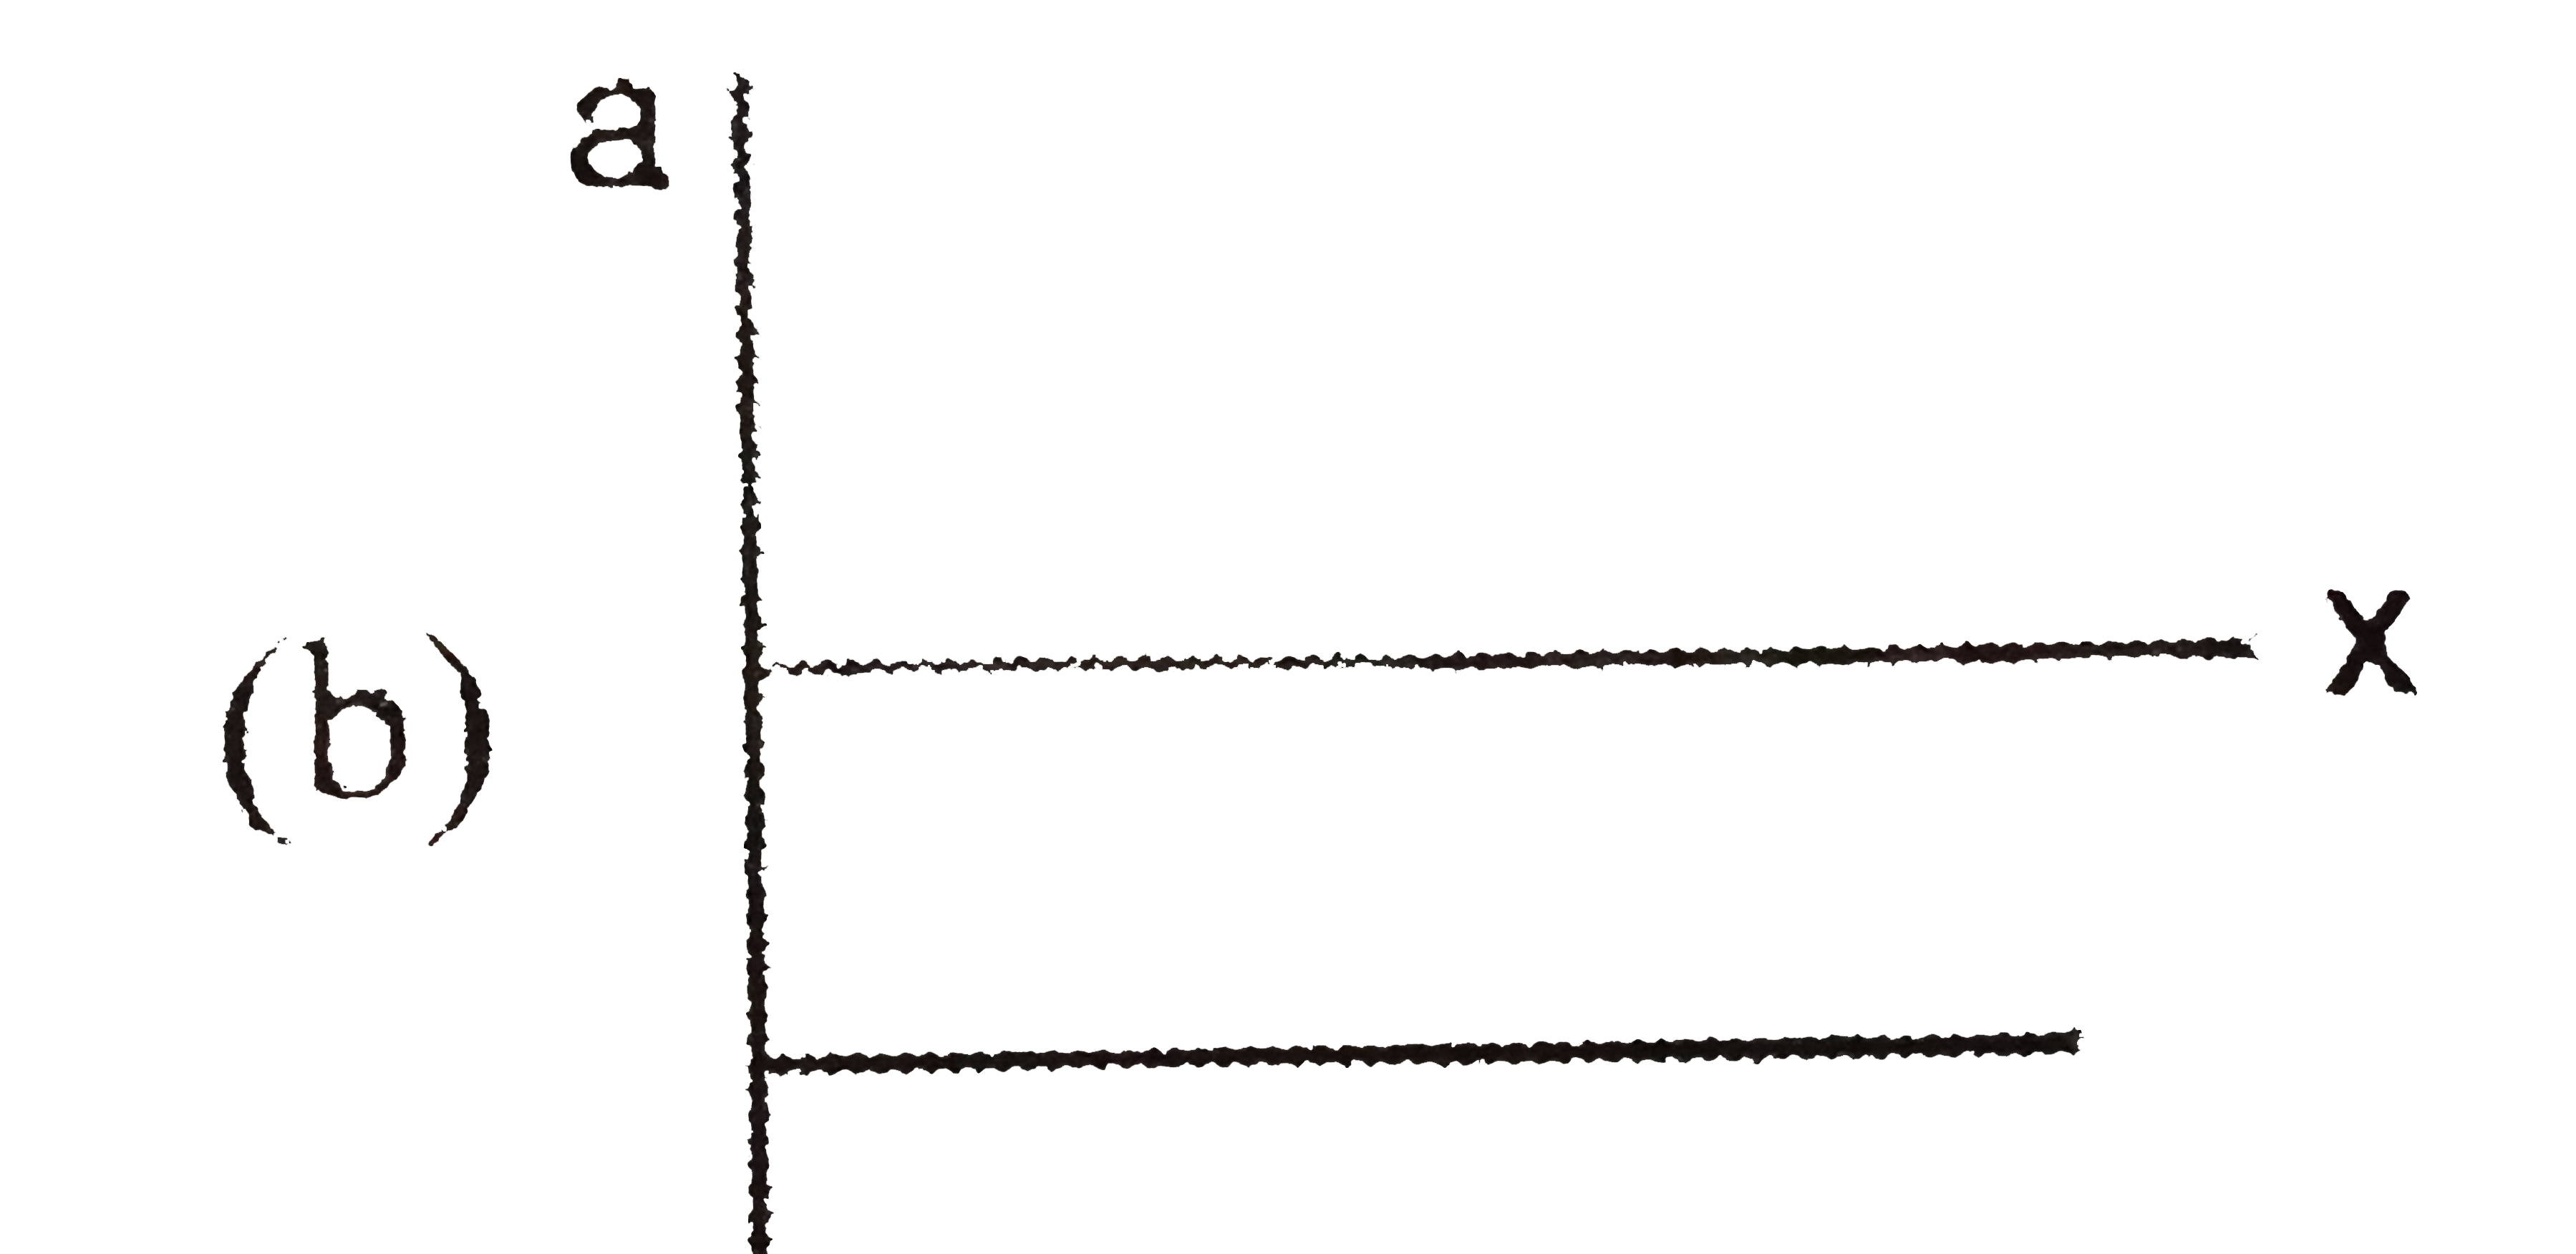 C
C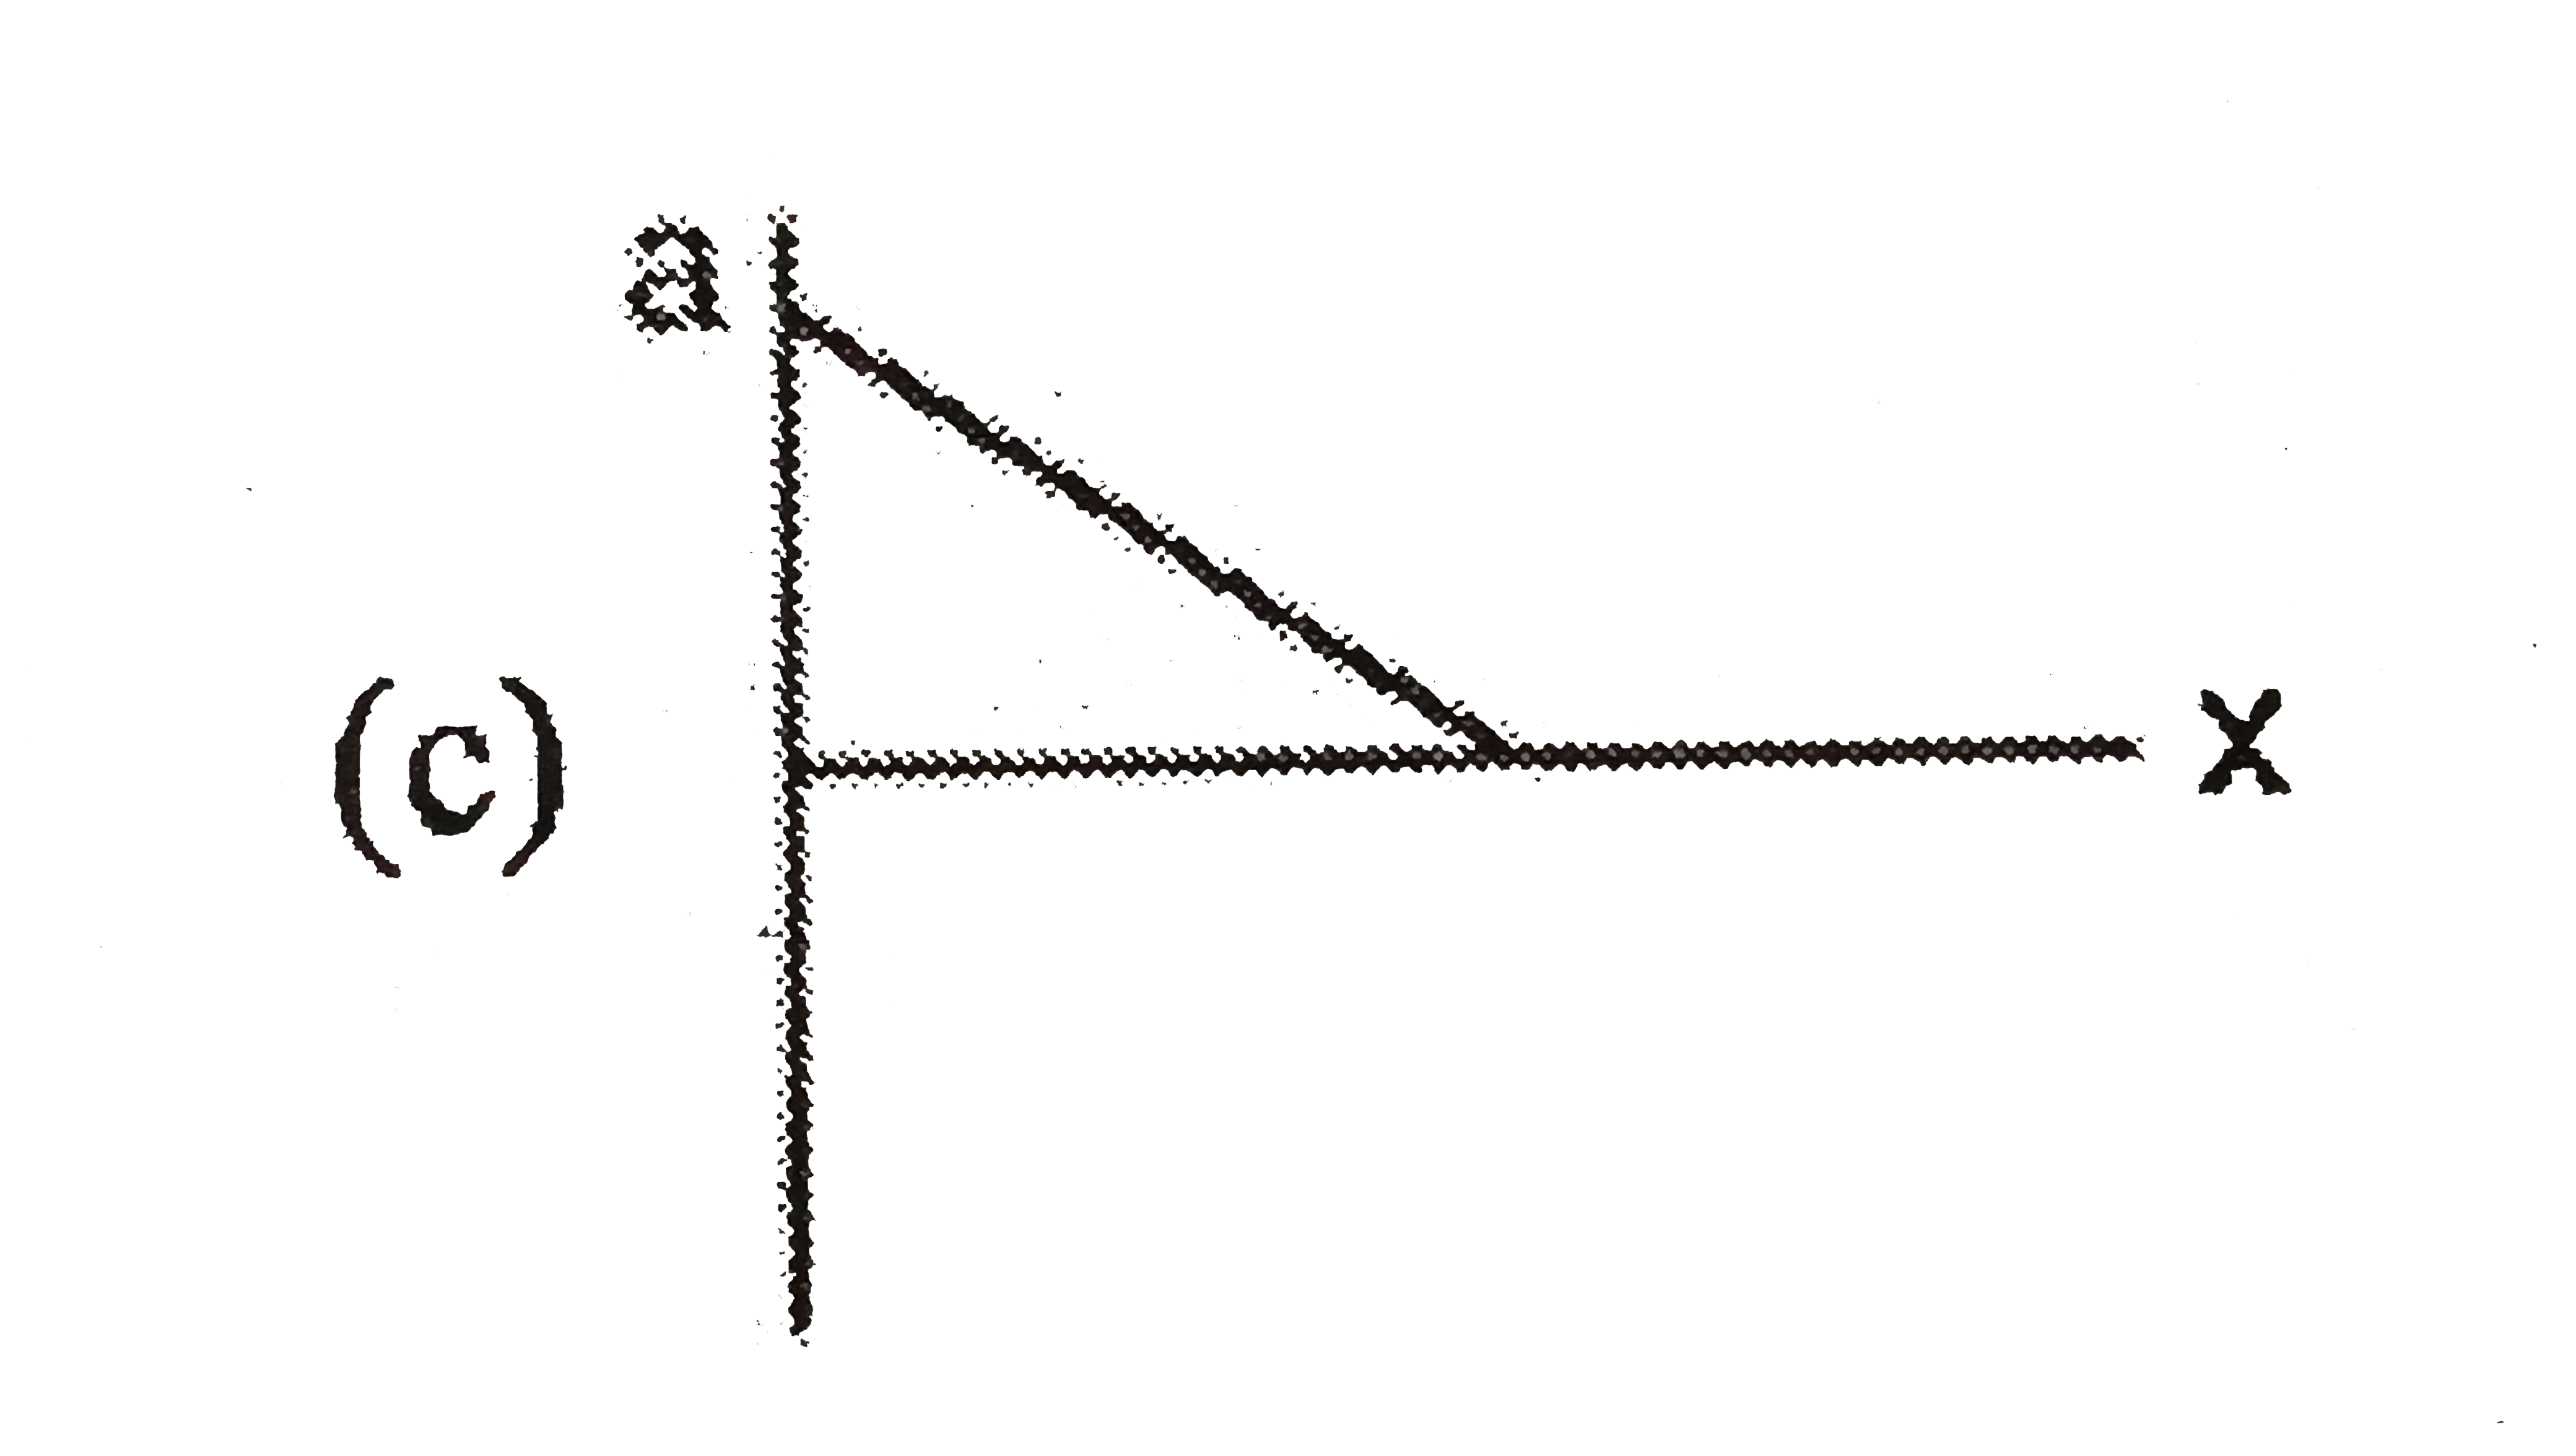 D
D
- Question 3 - Select One
Depict the shown v-x graph in a-x graph :
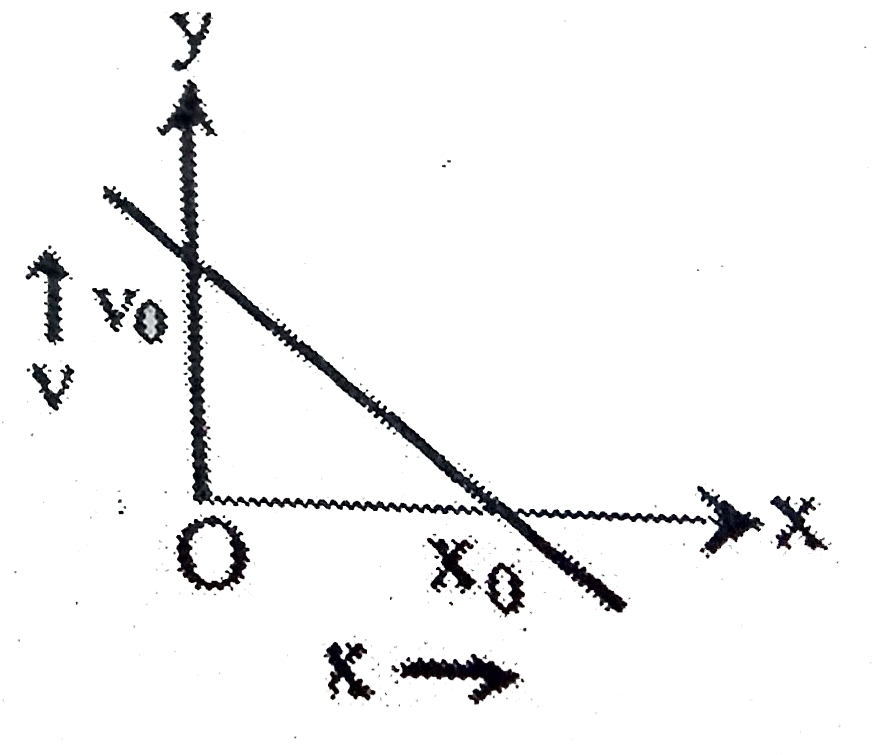 A
A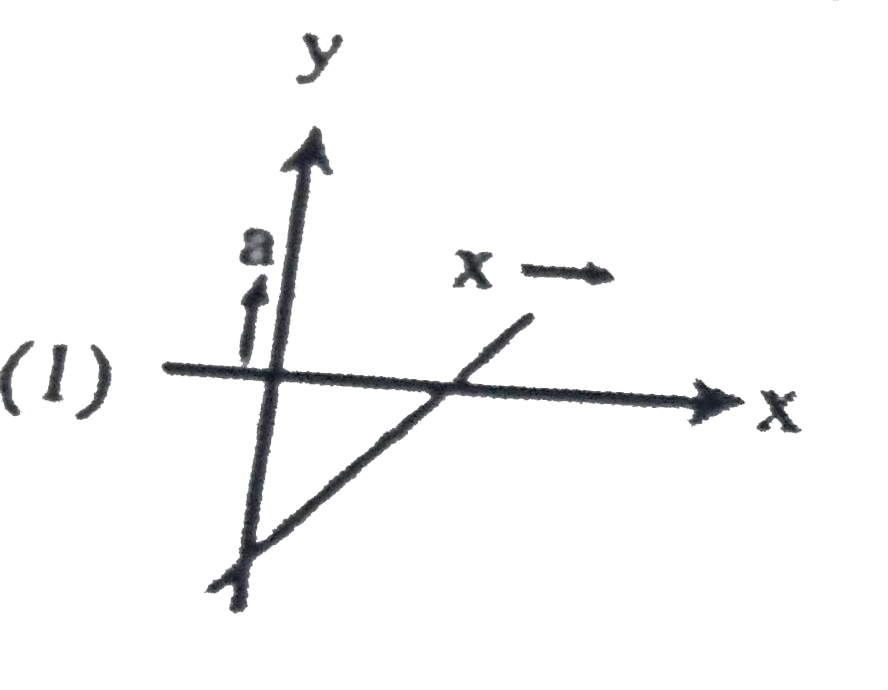 B
B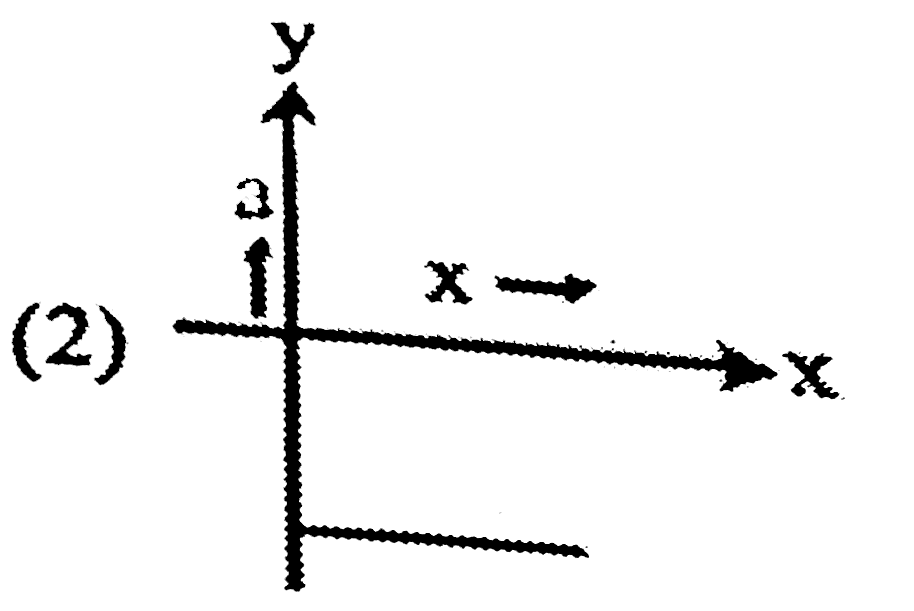 C
C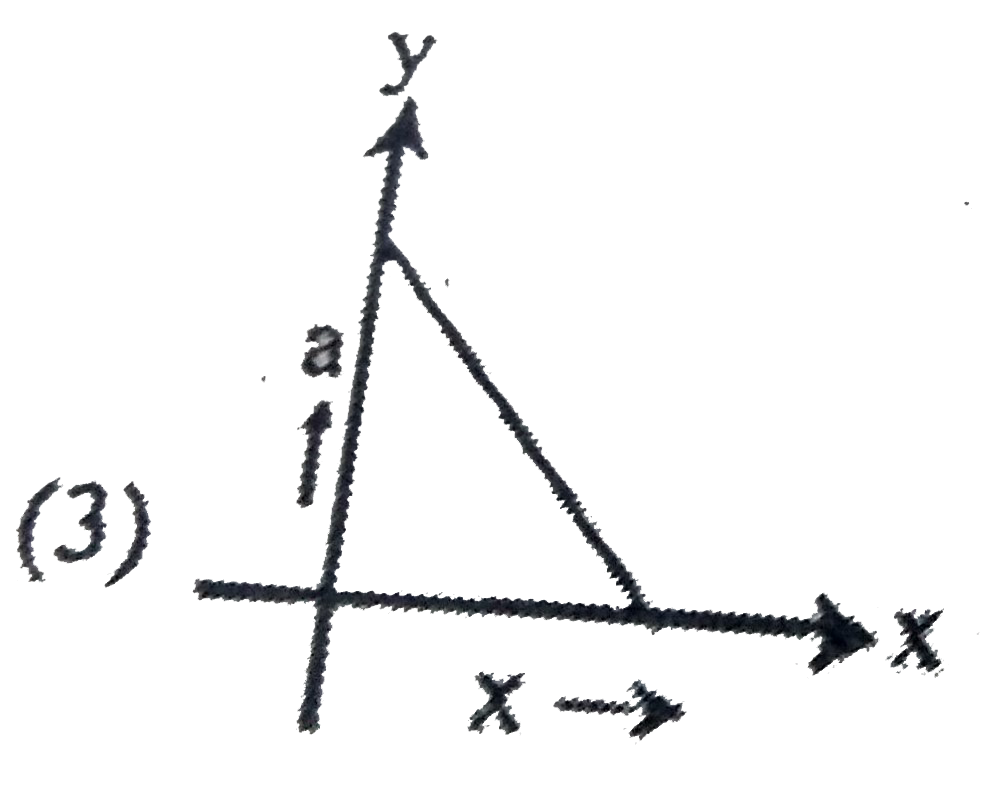 D
D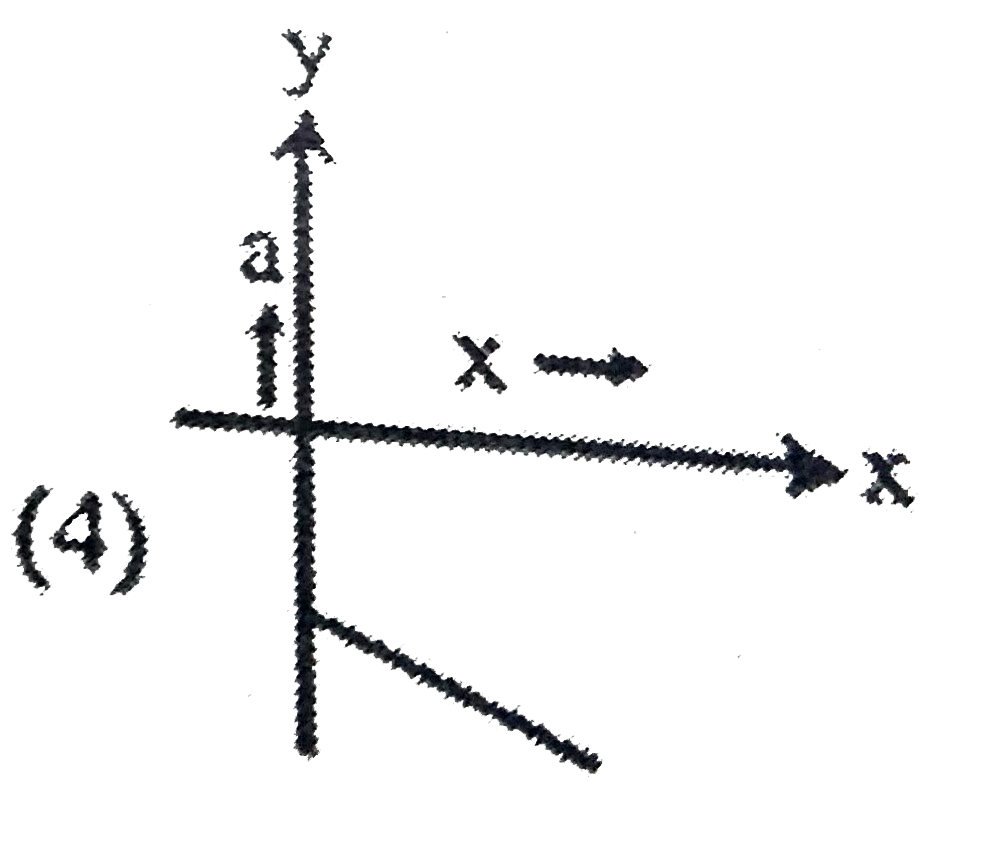
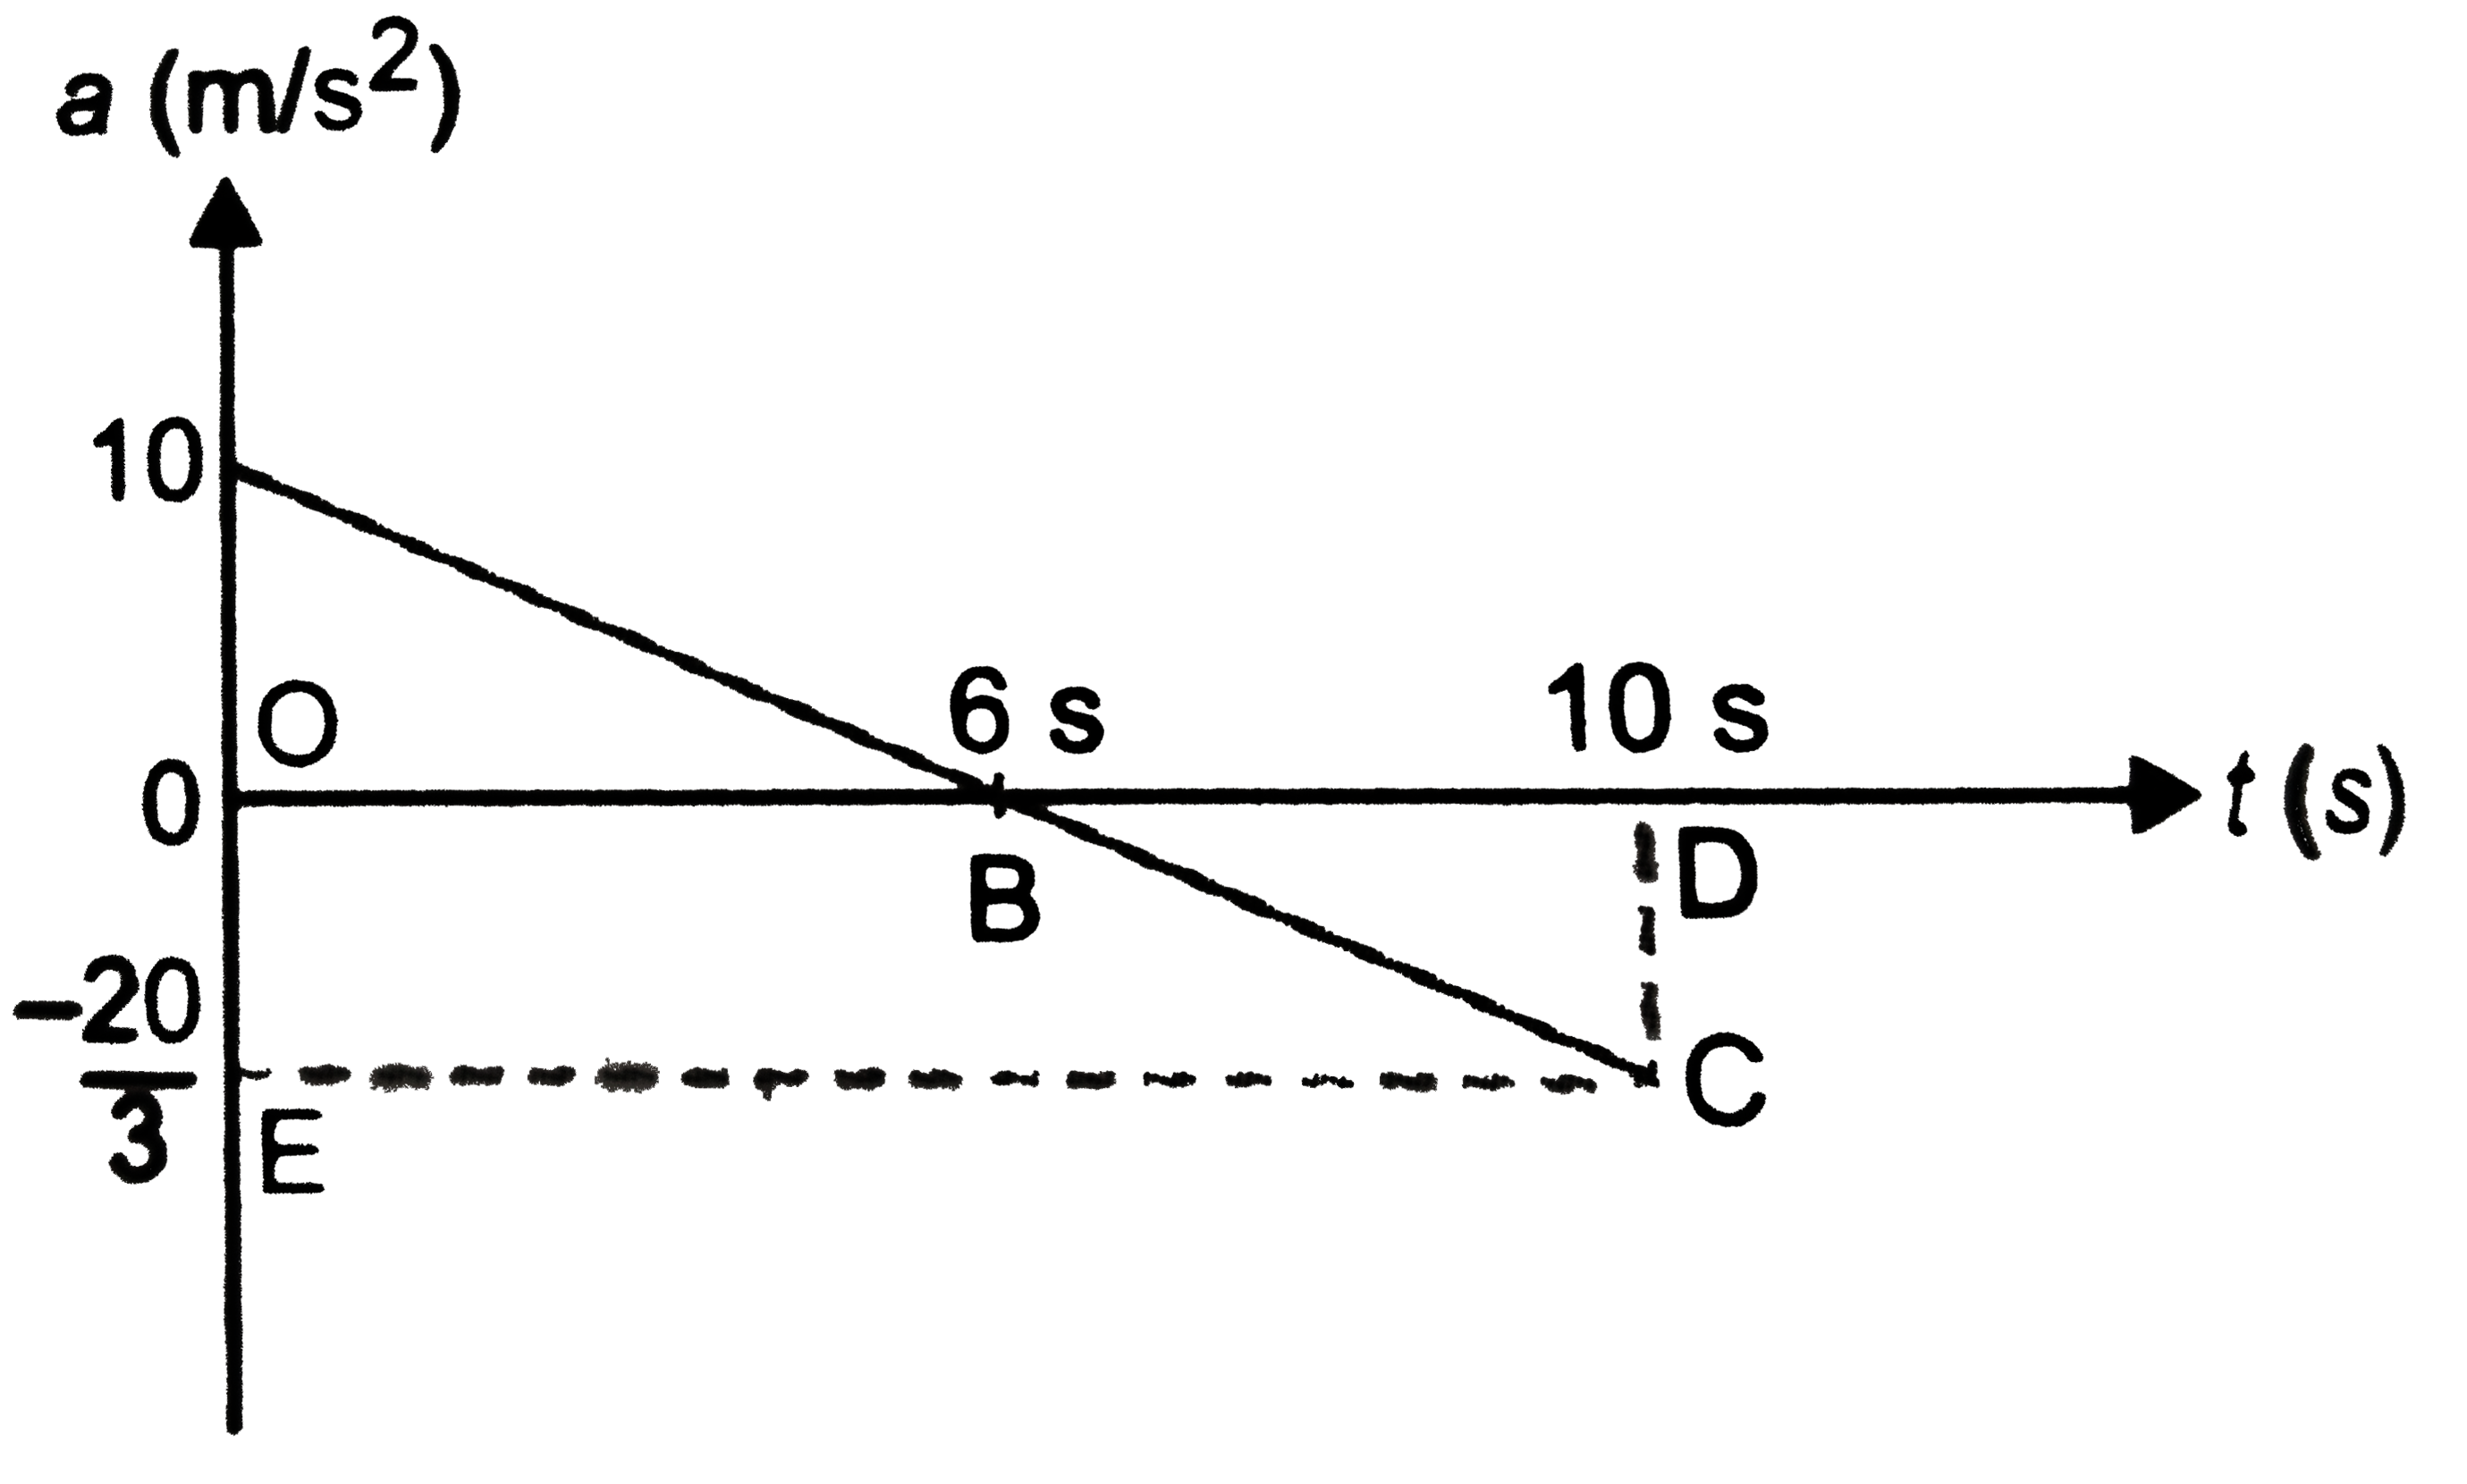
The acceleration time graph of a particle is shown in the Fig. 2 (CF). 11. At time t=0s velocity of the particle is 8ms−1. Its velocity t=10s is.
 .View Solution
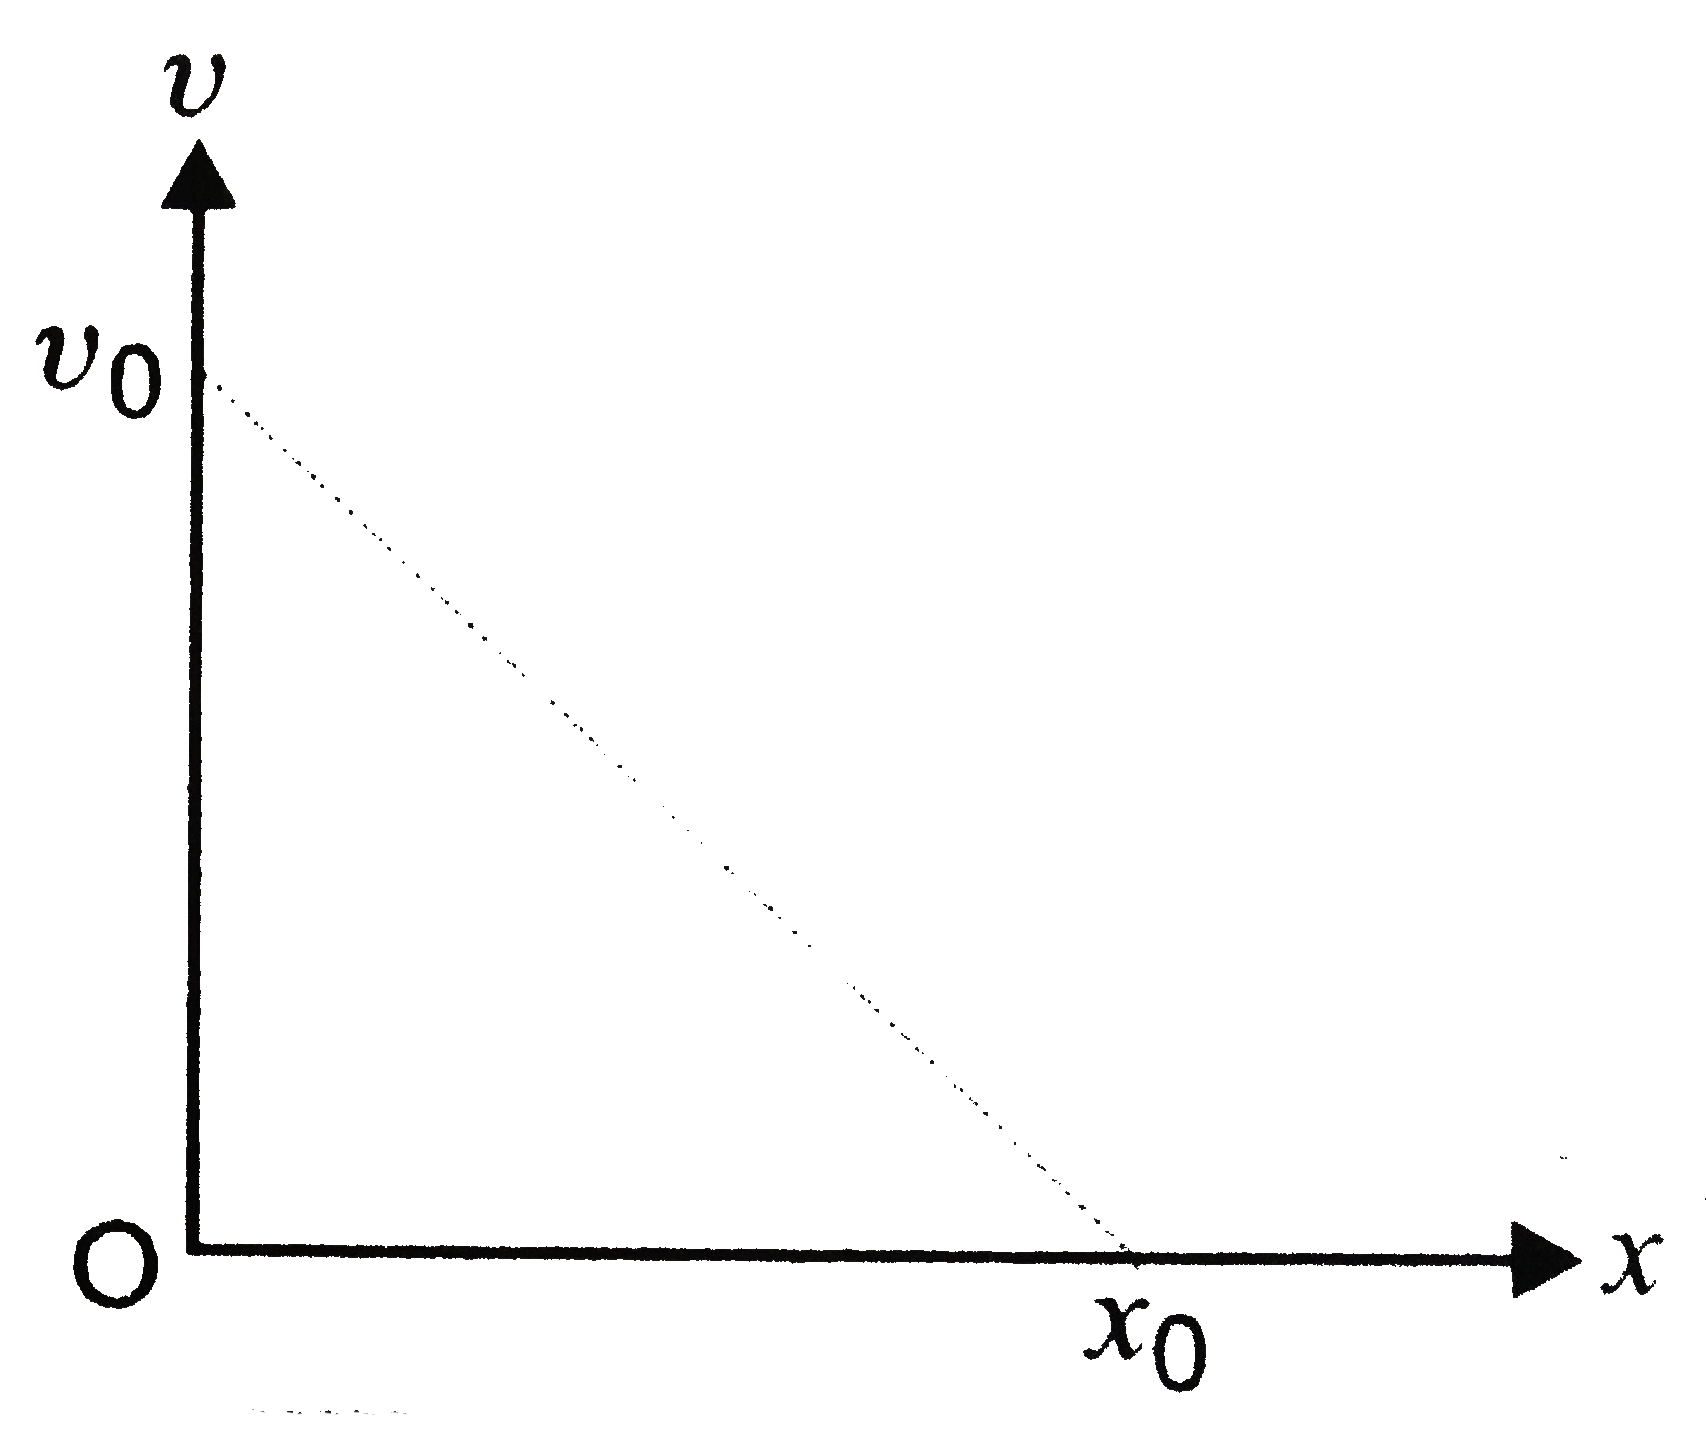
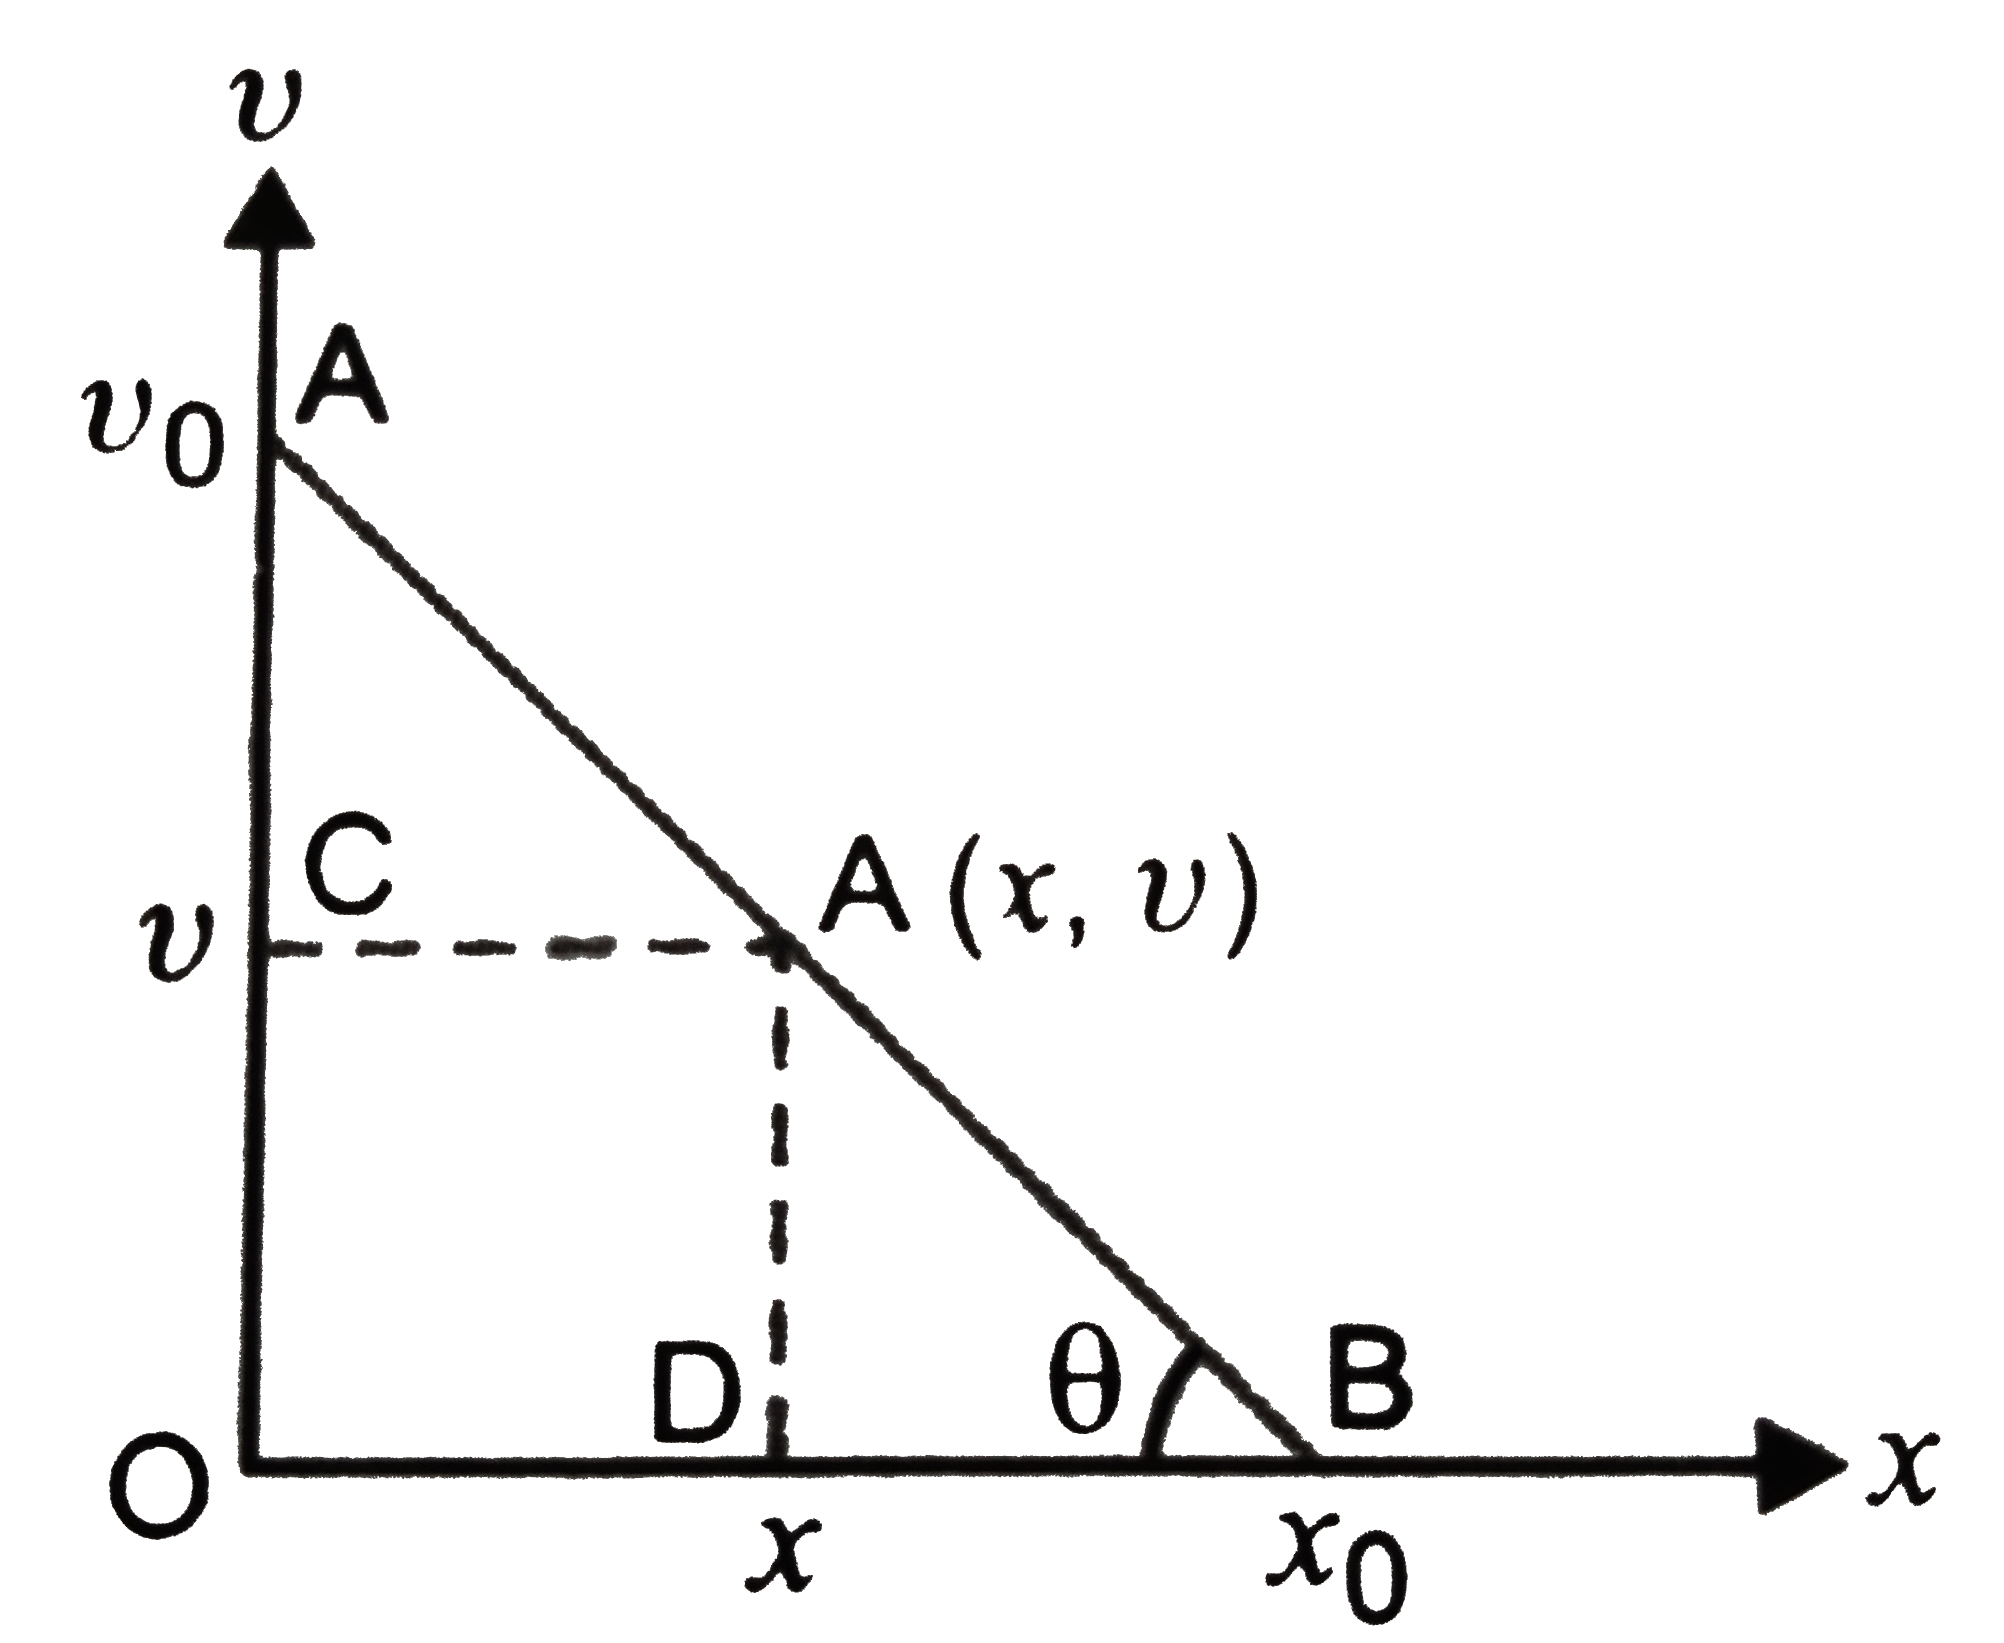
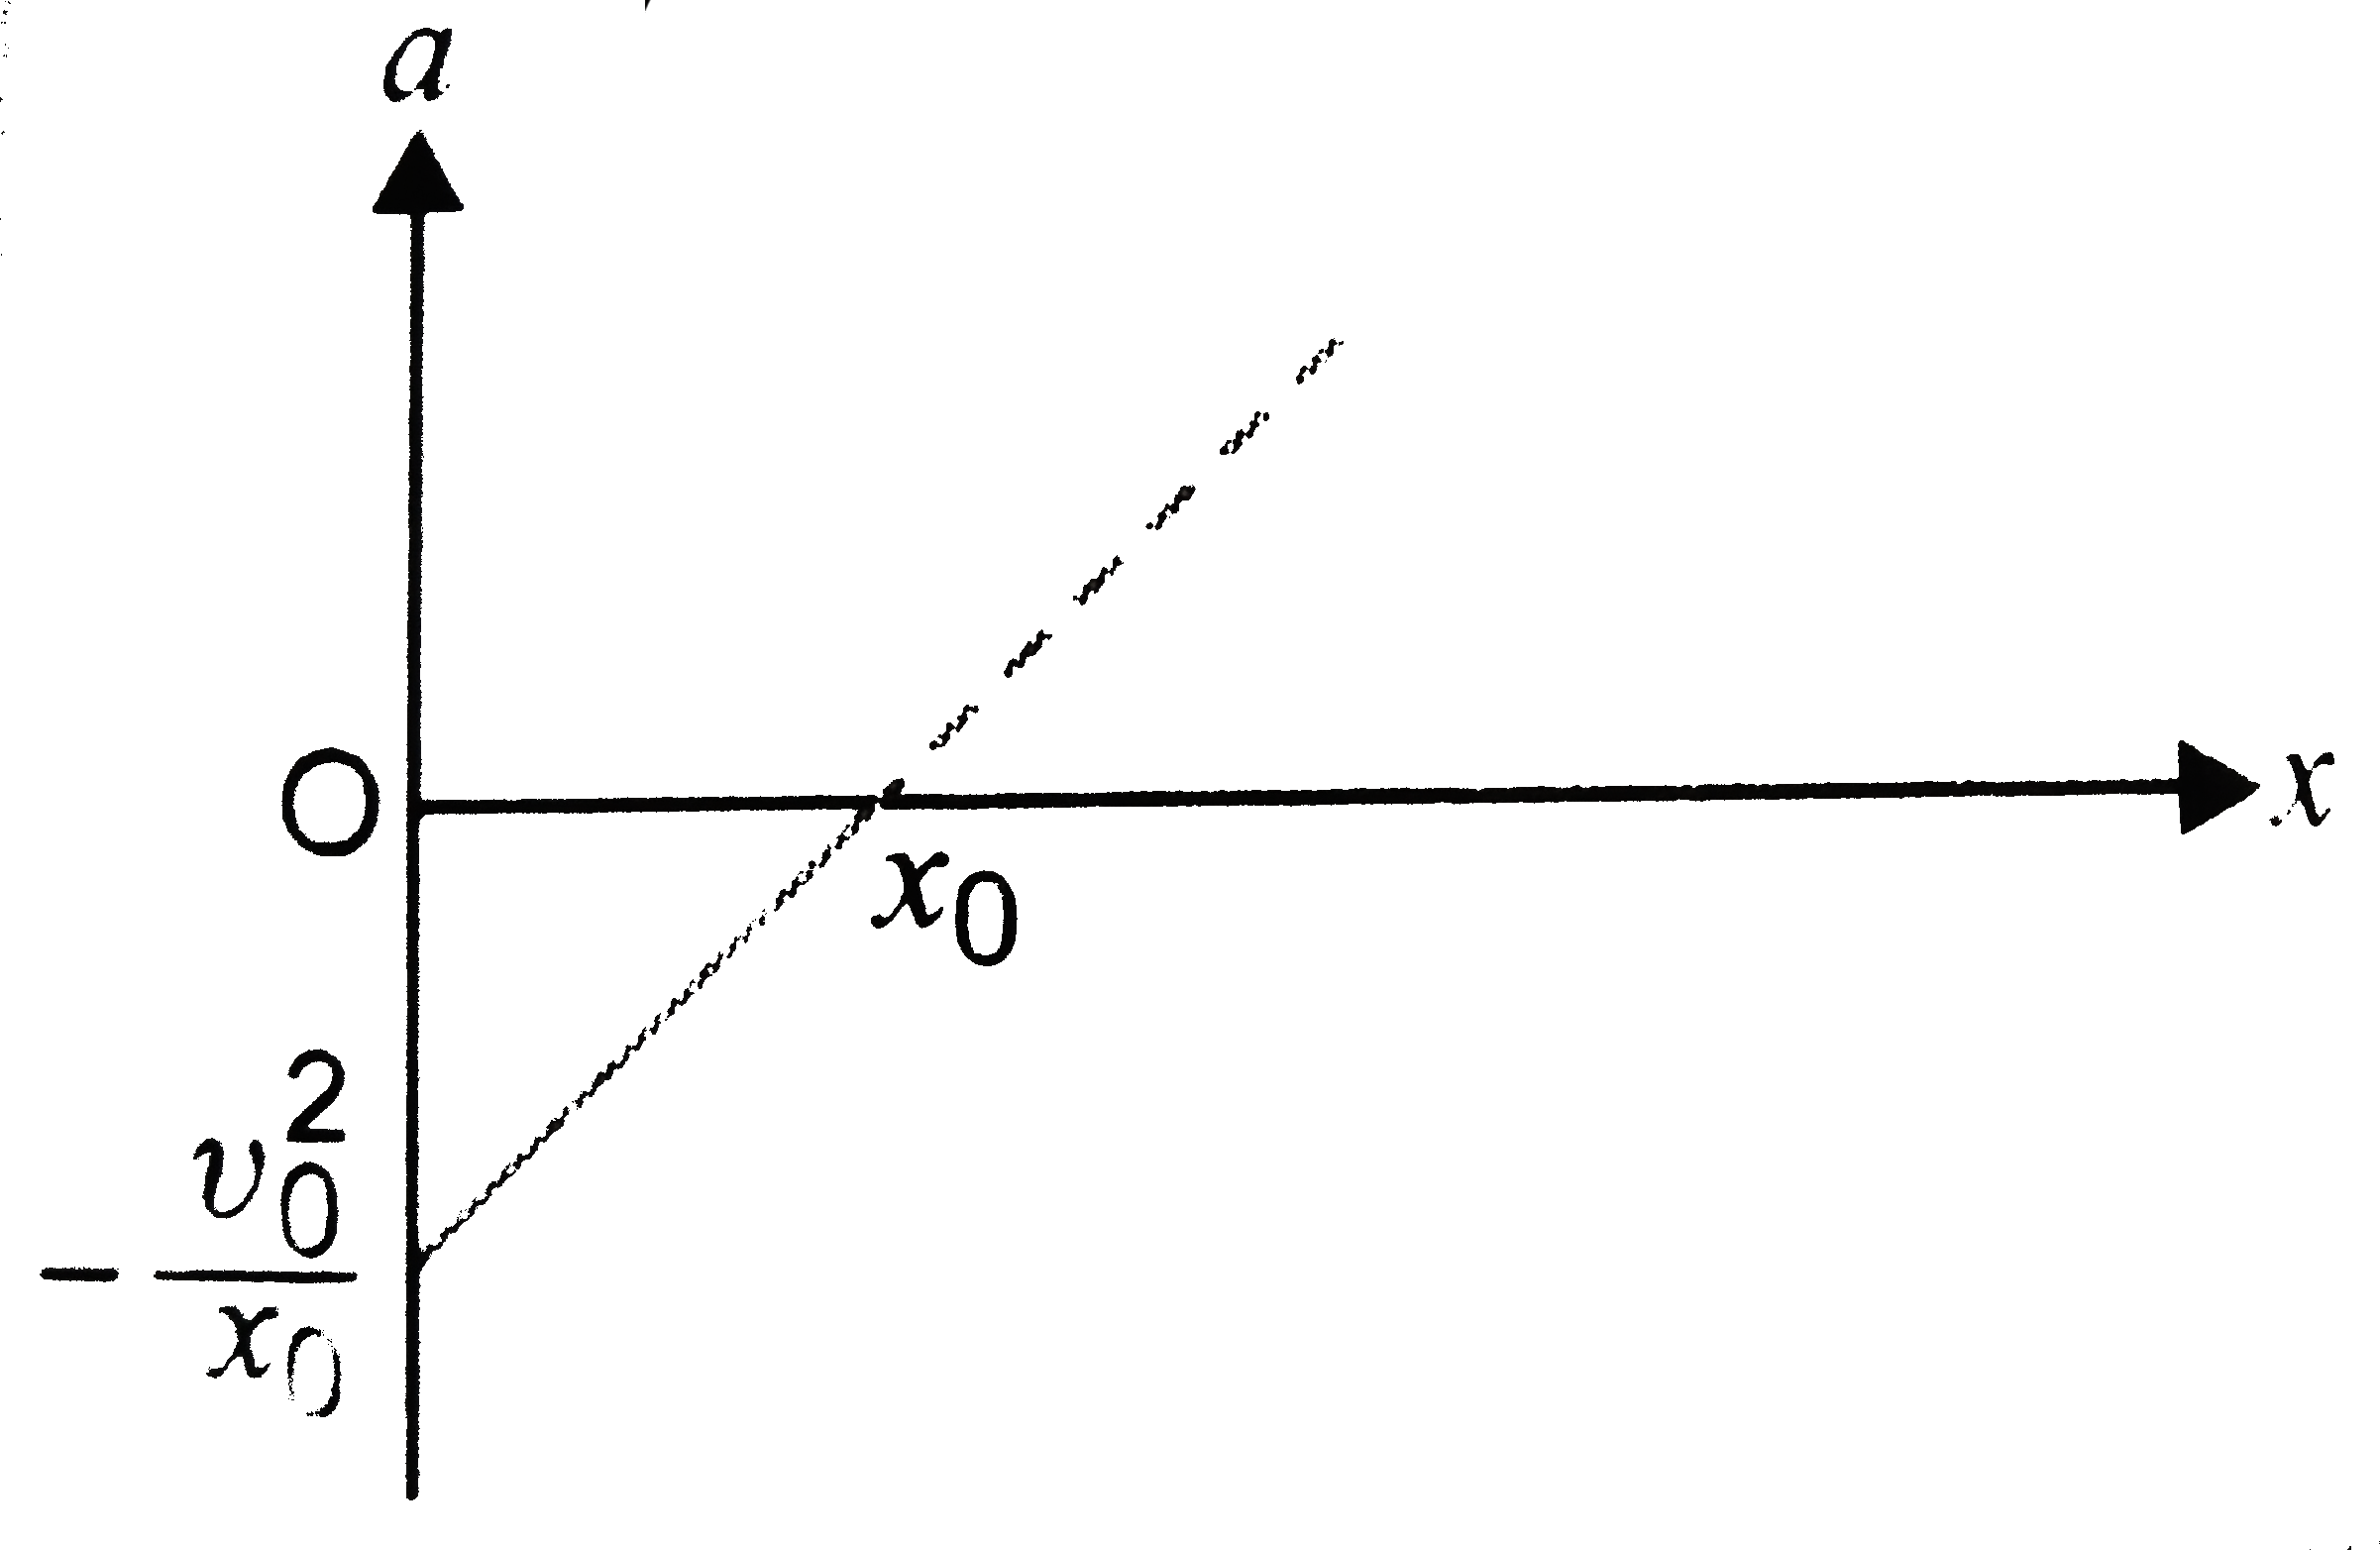
The velocity-displacement graph of a particle is shown in Fig. 2 (EP). 10 . (a) Write the relationbetween (v) and (x).
(b) Obtain the relation between acceleration and displacement and plot it .
 .
.
 .
.
 . View Solution
The acceleration time graph of a particle is shown in the Fig. 2 (CF). 11. At time t=10s is the particle is 8ms−1. Its velocity t=10s is.
 .View Solution
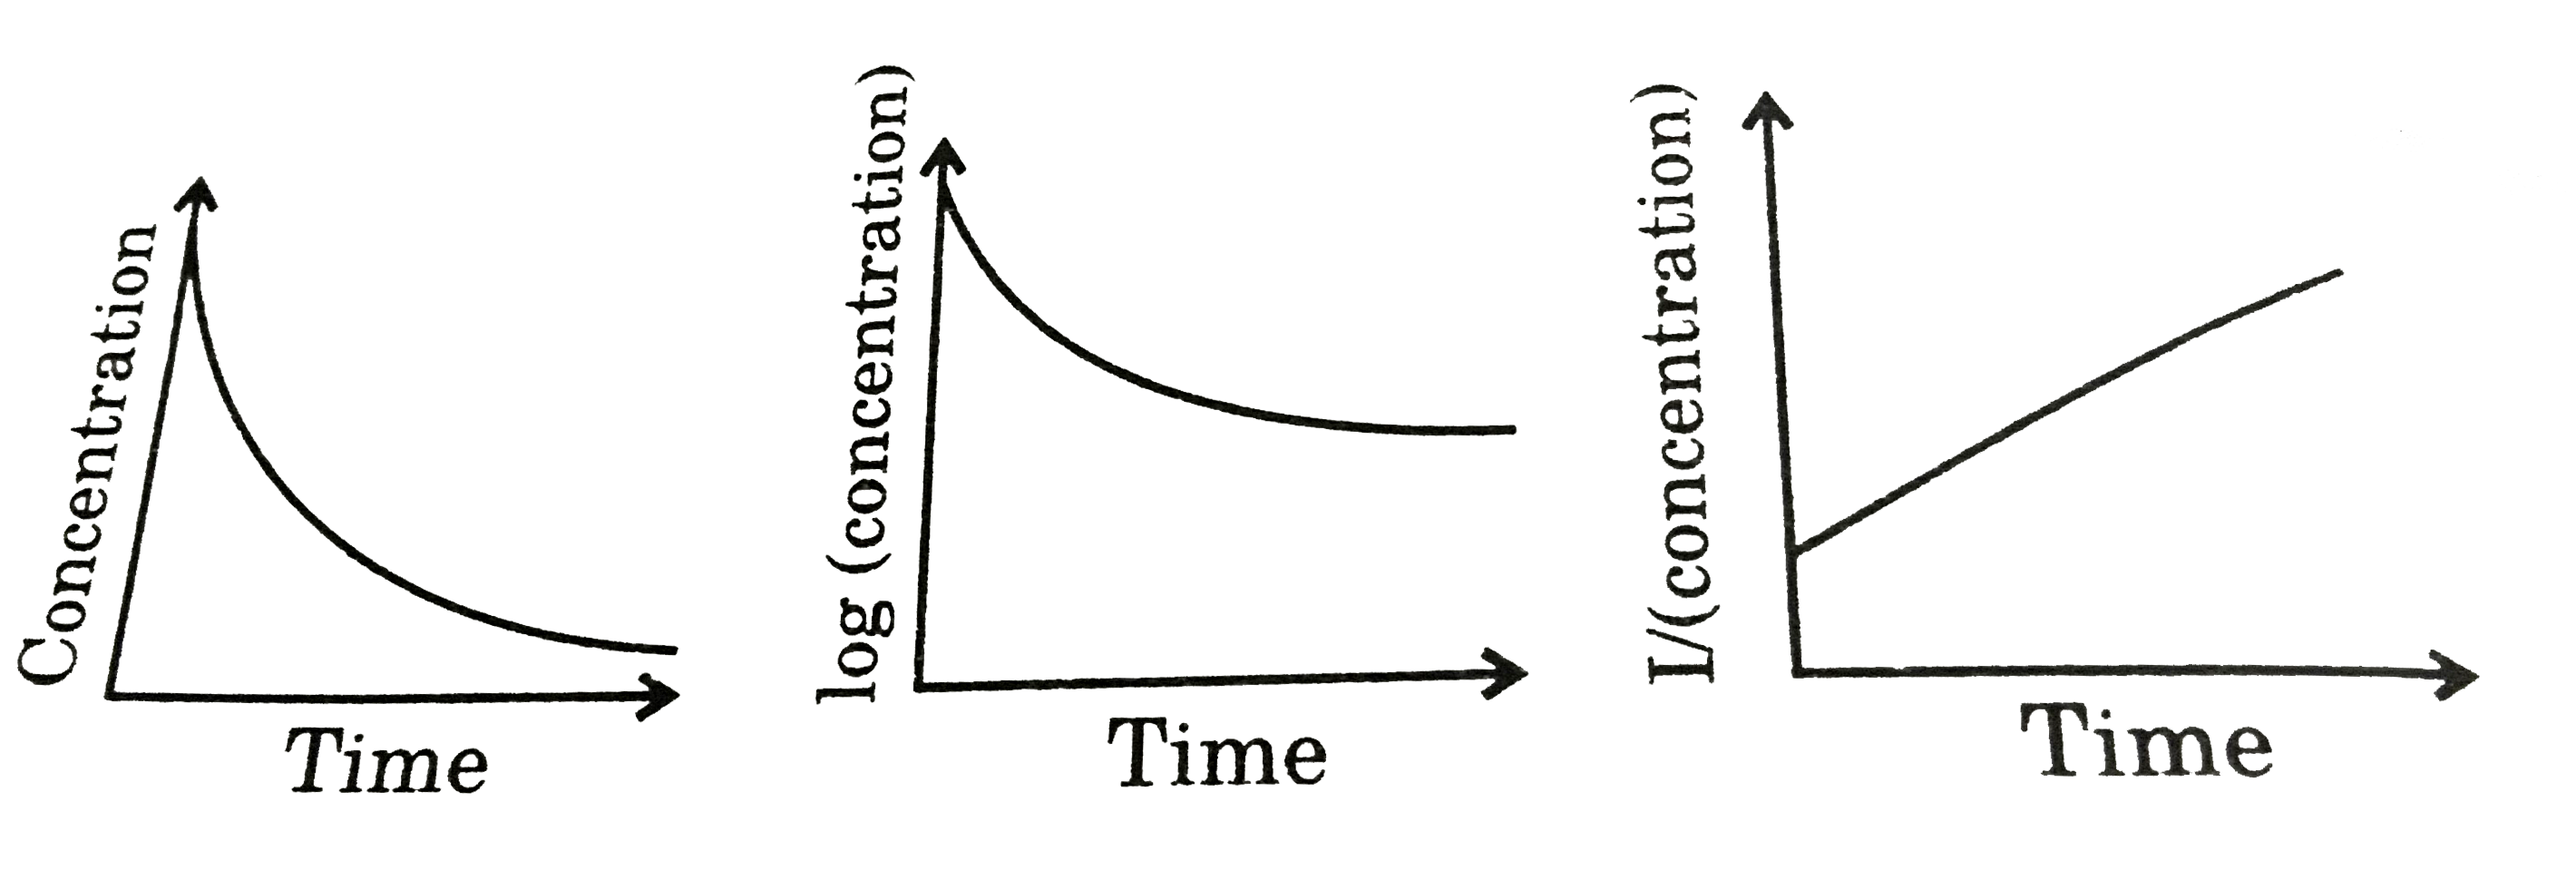
What is the order of a reaction that produces the graphs shown ?
 View Solution
For the velocity tiem graph shown in Fig. 2 (CF).14, the distance covered by the body in last two seconds of its what fraction if the total distance covered by it in all the seven seconds?
 .View Solution


