The graph between square of amplitude and time clapsed is
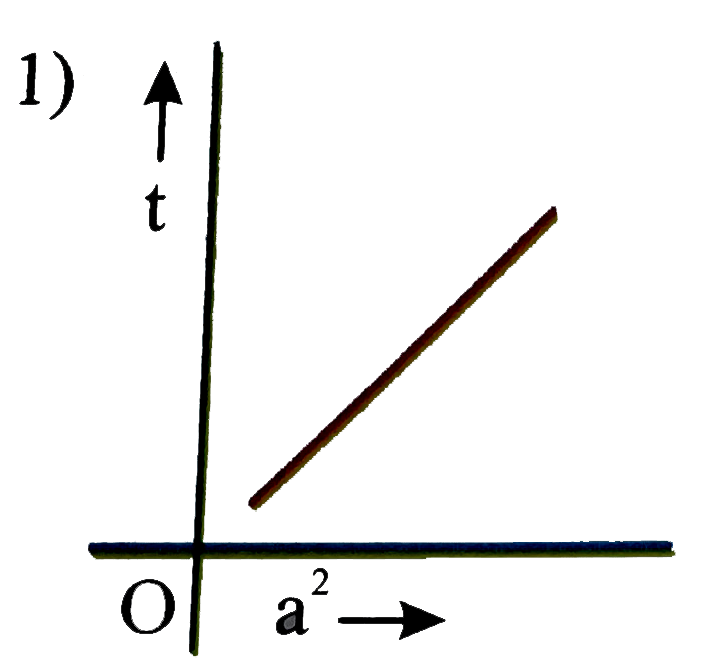
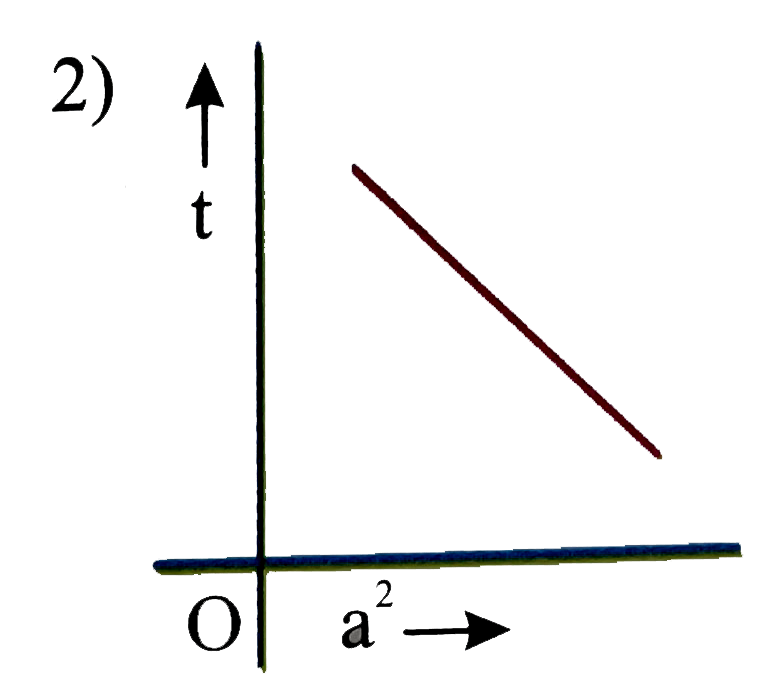
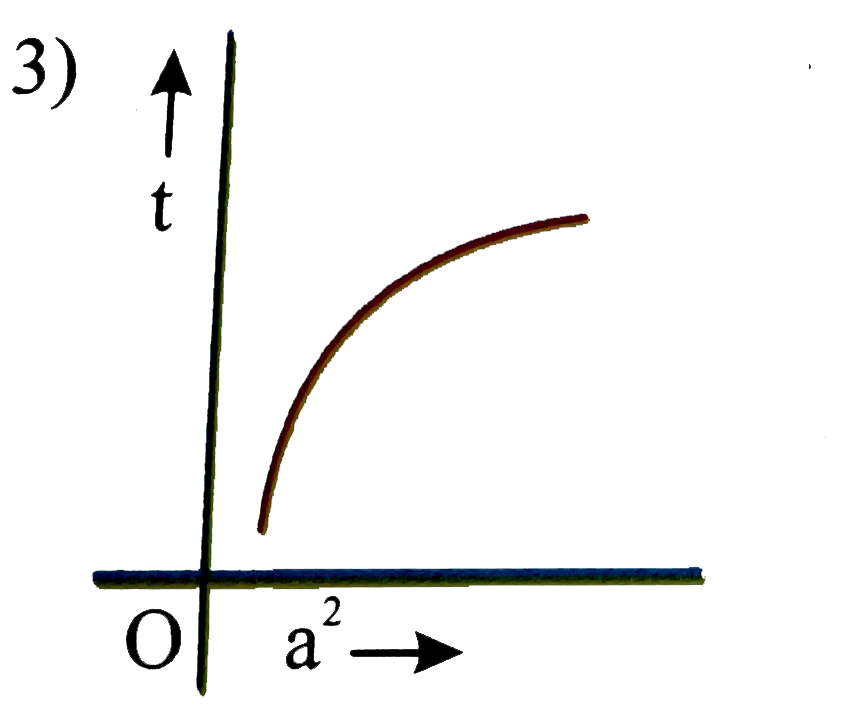
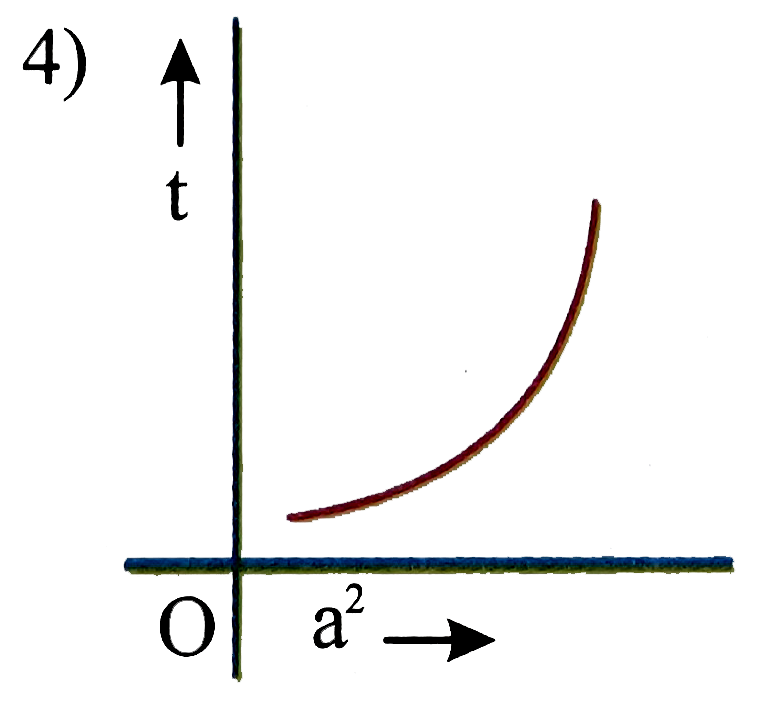
The correct Answer is:B
Topper's Solved these Questions
- EXPERIMENTAL PHYSICSBOOK - NARAYNACHAPTER - EXPERIMENTAL PHYSICSEXERCISE - Level-v(Single answer)
23 Videos
- EXPERIMENTAL PHYSICSBOOK - NARAYNACHAPTER - EXPERIMENTAL PHYSICSEXERCISE - Multiple answer
6 Videos
- ELECTROSTATICS AND GAUSS LAWBOOK - NARAYNACHAPTER - ELECTROSTATICS AND GAUSS LAWEXERCISE - Intergers type question
11 Videos
- MAGNETISMBOOK - NARAYNACHAPTER - MAGNETISMEXERCISE - LEVEL-II (H.W)
24 Videos
Similar Questions
To study the dissipations of the energy of a simple pendulum, student plots a graph between square root of time and amplitude . The graph would be a
View SolutionIn an experiment , to find the loss of energy with respect to time in case of swinging simple pendulum , the graph between (amplitude)2 and time is
View Solution
Knowledge Check
In an experiment , to find the loss of energy with respect to time in case of swinging simple pendulum , the graph between (amplitude)2 and time is
A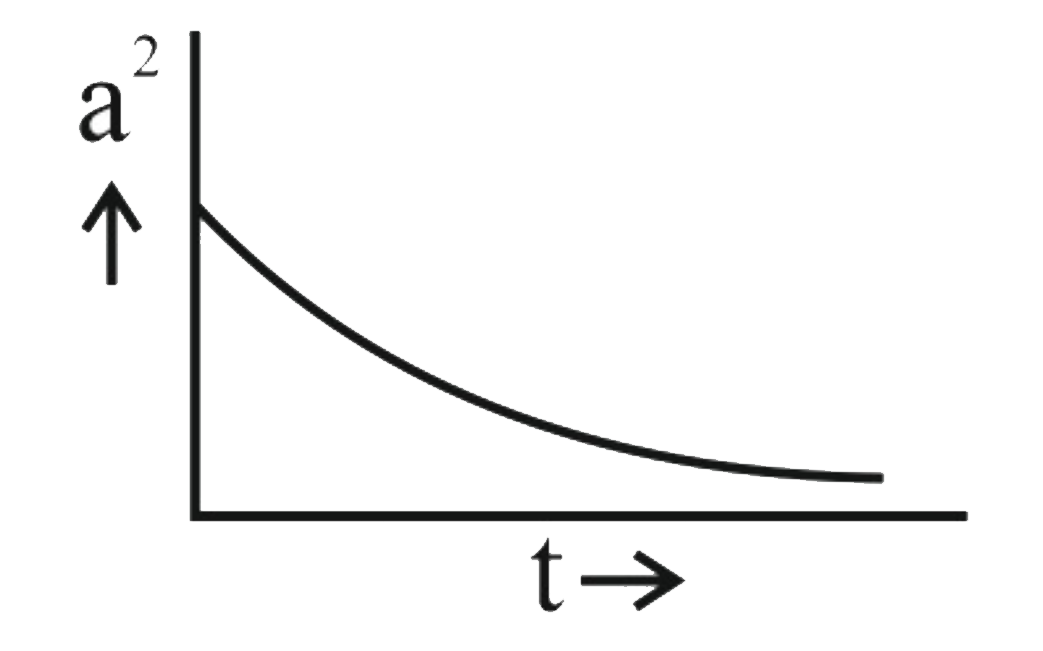 B
B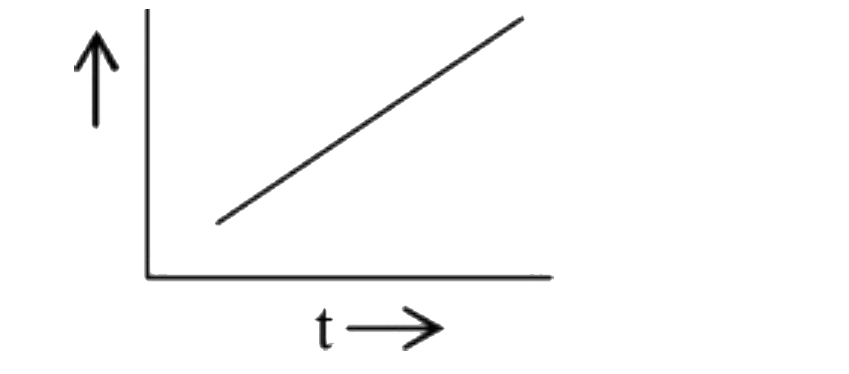 C
C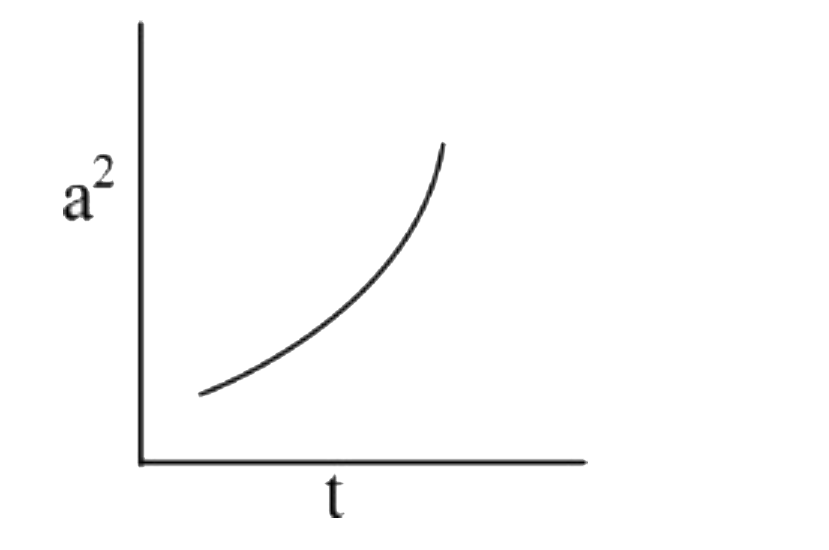 D
D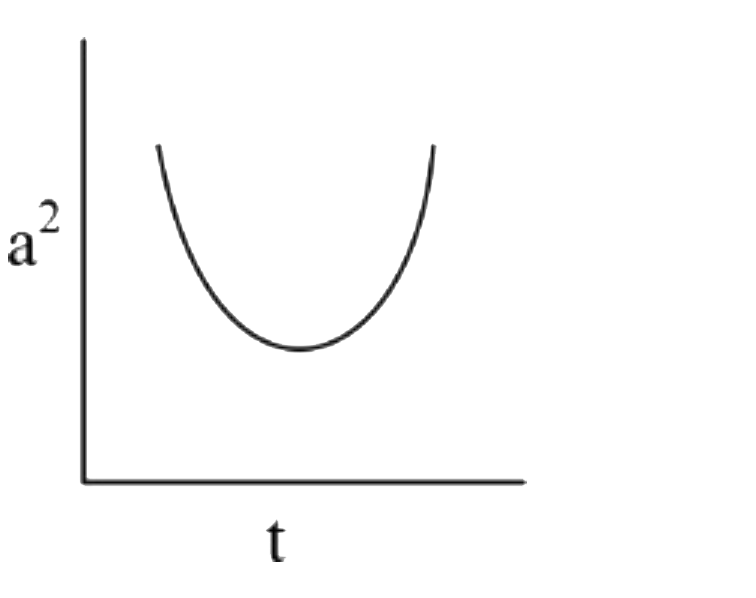
To study the dissipations of the energy of a simple pendulum, student plots a graph between square root of time and amplitude . The graph would be a
Aticker timerBmeter scaleCpaper tapeDstop watchTo study the dissipations of the energy of a simple pendulum, student plots a graph between square root of time and amplitude . The graph would be a
Astraight lineBhyperbolaCparabolaDexponential
Which of the following graphs between the square of the time period and cube of the distance of the planet from the sun is correct ?
View SolutionWhich of the following graphs between the square of the time period and cube of the distance of the planet from the sun is correct ?
View SolutionA graph between the square of the velocity of a particle and the distance(s) moved is shown in figure. The acceleration of the particle in kilometers per hour square is:-

View SolutionIn an experiment , to find the loss of energy with respect to time in case of swinging simple pendulum , the graph between (amplitude)2 and time is
View SolutionWhich of the following graphs between the square of the time period and cube of the distance of the planet from the sun is correct ?
View Solution
