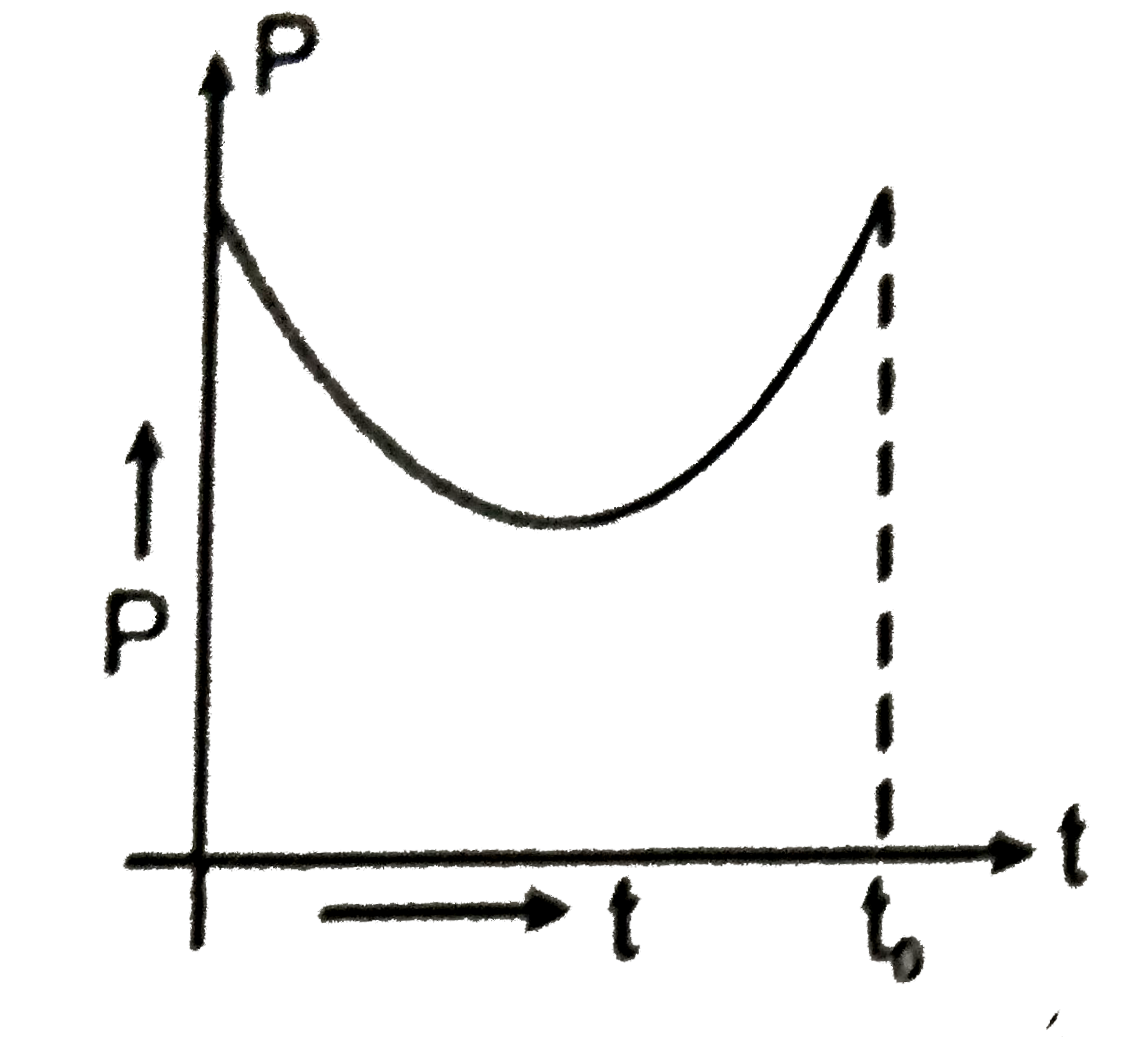
Power versus time graph for a give force is given below. Work done
by the force upto time t(≤t0).
First decreases then increases
First increases then decreases
Always increases
Always decreases
The correct Answer is:C
The work done by force from time t=0 to t=tsec. is given by shaded area in graphs below. Hence as t increases, this area increses.

∴Work done by force keeps on increasing .
Topper's Solved these Questions
- DAILY PRACTICE PROBLEMSBOOK - RESONANCECHAPTER - DAILY PRACTICE PROBLEMSEXERCISE - dpp 41
7 Videos
- DAILY PRACTICE PROBLEMSBOOK - RESONANCECHAPTER - DAILY PRACTICE PROBLEMSEXERCISE - dpp 42
7 Videos
- DAILY PRACTICE PROBLEMSBOOK - RESONANCECHAPTER - DAILY PRACTICE PROBLEMSEXERCISE - dpp 39
3 Videos
- CURRENT ELECTRICITYBOOK - RESONANCECHAPTER - CURRENT ELECTRICITYEXERCISE - Exercise
54 Videos
- ELASTICITY AND VISCOCITYBOOK - RESONANCECHAPTER - ELASTICITY AND VISCOCITYEXERCISE - Advanced Level Problems
9 Videos
Similar Questions
Knowledge Check
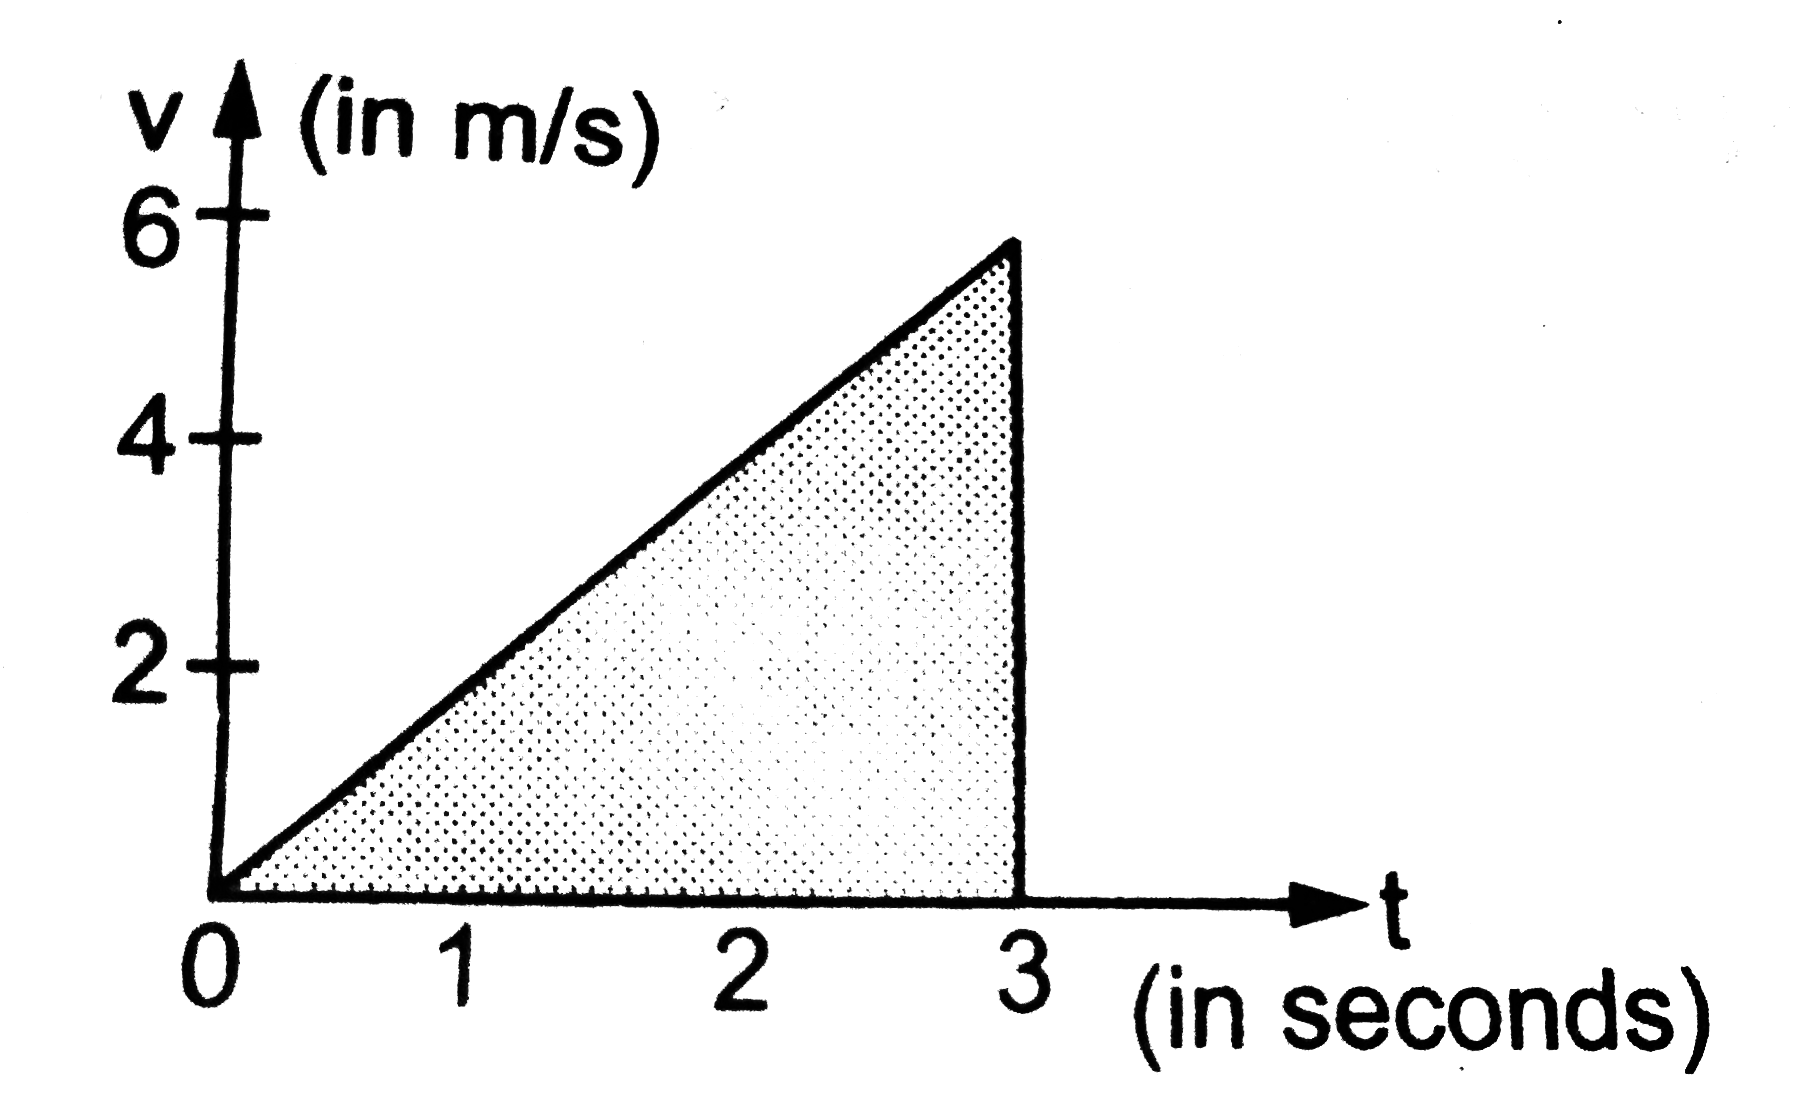
Figure shows the speed versus time graph for a particle. Find the distance travelled by the particle during the time t=0 to t=3s.
 A9mB5mC2mD1m
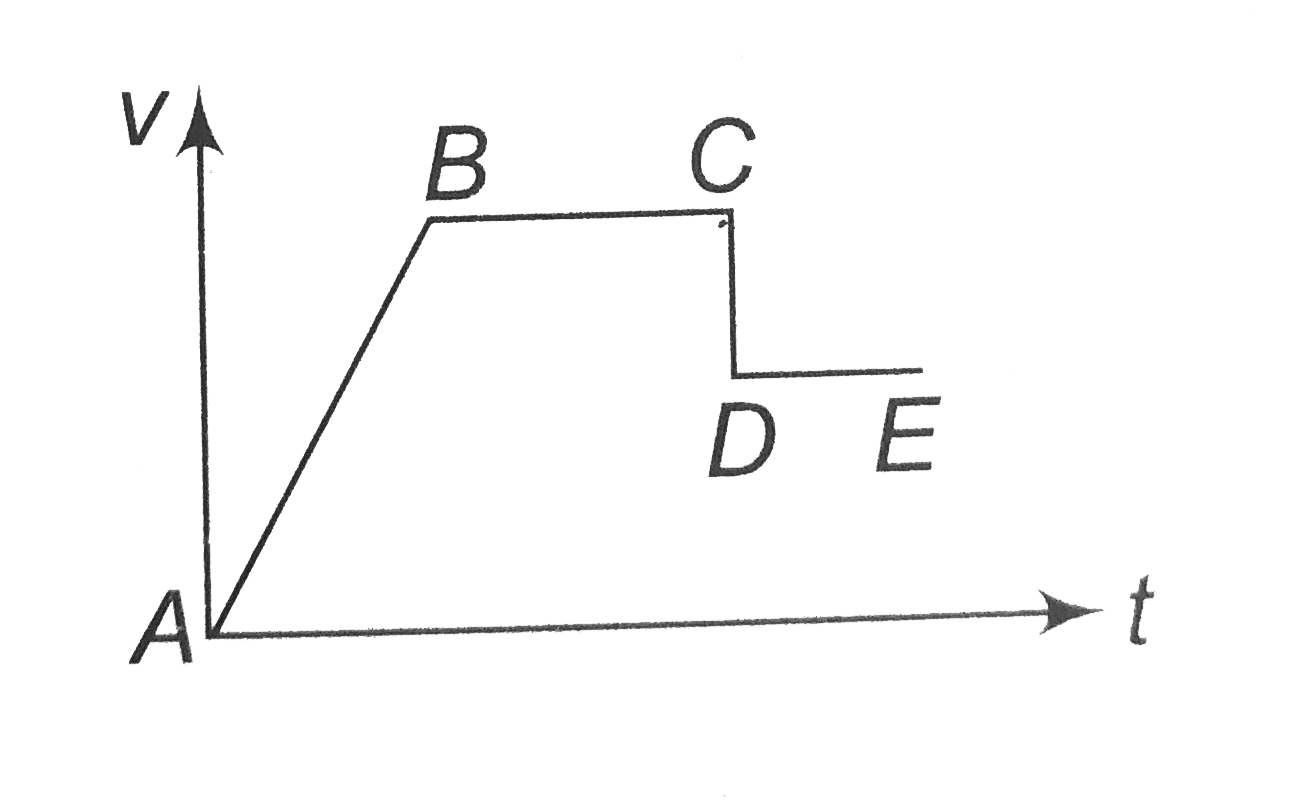
The adojoining diagram showns the velocity versus time plot for a partical . The work done by the force on the partical is positive from
 AA toBBB to CCC toDDD toE
Acceleration time graph of a particle is shown work done by all the force acting on the particle of mass m in line internalt1 and t2 while a1 is the acceleration at time t1 given by t=0 particle was at rest
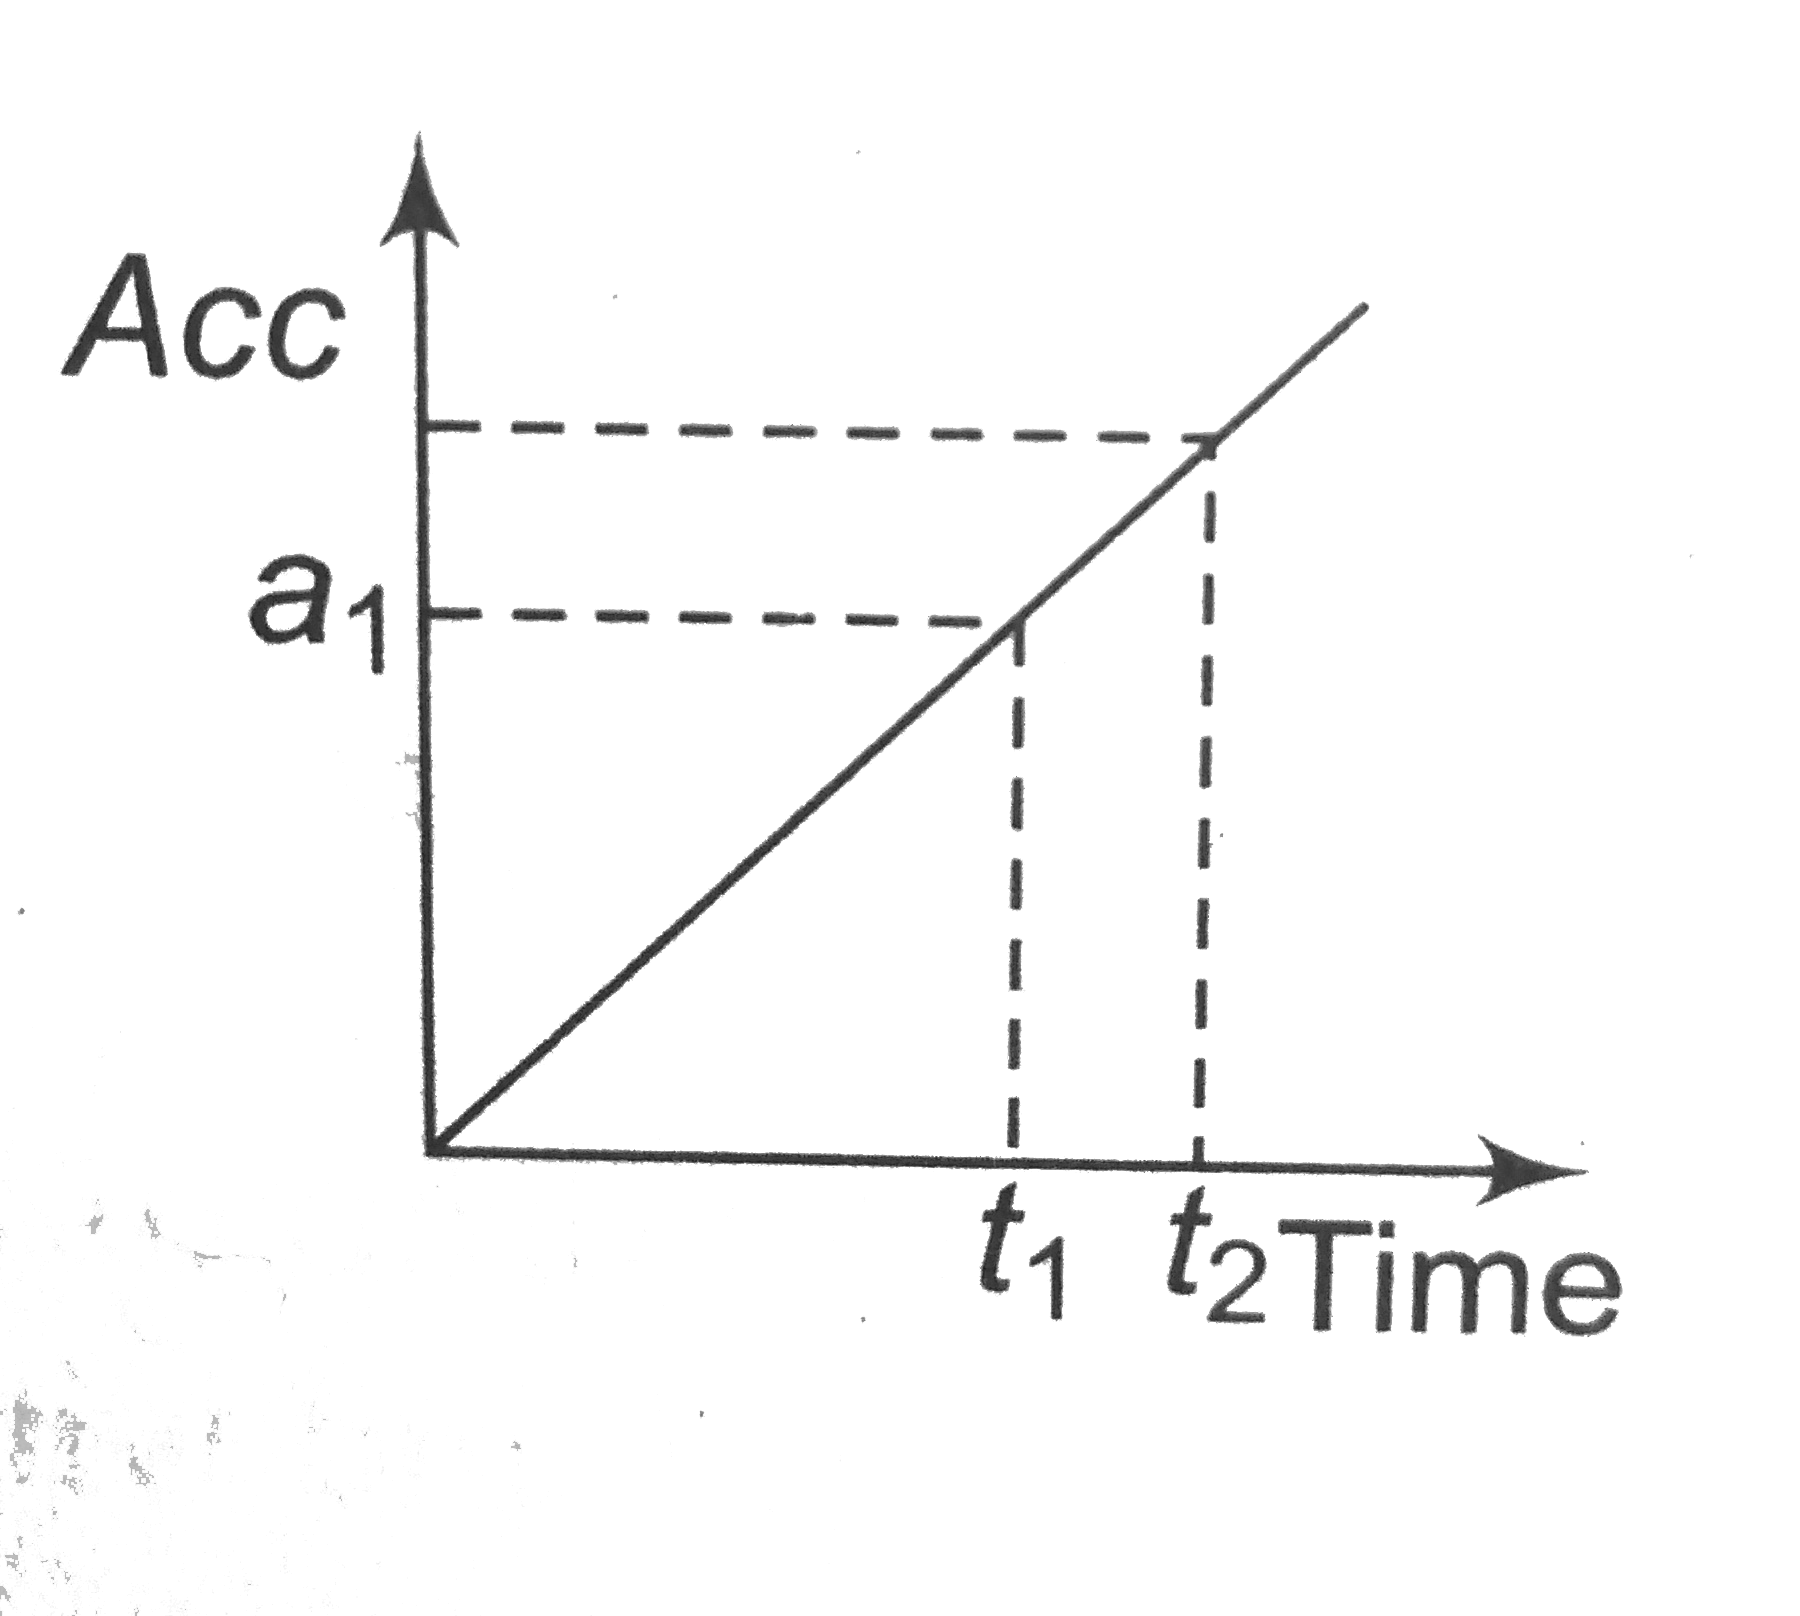 Ama214t1(t32−t21)Bma218t21(t42−t41)Cma214t21(t42−t41)Dma14t1(t22−t21)
Work done by a constant force and Work done by a variable force
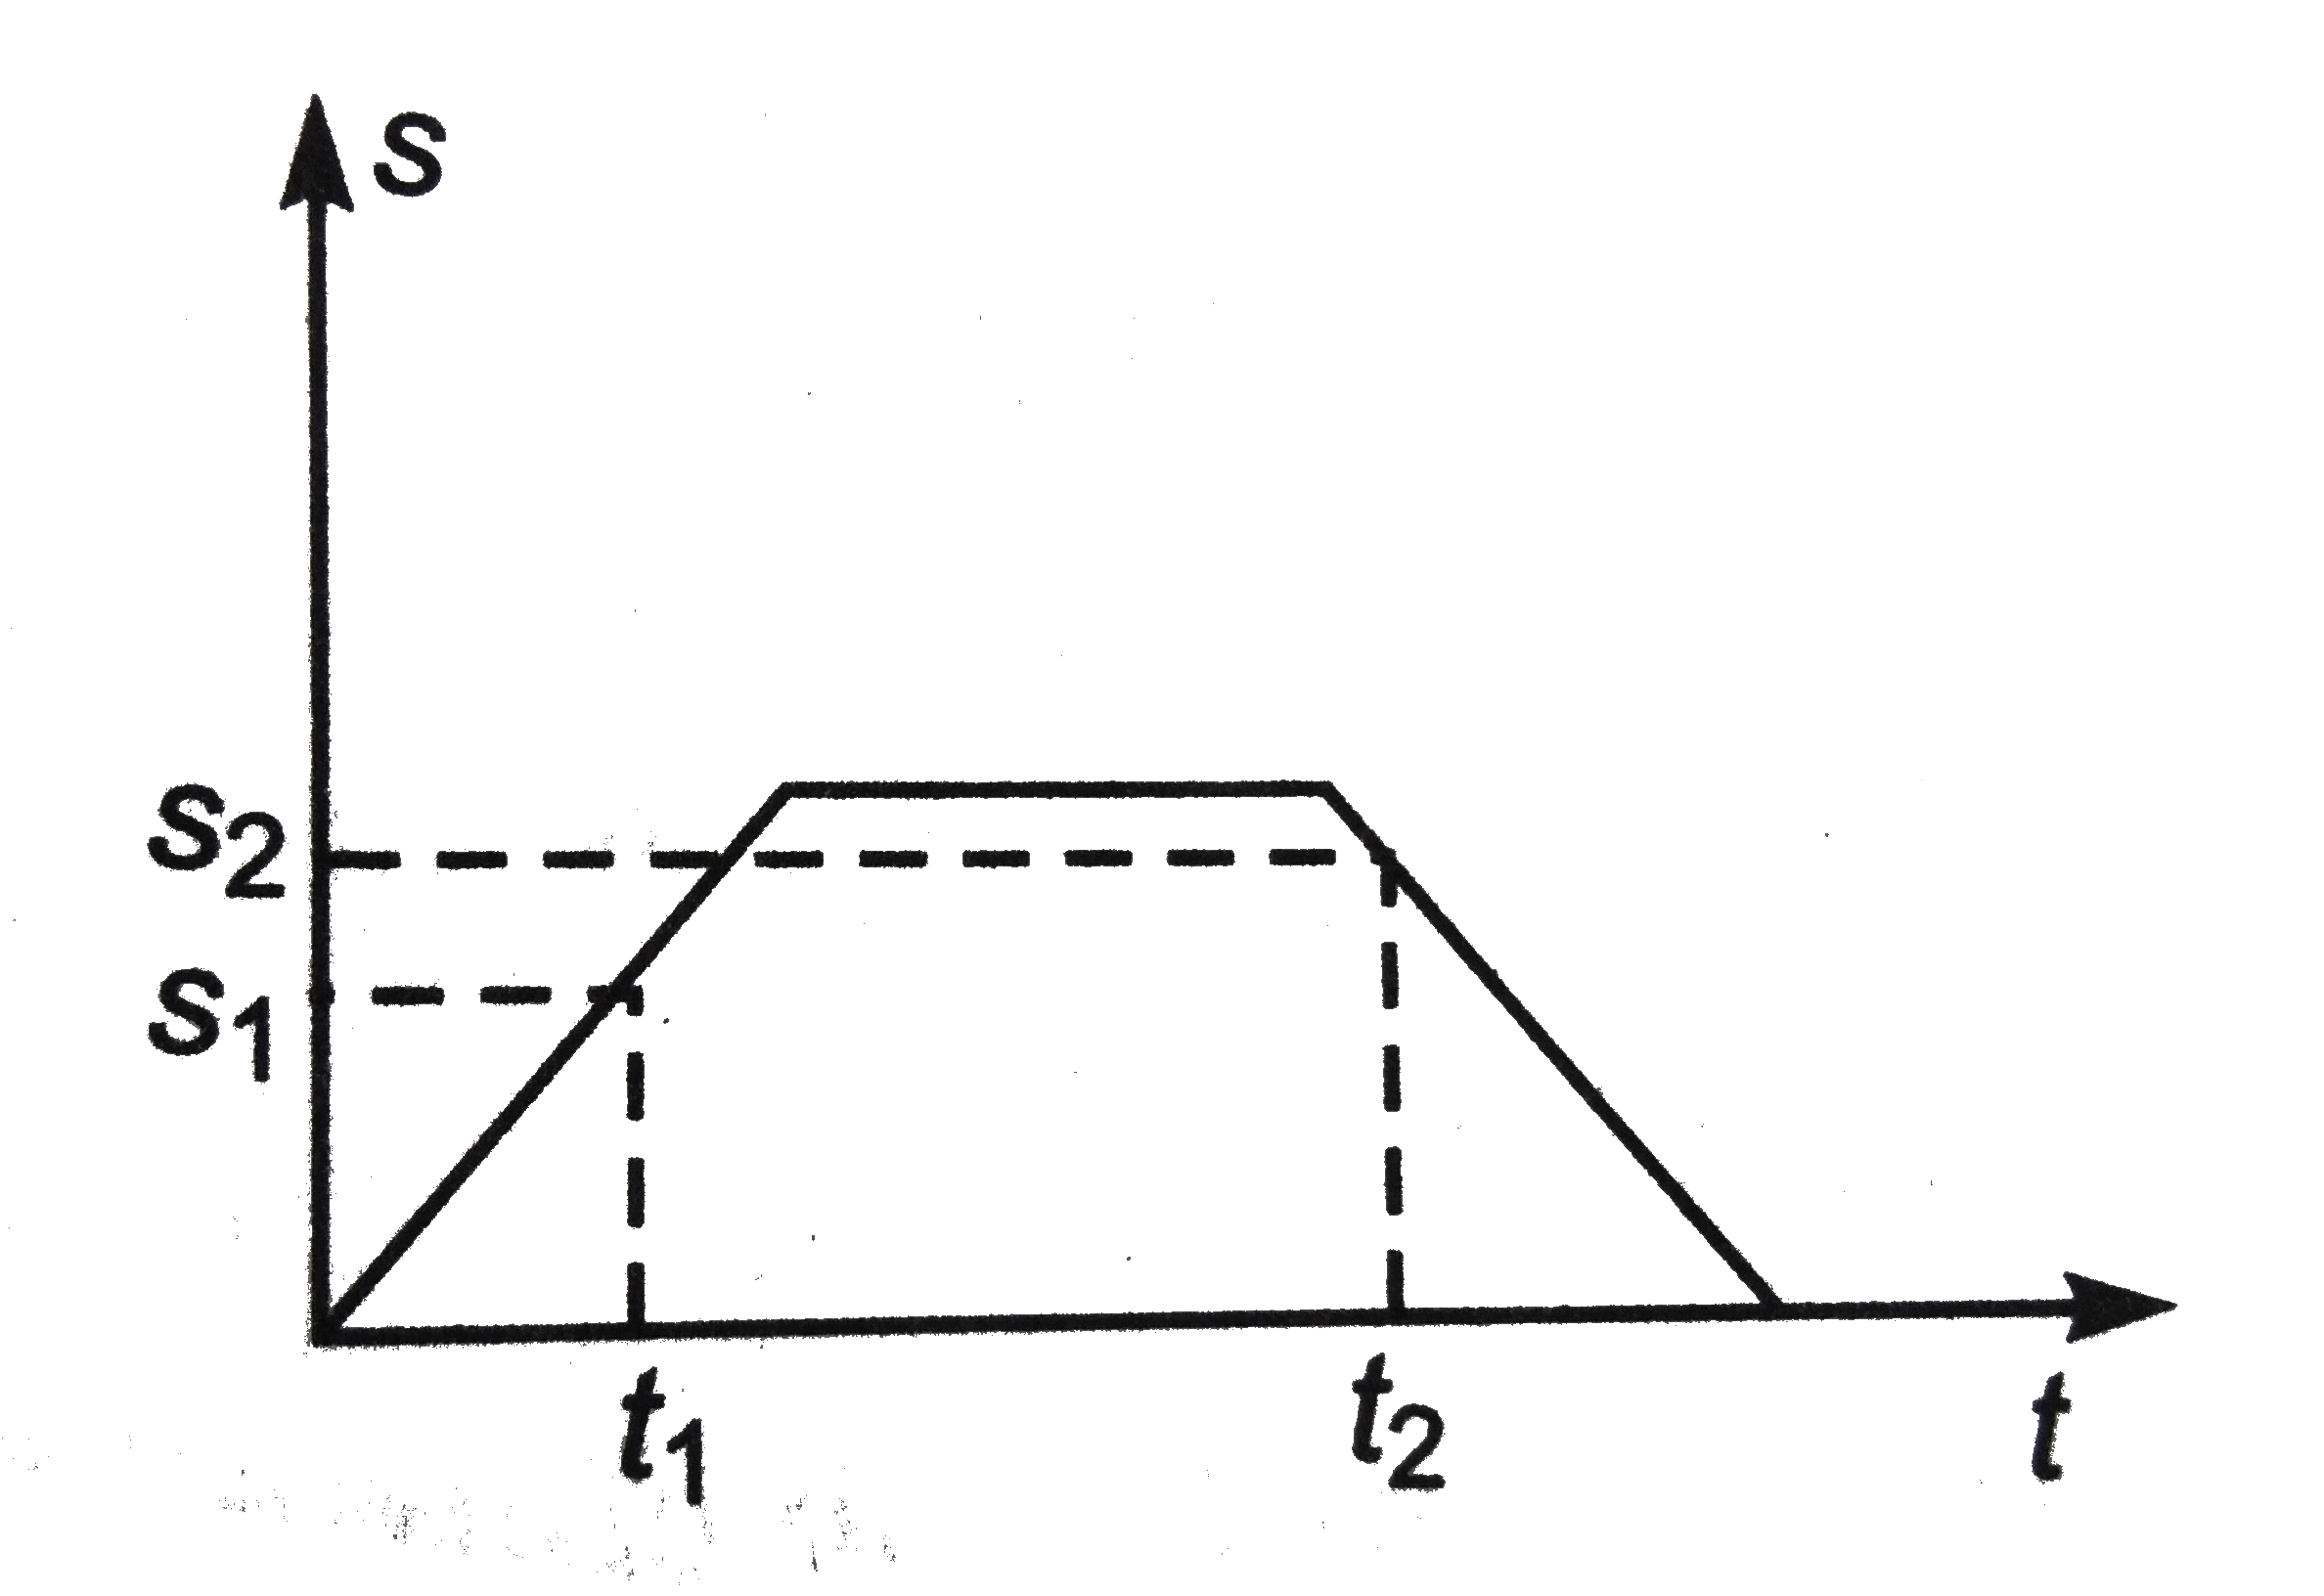
View SolutionAsseration : Displacement time graph of a particle moving in a straight line is shown in figure. Work done by all the forces between time interval t1 and t2 is definitely zero.
 ,
,
Reason : Work done by all the forces is equal to change in kinetic energy.
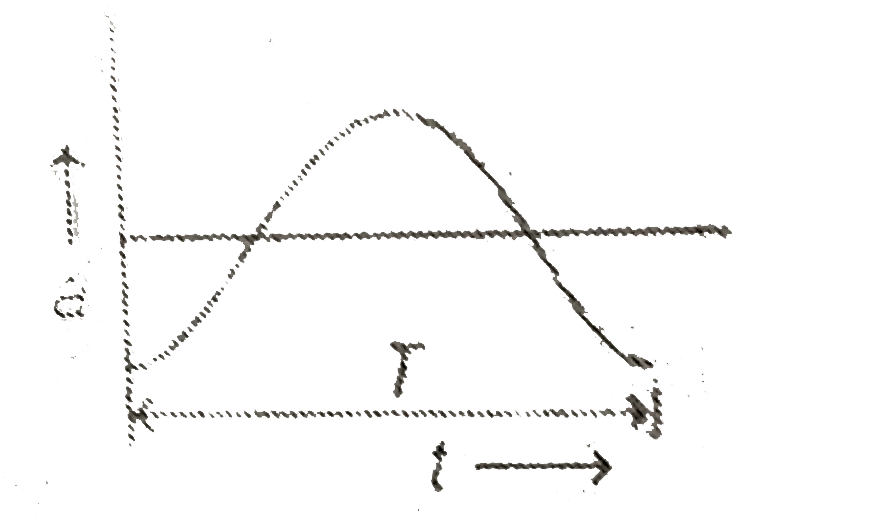
View SolutionAcceleration versus time graph of a body in SHM is given by a curve shown below. T is the time period. Then corresponding graph between kinetic energy KE and time t is correctly represented by
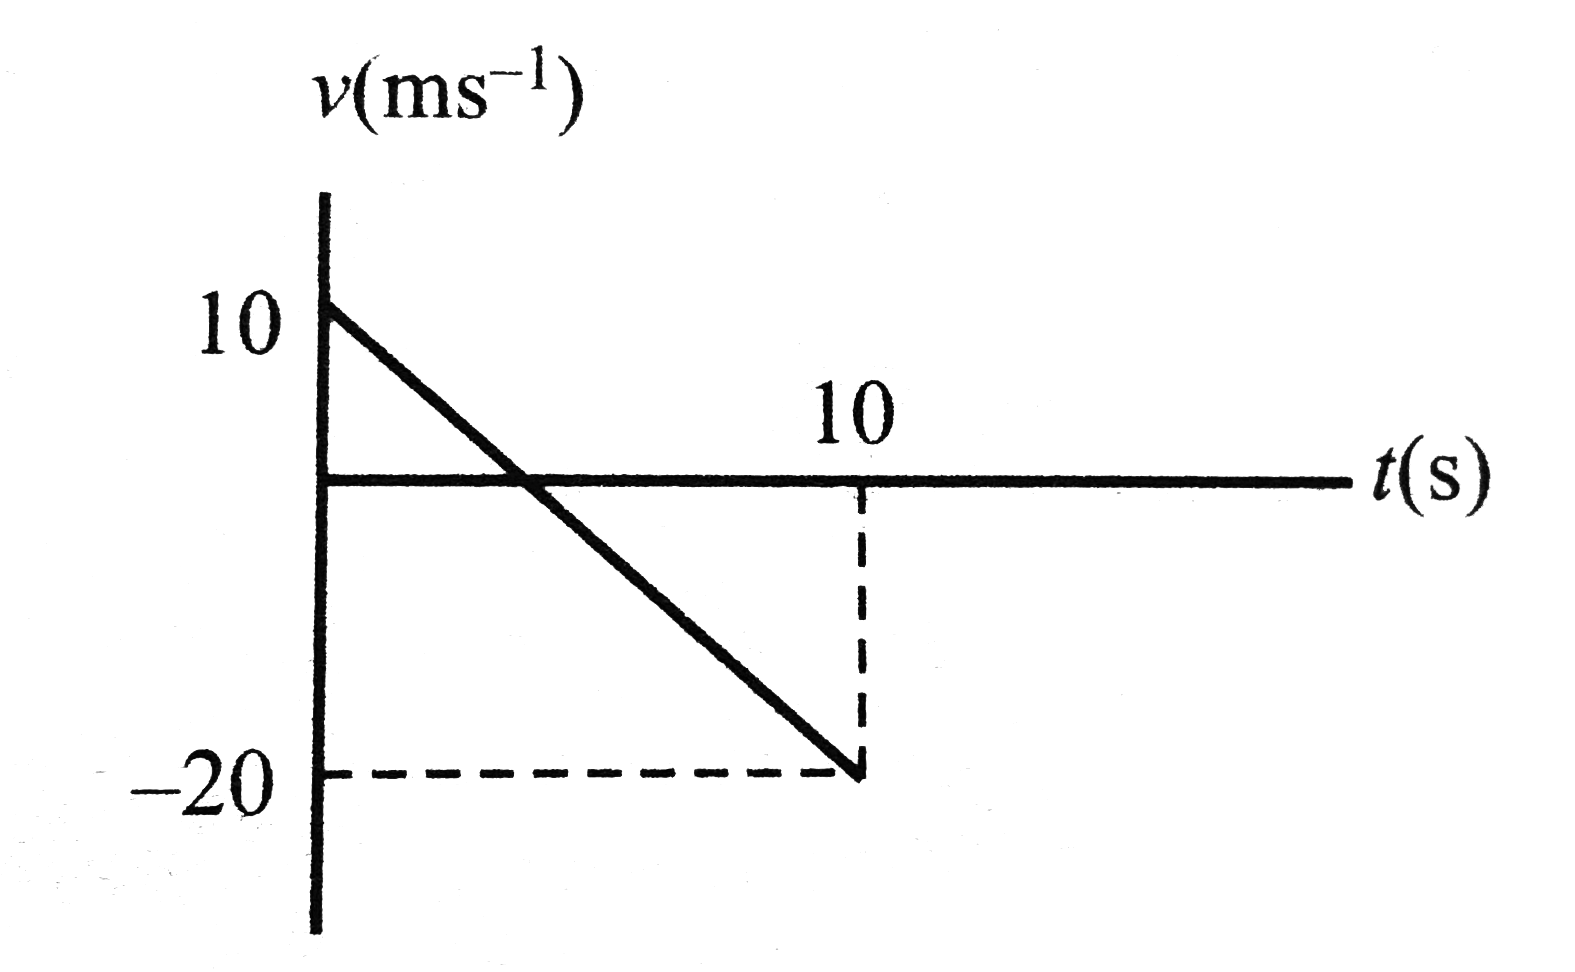
View SolutionVelocity-time graph of a particle moving in a straight line is shown in the figure. Mass of the particle is 2 kg. Work done by all the forces acting on the particle in time interval t = 0 to t = 10 sec is
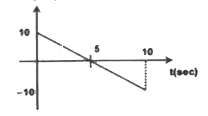
View SolutionThe velocity-time graph of a particle moving in a straight line is shown in figure. The mass of the particle is 2kg. Work done by all the forces acting on the particle in time interval between t=0 to t=10s is
View Solution

