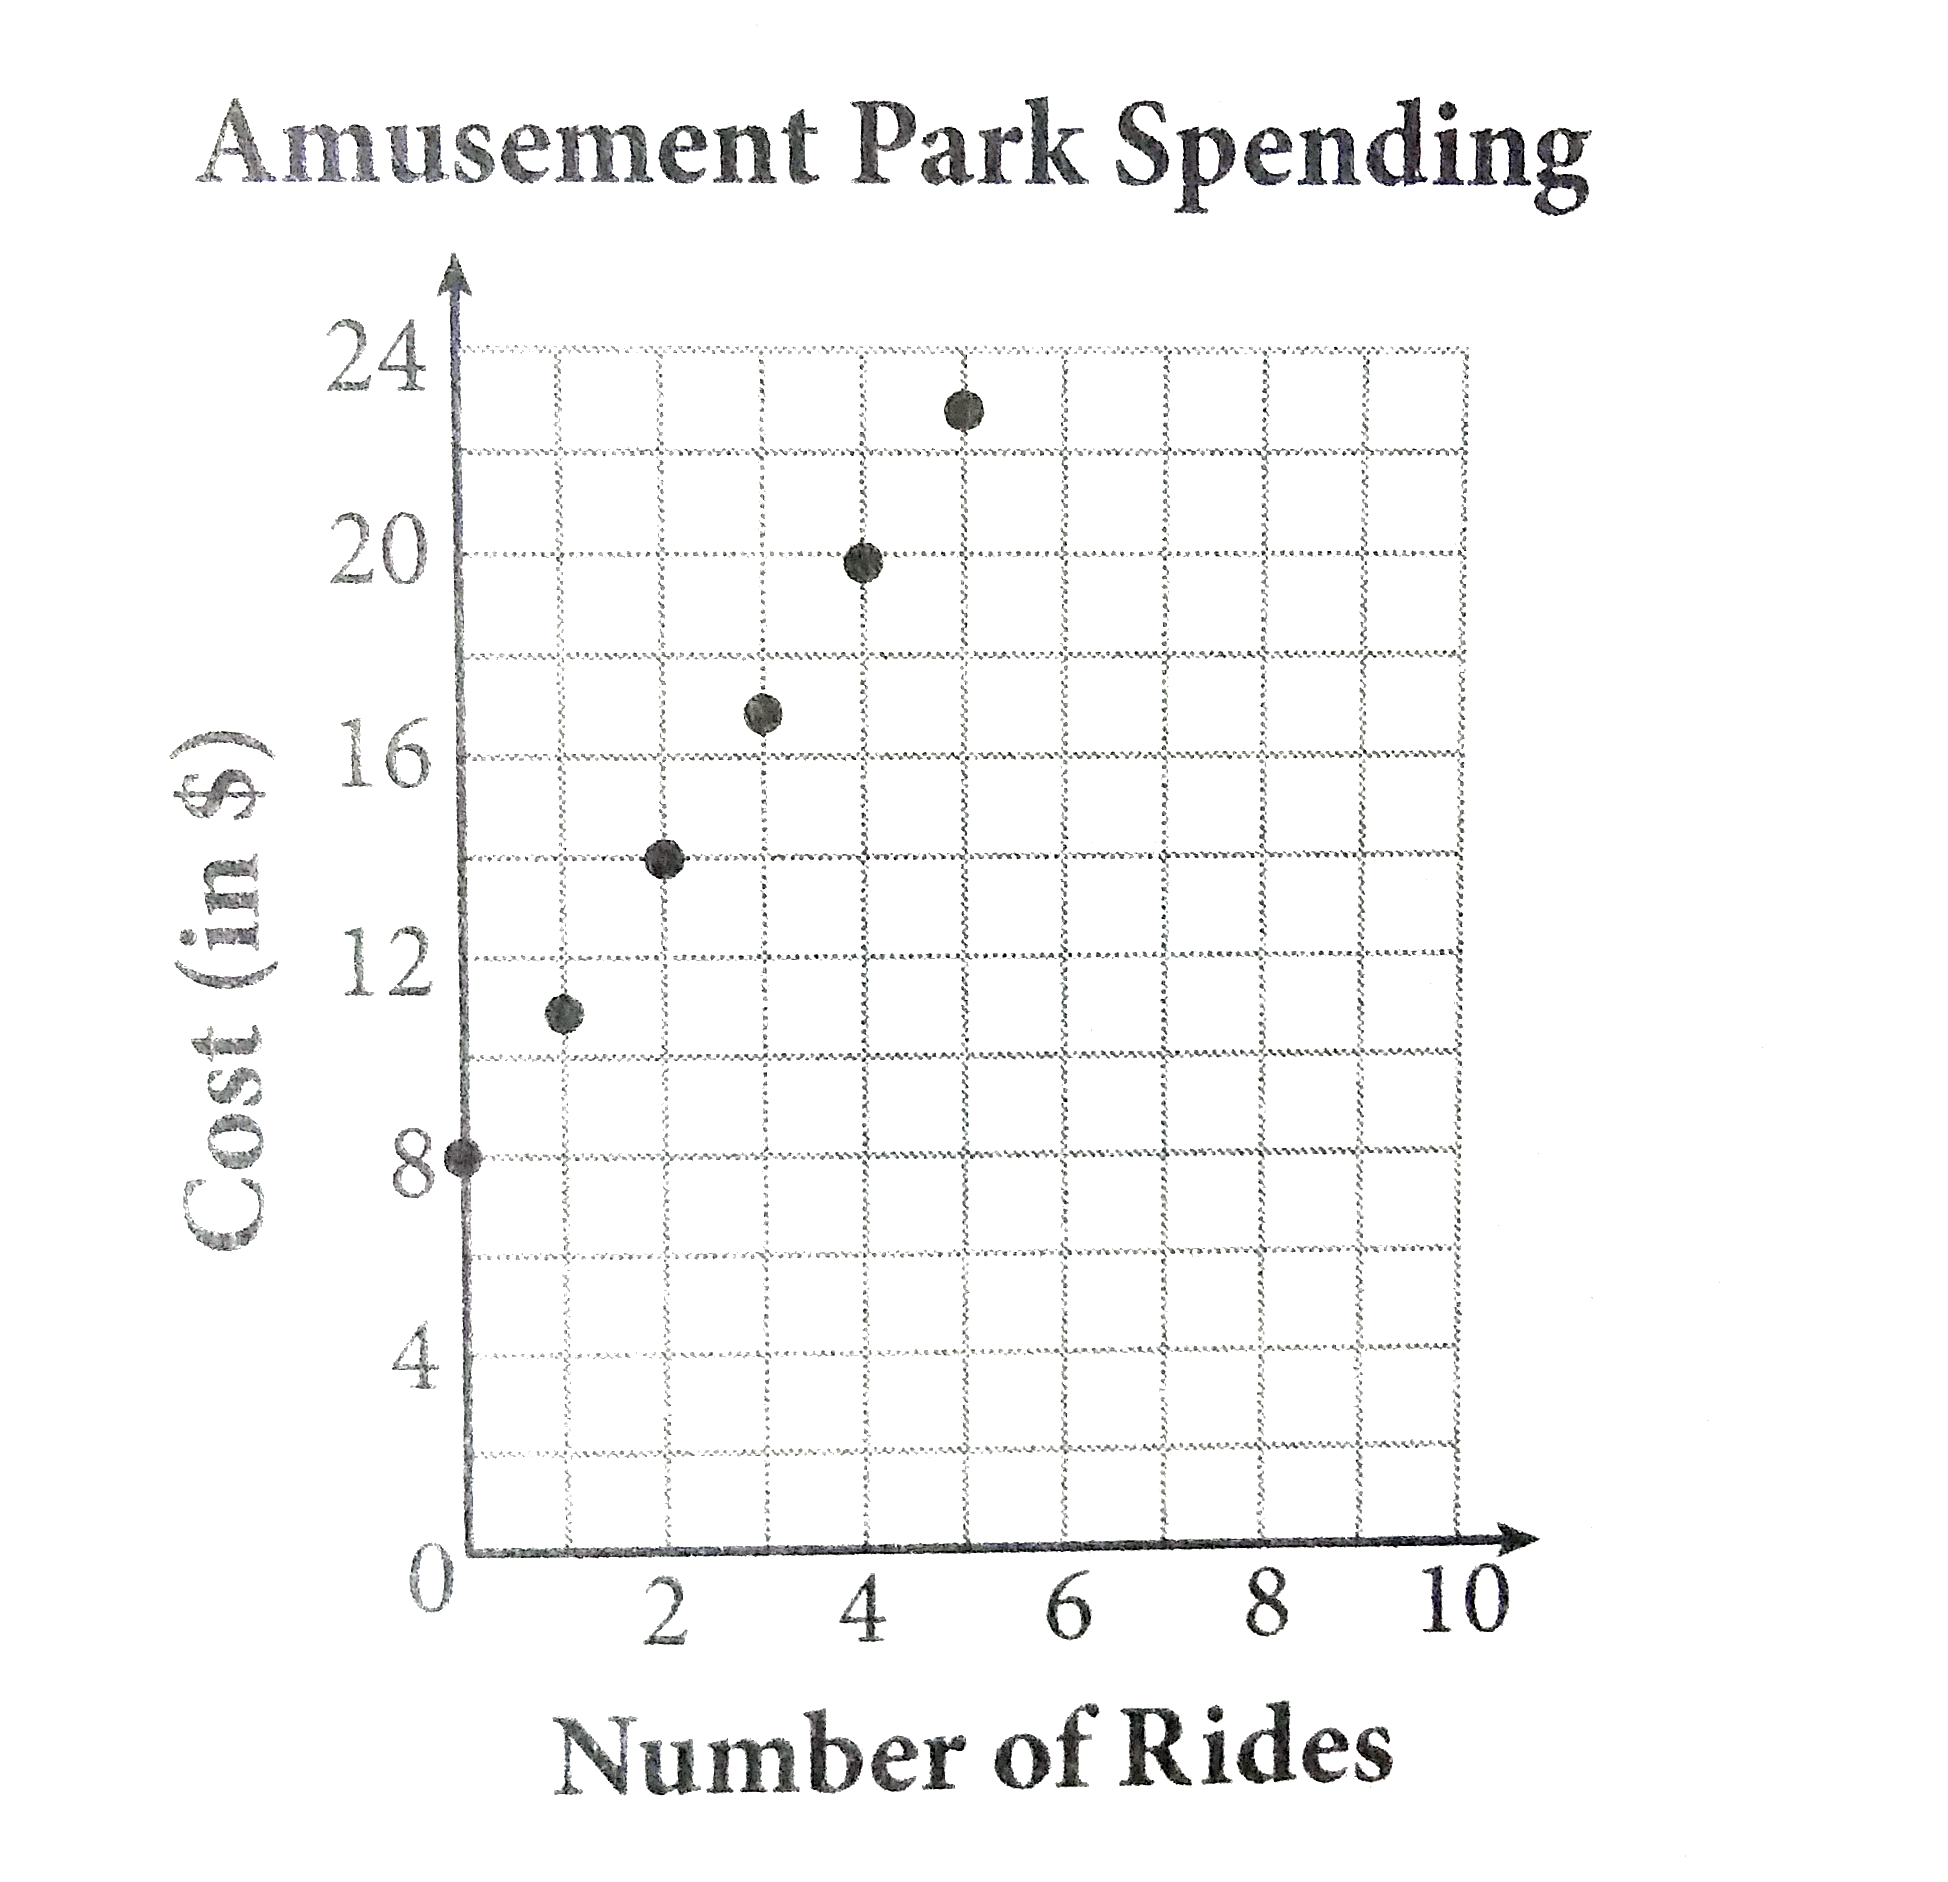
Wesley went to an amusement park with his family. He paid for his own admission ticket and all of the rides he rode. The scatterplot shows possible amounts that he could have paid. If a line of best fit (not shown) is used to model the data, the equation of the line would by y=3x+8. In this scenario, what does 3 represent?
The cost of one ride
The number of rides Wasley rode
The cost of the admission ticket
The number of hours Wesley stayed at the park
The correct Answer is:A
Difficult: Easy
Category: Problem Solving and Data Analysis/ Scatterplots
Strategic Advice: When a linear equation is written in the form y=mx+b, m is the slope and b is the y-intercept. In a real-world scenario, the y-intercept represents a flat fee or a starting amount, and the slope represents a unit rate.
Getting to the Answer: The 3 is the equation is the coifficient of x, so it is the slope of the line of best fir. This means that the number 3 represents a unit rate. Read the axis labels carefully. The numbers of rides are plotted along the horizontal axis, so x represents the number of rides, which means 3 must be the cost per ride, or the cost of 1 ride, which is (A).
Topper's Solved these Questions
Similar Questions
An atchitect is working on a design for a solar power plant. While double-checking the blueprint, he realizes that he has made an error: The solar panels will not fit on the roof unless the dimensions of the roof are increased by 0.5%. Which of the following expresses this change in the dimensions of the roof as a fraction of the original dimensions?
View Solution
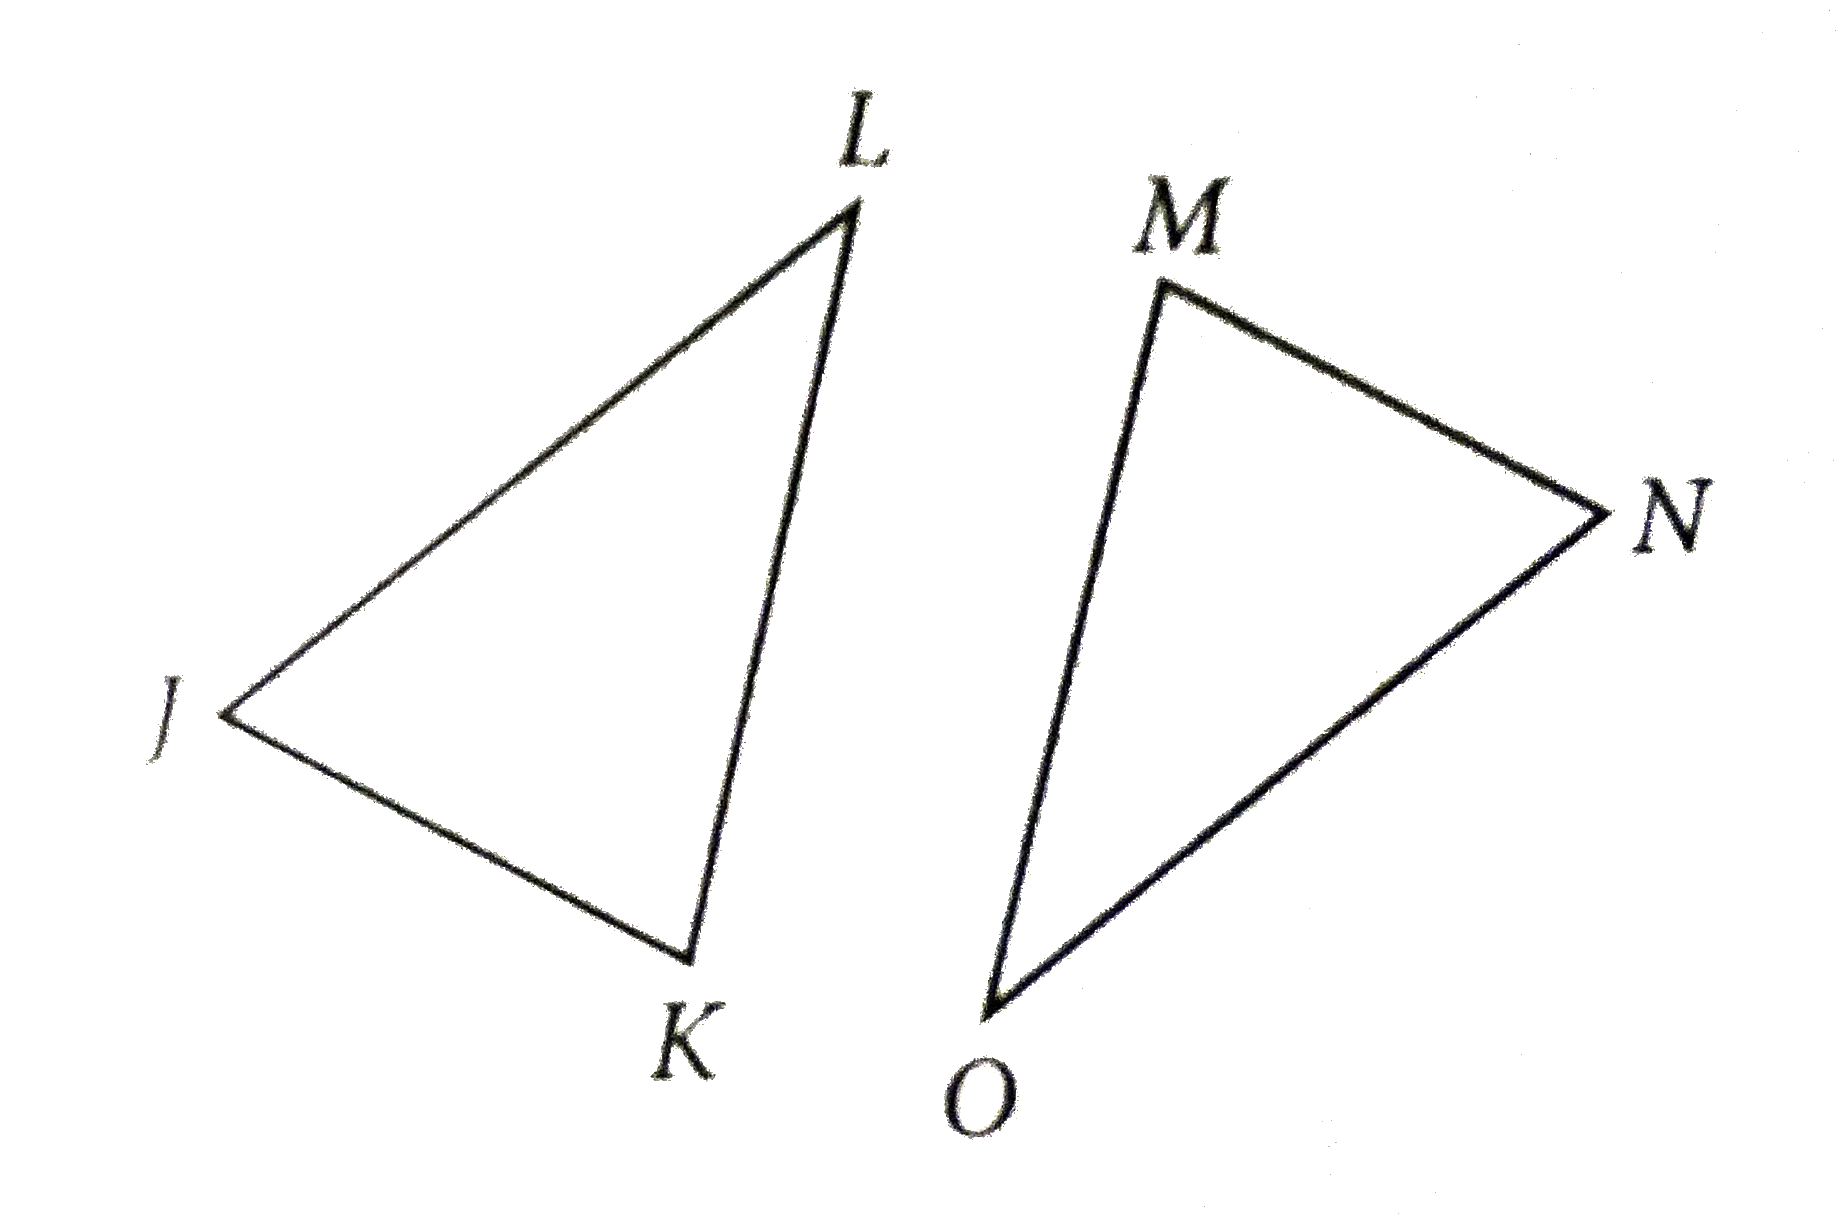
In the diagram above, ¯¯¯¯¯JL=¯¯¯¯¯¯ONand¯¯¯¯¯¯KL=¯¯¯¯¯¯¯OM. Confirmation of which of the following facts would be sufficient to prove that the two triangles are congruent?
View SolutionHow many lines of symmetry does the above figure have ?
View SolutionDetermine the point of symmetry of a regular hexagon.
View SolutionDtermine the images of the following figure about the given line :
View SolutionMatch the following Column A to Column B

View SolutionMatch the following Column A to Column B

View SolutionMatch the following Column A to Column B

View SolutionThe inequation represented by the graph given below is :
View SolutionThe inequation that best describes the graph given below is _________
View SolutionThe inequation that best describes the following graph is _________
View SolutionWhich inequations represent the shaded region in the given figure
View SolutionThe equation of straight line shown in figure is :
ltimg src="https://d10lpgp6xz60nq.cloudfront.net/physics_images/ALN_PHY_R04_E01_020_Q01.png" width="80%"gt
View SolutionWhat is the distance OA for the square shown in figure :- ltimg src="https://d10lpgp6xz60nq.cloudfront.net/physics_images/ALN_PHY_R05_E01_015_Q01.png" width="80%"gt
View SolutionFor shown situation find ∠BCA :-
ltimg src="https://d10lpgp6xz60nq.cloudfront.net/physics_images/ALN_PHY_R05_E01_035_Q01.png" width="80%"gt
View SolutionFind the magnitude of the resultant of shown forces :-
ltimg src="https://d10lpgp6xz60nq.cloudfront.net/physics_images/ALN_PHY_R02_E02_009_Q01.png" width="80%"gt
View Solution
