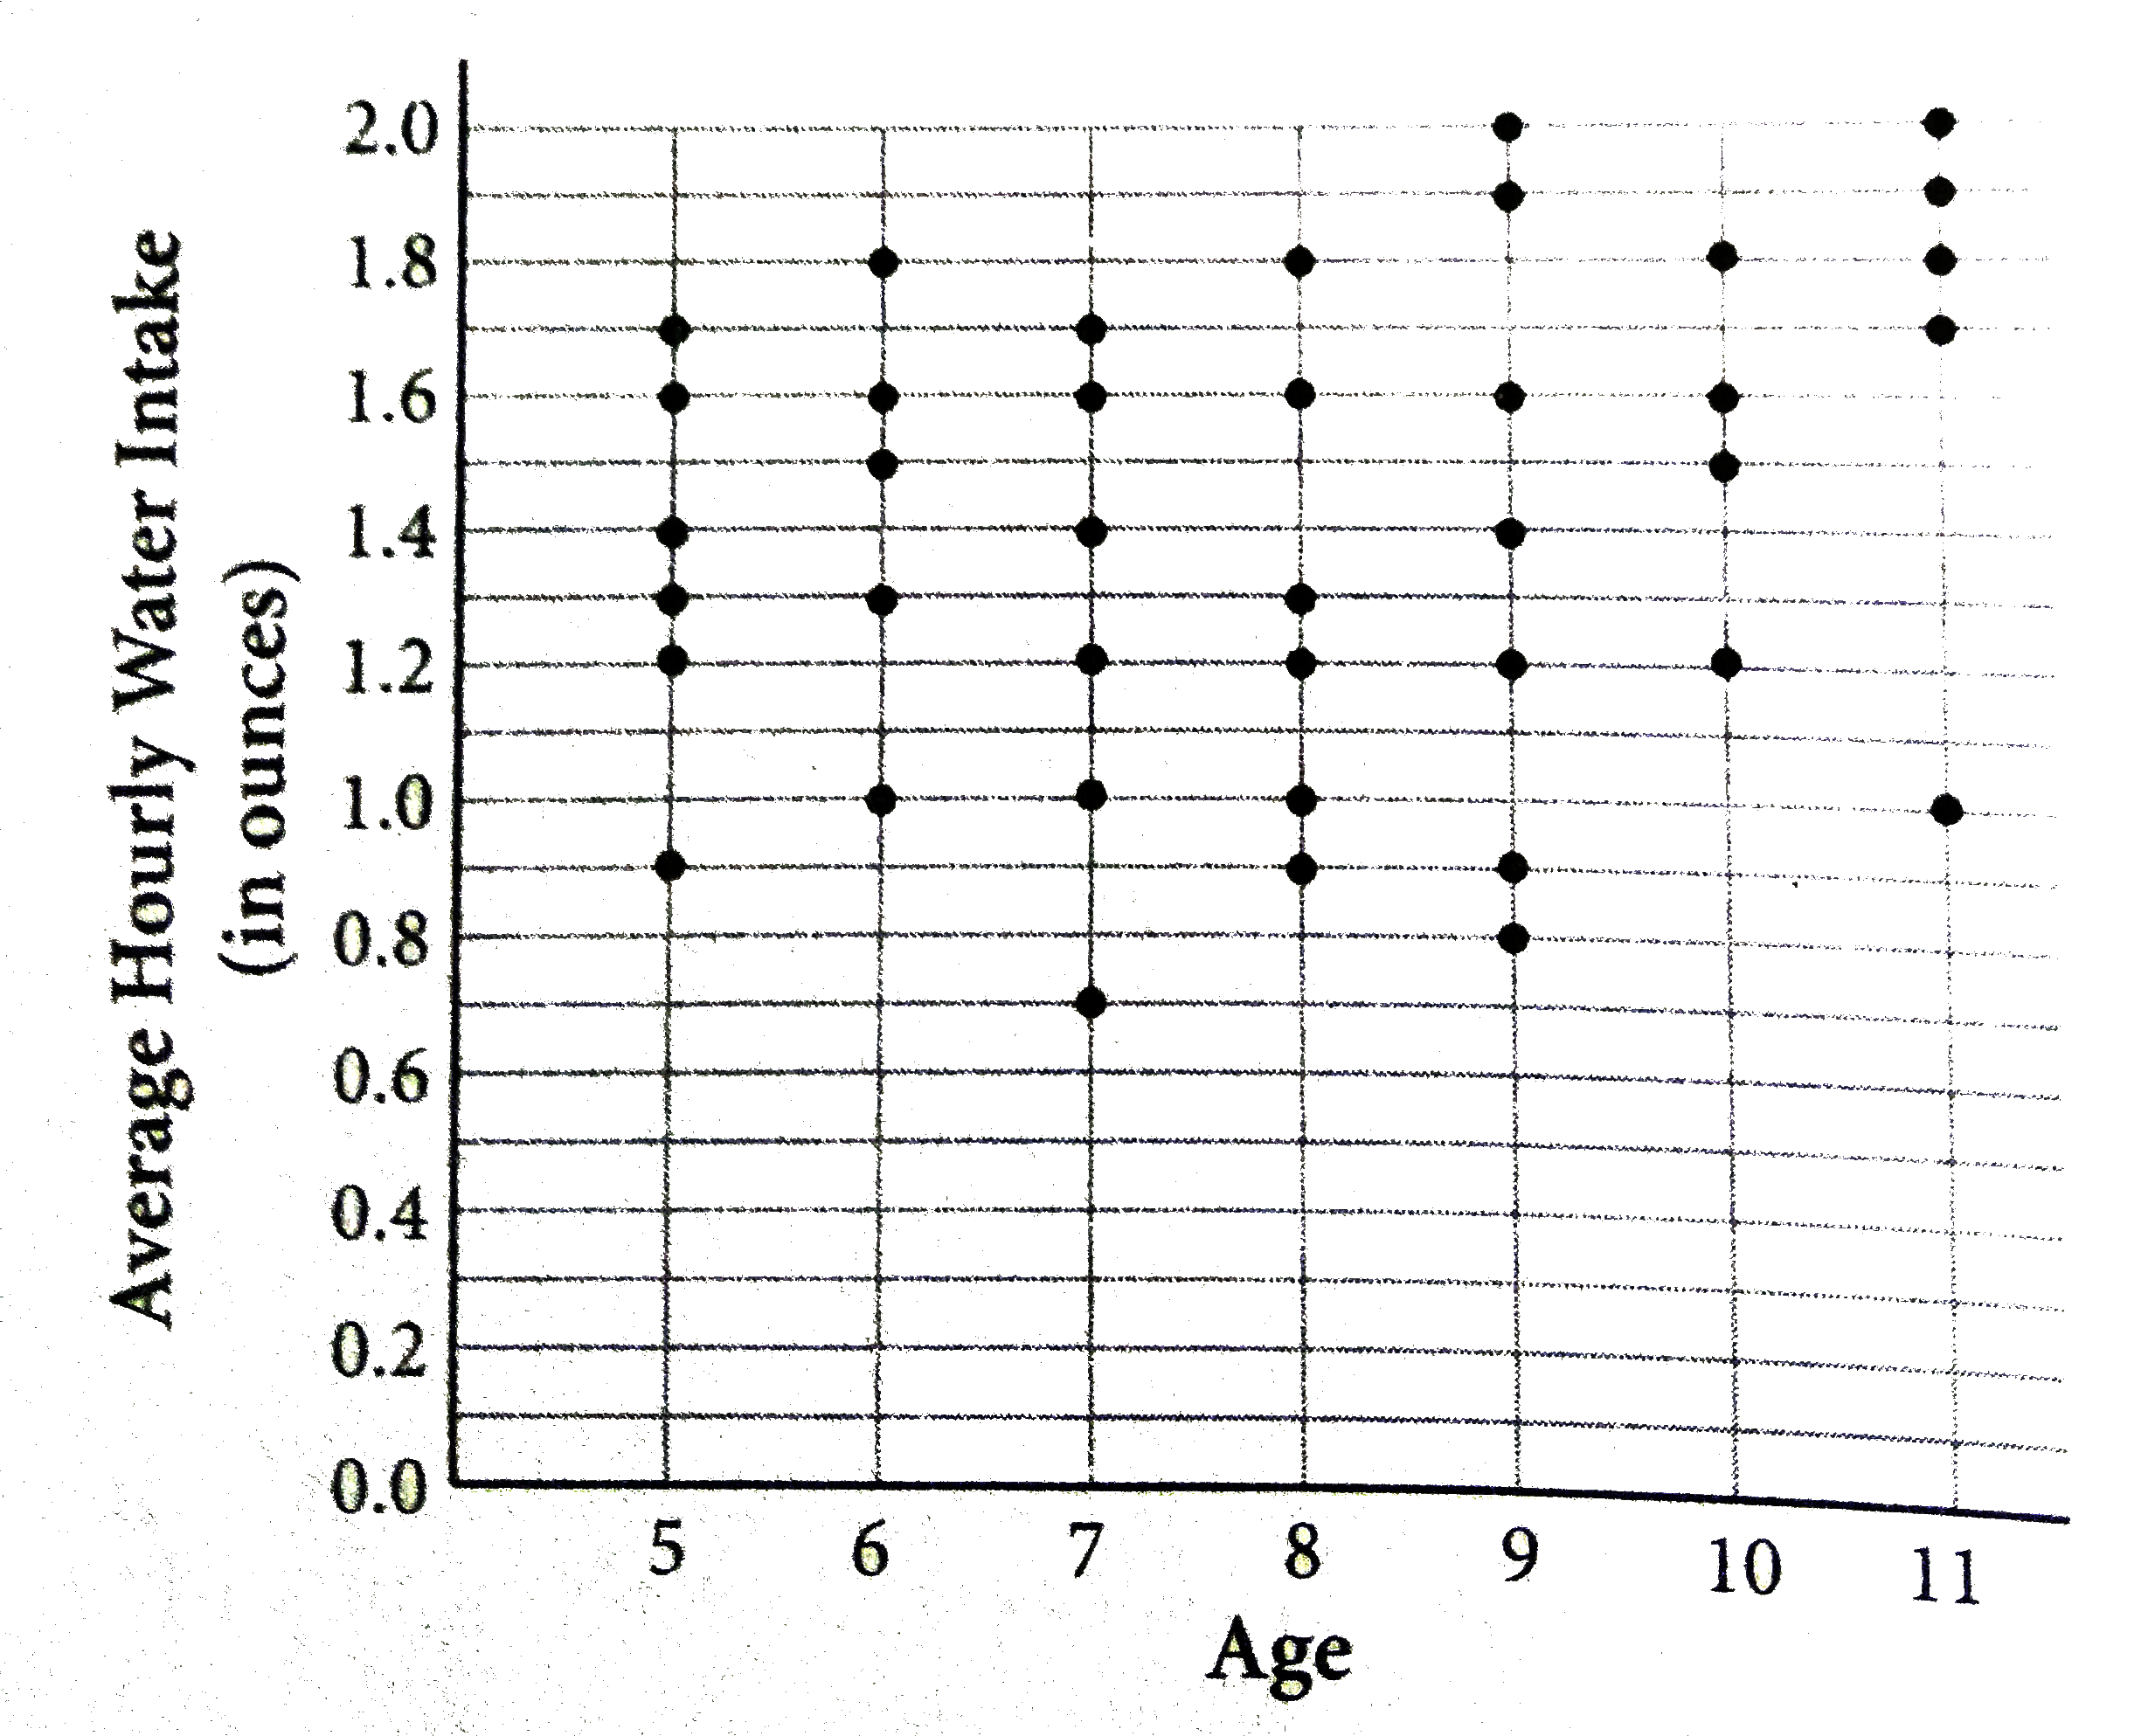
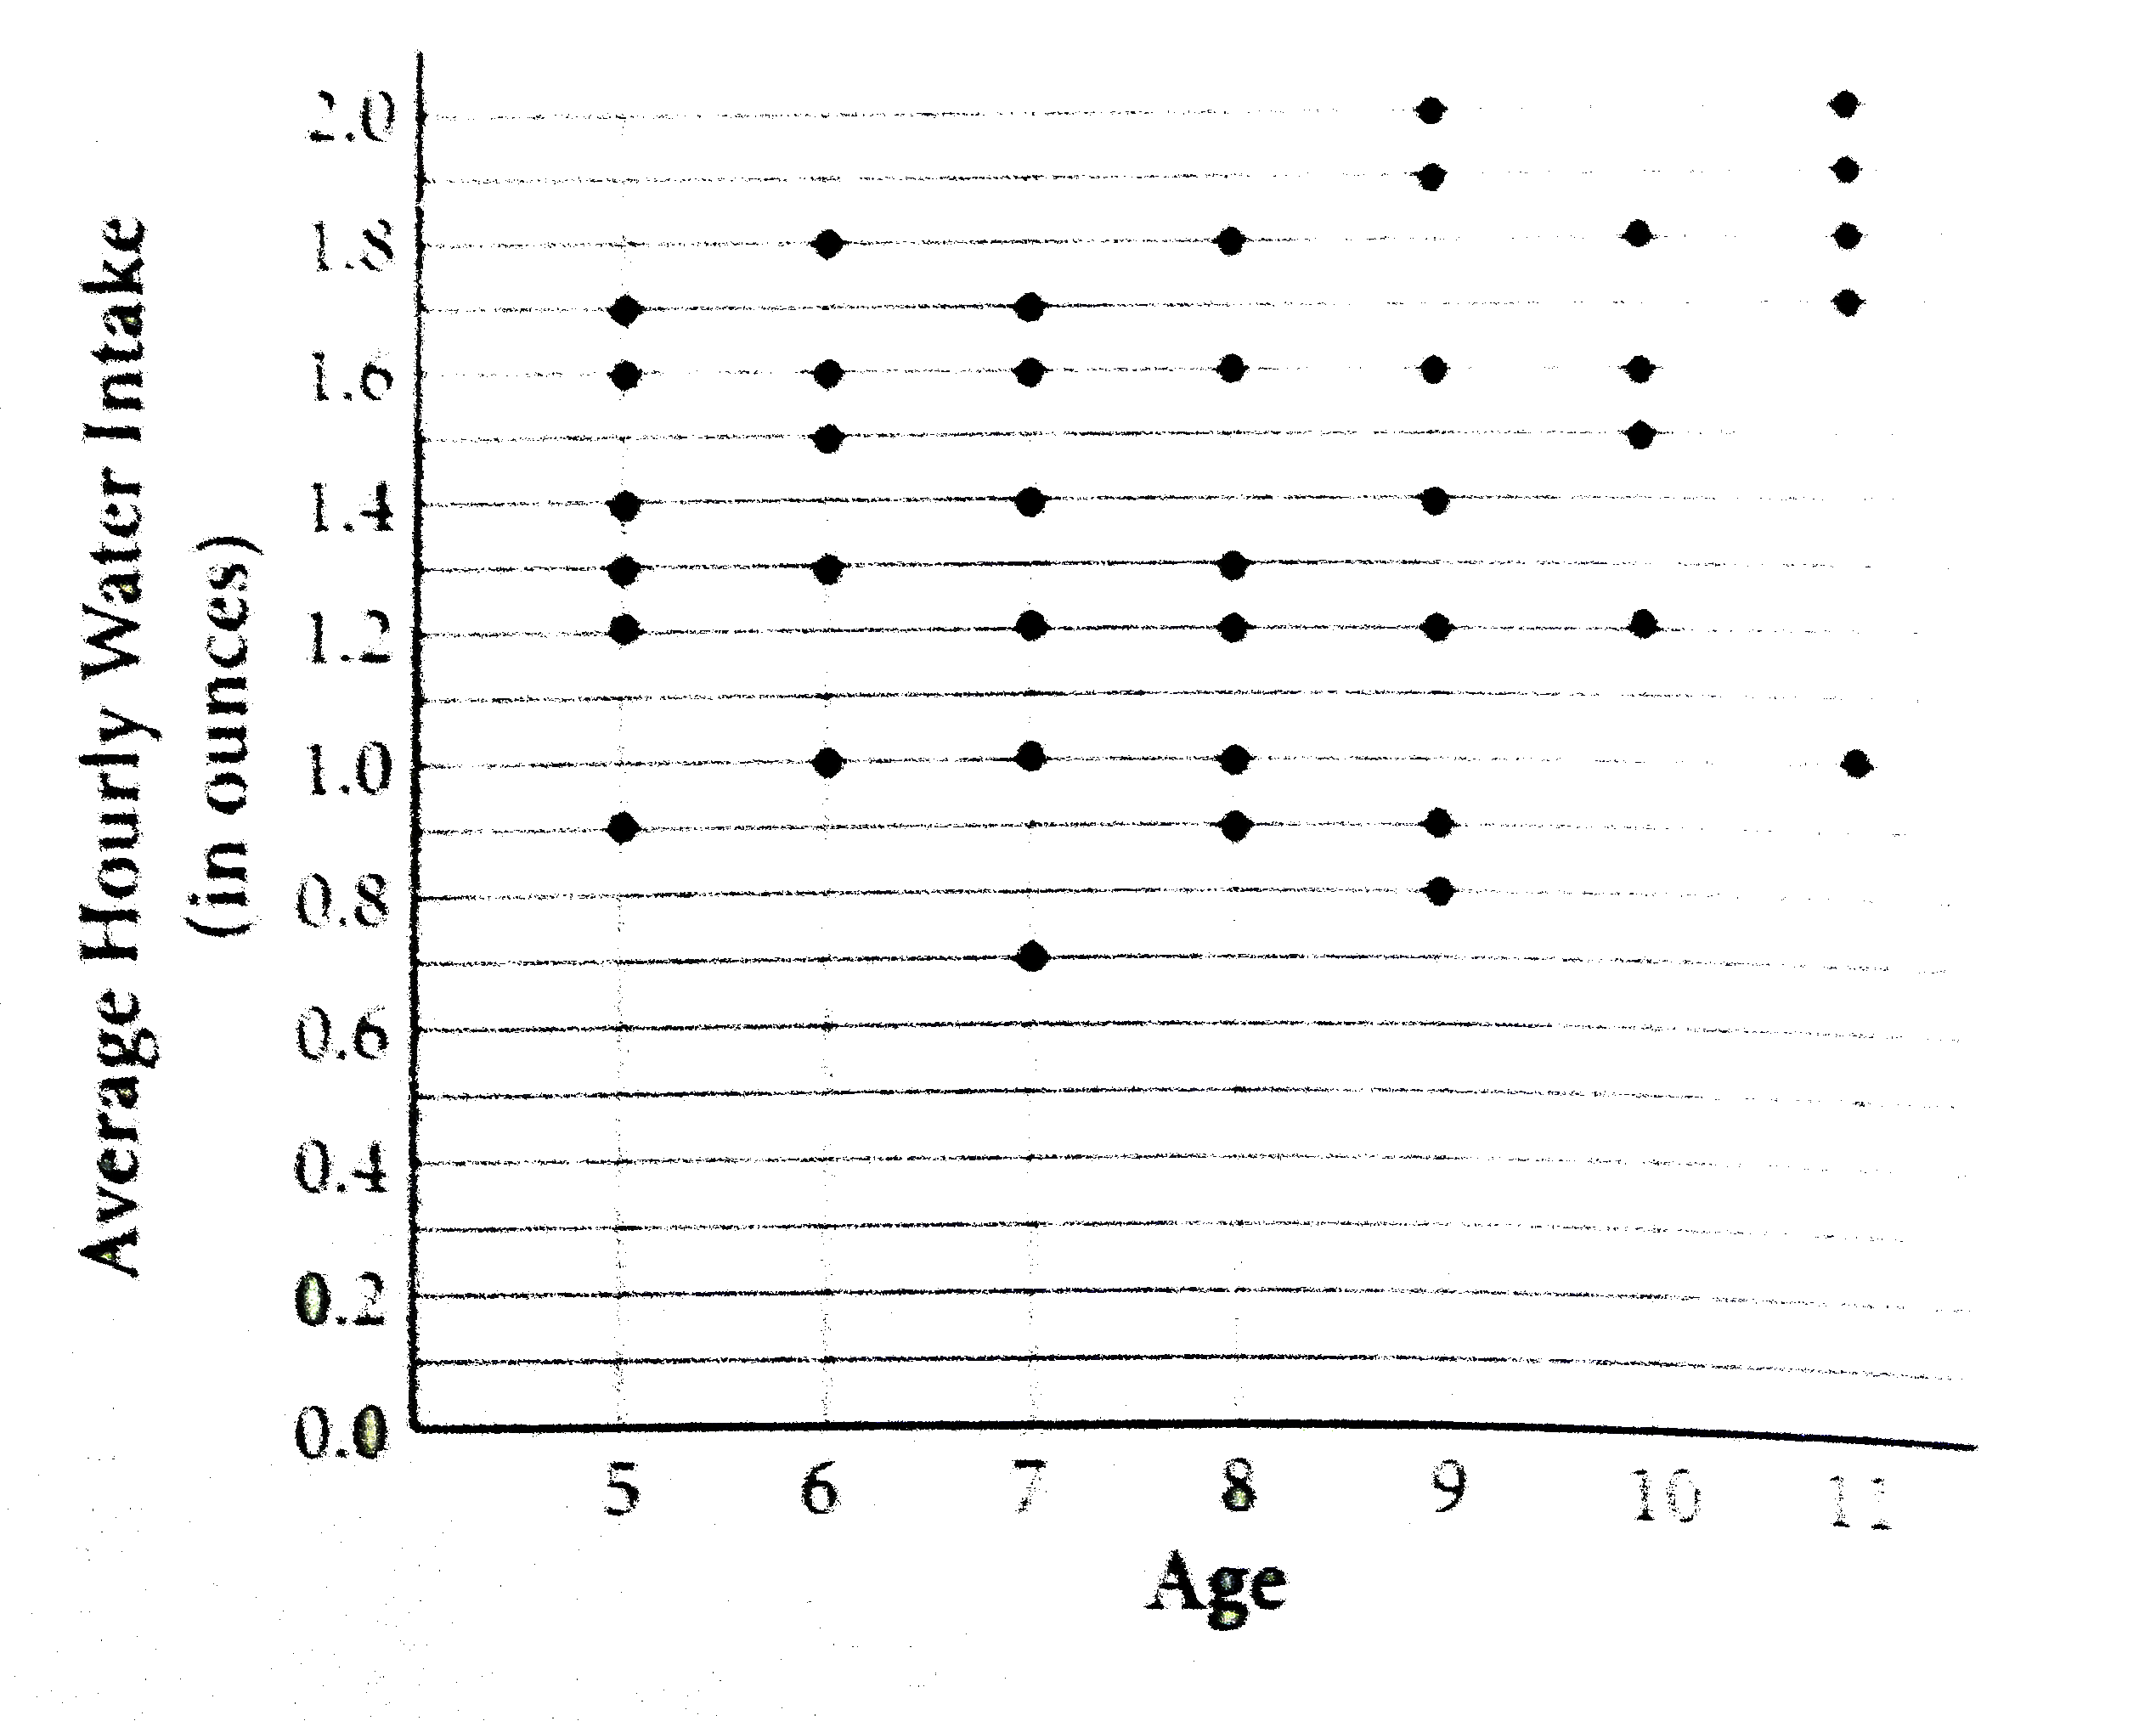
A dietician working in the childrens ward at a hospital is monitoring the water intake of all the patients in the ward. The total water intake for each patient is recorded throughout the day and then averaged over the 24-hour period. The results are recorded in the scatterplot, where each dot represents the average hourly water intake for one child. 
Q. A child between the ages of 5 and 8 should consume at least 1 liter of water per day. Based on the data presented in the scatterplot, what percent of the children, age 5-8, in the ward consumed less than the daily-recommended amount? (Note: There are 24 hours in one day and approximately 33.814 ounces is 1 liter.)
0.35
0.6
0.7
0.85
The correct Answer is:B
Difficult: Hard
Category: Problem Solving and Data Analysis/ Scatterplots
Strategic Advice: Always pay carefull attention to the units when examining a scatterplot. Here, the daily recommended amount of water is given in liters per day: the data is given in ounces per hour. You'll need to convert the units before you can answer the question. Also make sure you're only including data from ages 5-8.
Getting to the Answer: Start by converting 1 liter per day to ounces per hour. Use the factor-label method to keep your calculations organized:
1L1day×33.814oz1L×1day24h=1.41 oz per hour.
To find the percent of the children, ages 5-8 , in the ward that consumed less than this amount divide the number of dots that are below 1.41 (including those right on the 1.4 line) for ages 5-8 by the total number of dots for ages 5-8. The result is 1423=0.6087, which is closet to 60%. This means (B) is correct.

Topper's Solved these Questions
Similar Questions
A dietician working in the childrens ward at a hospital is monitoring the water intake of all the patients in the ward. The total water intake for each patient is recorded throughout the day and then averaged over the 24-hour period. The results are recorded in the scatterplot, where each dot represents the average hourly water intake for one child.

Q.Which of the following ages has the greatest range of values for the average hourly water intake?
View SolutionWater retention or puffiness due to high salt intake occurs due to:
View Solution
Knowledge Check
Intake of low fibre diet leads to
AIndigestionBConstipationCDiarrhoeaDVomitingThe "rush" is produced by the intake of:
ASedativesBopiatesCstmulantsDcocaineIf proten intake is deficient in spite of normal caloric intake it leads to
AMarasmusBKwashiorkorChypercholesterolemiaDunder utrition
Intakes of ORS inhibits the secretion of
View SolutionThe following table shows the number of patients of differents age groups admitted to a hospital for treatement on a day. Find the median age of the patients.

View SolutionIntakes of ORS inhibits the secretion of
View SolutionThe continuous and excessive intake of alcohol causes
View SolutionCirrhosis of liver is caused due to the intake of
View Solution
