The graph shown below is a graph between work done on the gas versus heat supplied to it. Different lines OA, OB, OC, OD represent different processes on monoatomic gas or a diatomic gas. Match the correct process with the line.
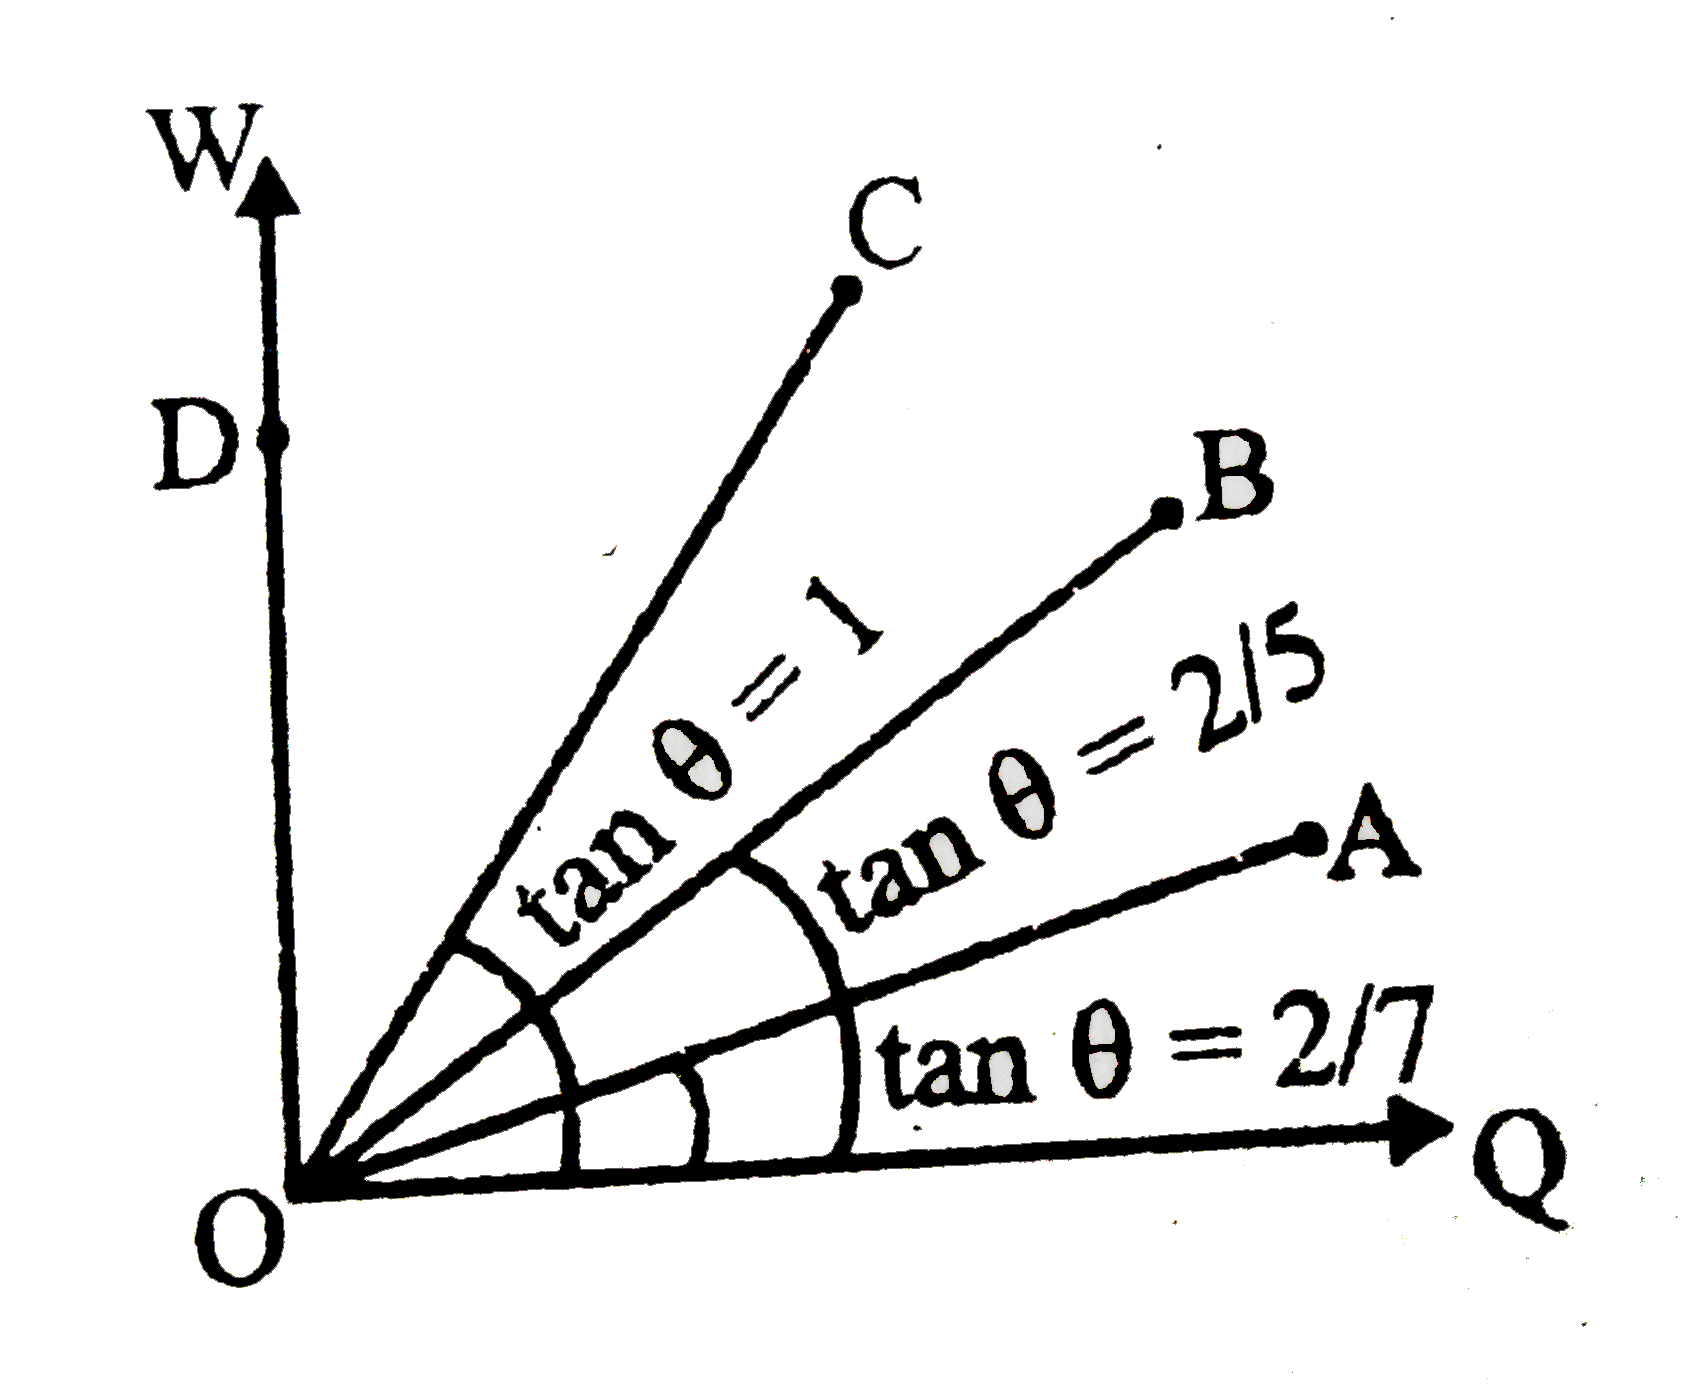
List IList IIP. OA1. Adiabatic ProcessQ. OB2. Isobaric process for monoatomic gasR. OC3. Isothermal processS. OD4.Isobaric process for diatomic gas
P-4,Q-2,R-s,S-1
P-3,Q-4,R-1,S-2
P-4,Q-3,R-2,S-1
P-2,Q-1,R-4,S-3
The correct Answer is:A
Adiabatic ⇒Q=0
S→1
Isothermal ⇒Q=W
R→3
Isobaric mono Q=52nRT
W=nRT
W=25Q
Q→2
Isobaric di. Q=72nRT
w=27Q
=4
Topper's Solved these Questions
- BOOK - BANSALCHAPTER - TEST PAPERSEXERCISE - PHYSICS PART (A)32videos
TEST PAPERS
- BOOK - BANSALCHAPTER - TEST PAPERSEXERCISE - PHYSICS PART (B)3videos
TEST PAPERS
- BOOK - BANSALCHAPTER - TEST PAPERSEXERCISE - PHYSICS PART- C4videos
TEST PAPERS
- BOOK - BANSALCHAPTER - SEMICONDUCTORSEXERCISE - CBSE Question32videos
SEMICONDUCTORS
Similar Questions
The straight lines in the figure depict the variations in temperature ΔT as a function of the amount of heat supplied Q is different process involving the change of state of a monoatomic and a diatomic ideal gas . The initial states, (P,V,T) of the two gases are the same . Match the processes as described, with the straight lines in the graph as numbered.
_E01_155_Q01.png)
Column-IColumn-II(A)Isobaric process of monoatomic gas.(p)1(B)Isobaric process of diatomic gas(q)2(C)Isochoric process of monoatomic gas(r)Minimum at section B(D)Isochoric process of diatomic gas(s)x-axis (i.e.'Q' axis)View SolutionV-T graph of a process of monoatomic ideal gas is shown in figure.
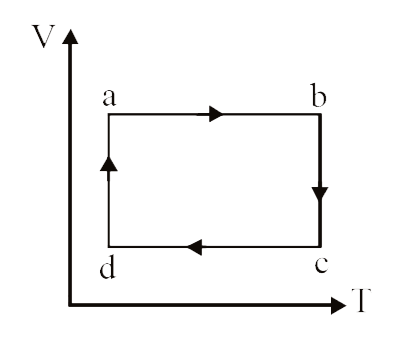
Heat is supplied to the gas in process(s)-View Solution
Knowledge Check
- Question 1 - Select One
In a isobaric process the work done by a di-atomic gas is 10 J , the heat given to the gas will be :
A35 JB30 JC45 JD60 J - Question 2 - Select One
graph of an ideal gas is as shown in figure.
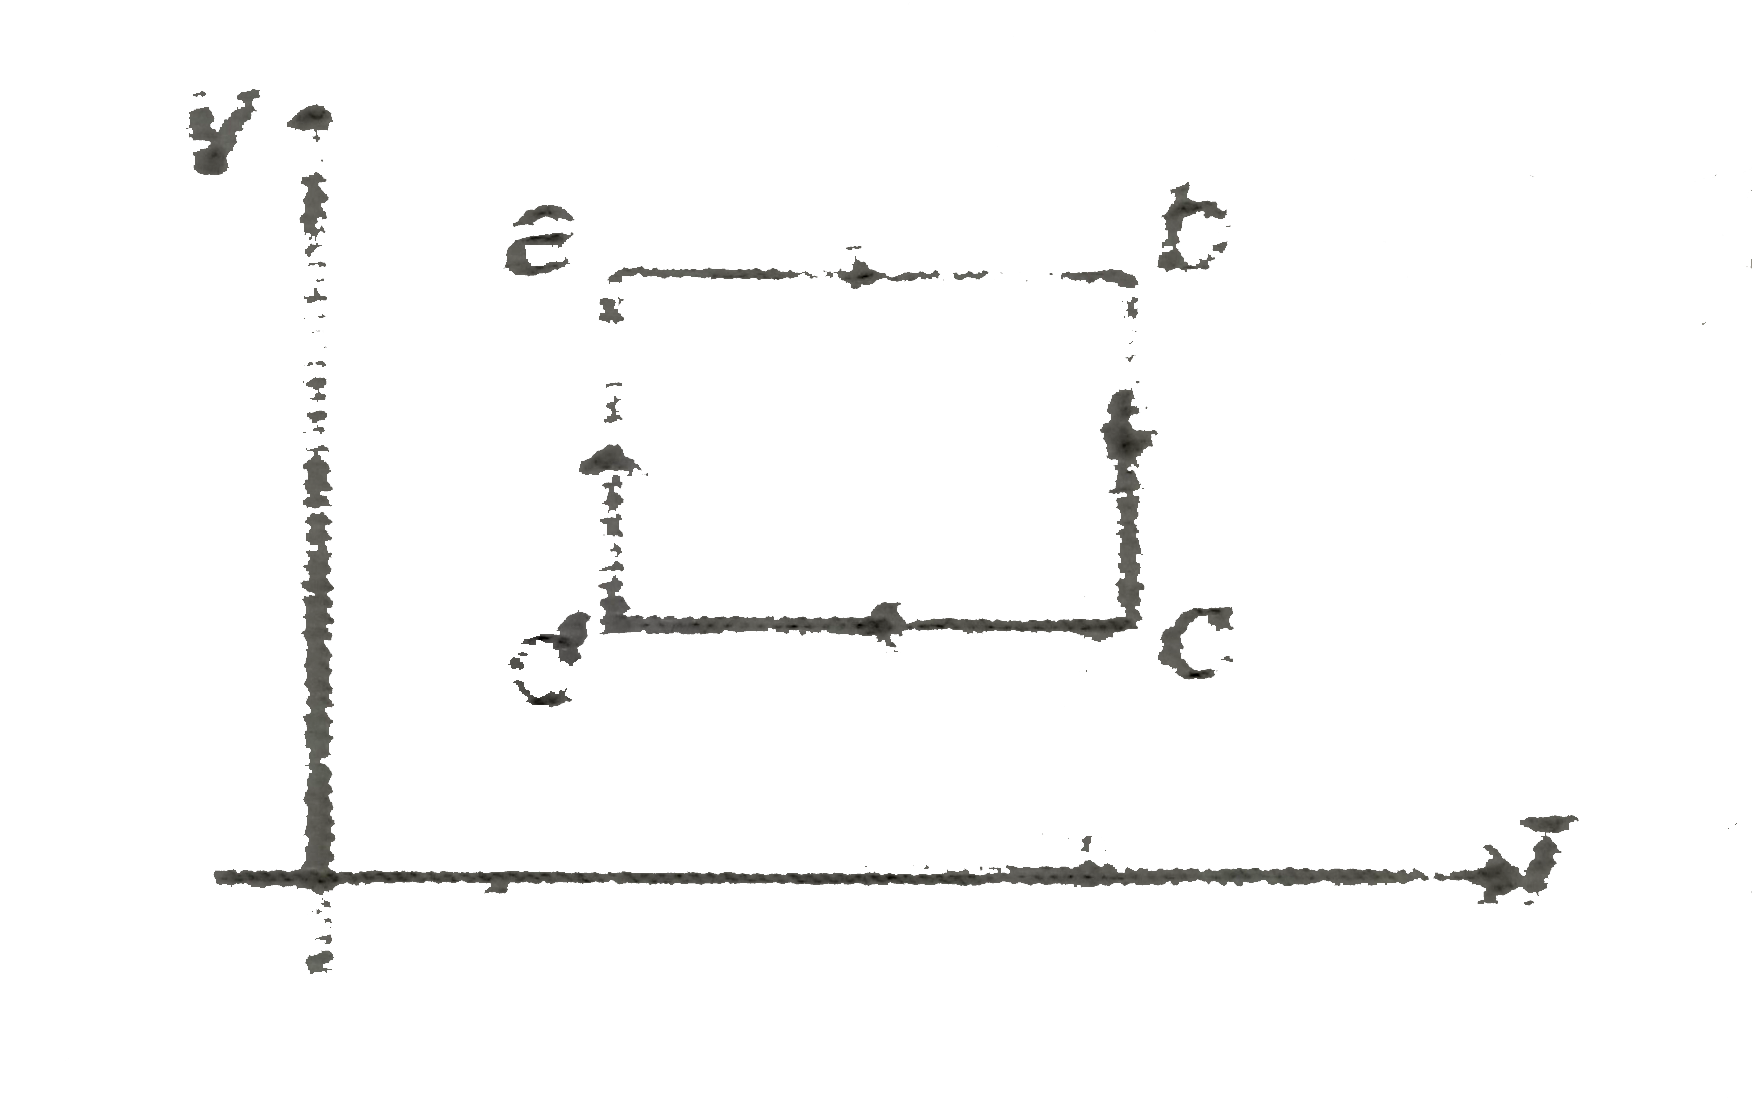
Heat is supplied to the gas in process (s).Ada, ab and bcBda and abCda onlyDab and bc - Question 3 - Select One
The ratio of work done by an ideal diatomic gas to the heat supplied by the gas in an isobaric process is
A57B35C27D53
V-T graph of a process of monoatomic ideal gas is shown in figure.
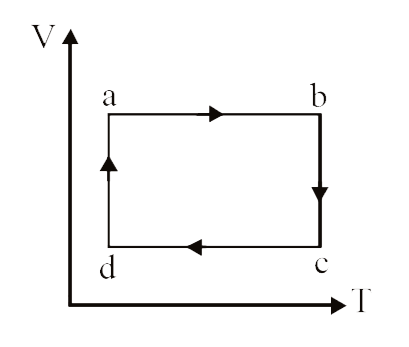
Sum of work done by the gas in process abod is-View SolutionP – V graph of an ideal gas is as shown in the diagram . Work done by the gas in the process ABCD is
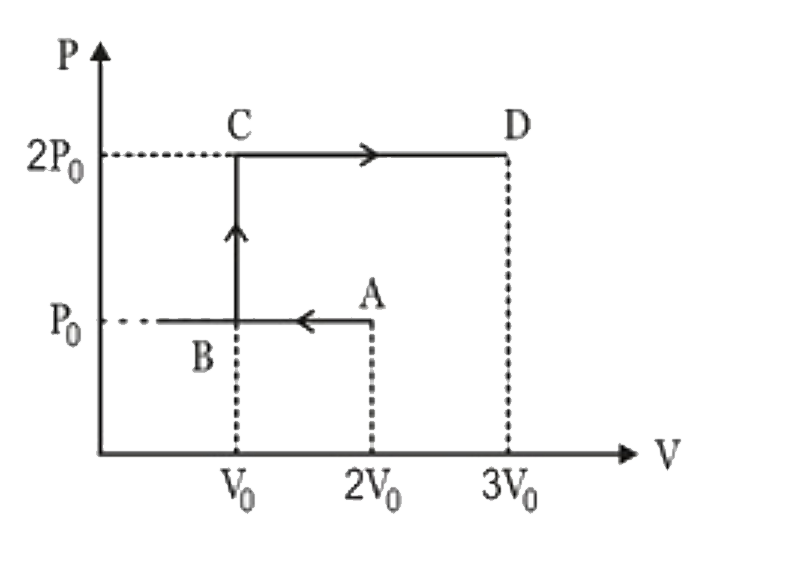 View Solution
One mole of an ideal monoatomic gas is taken through the thermodynamic process shown in the P−V diagram. The heat supplied to the system is
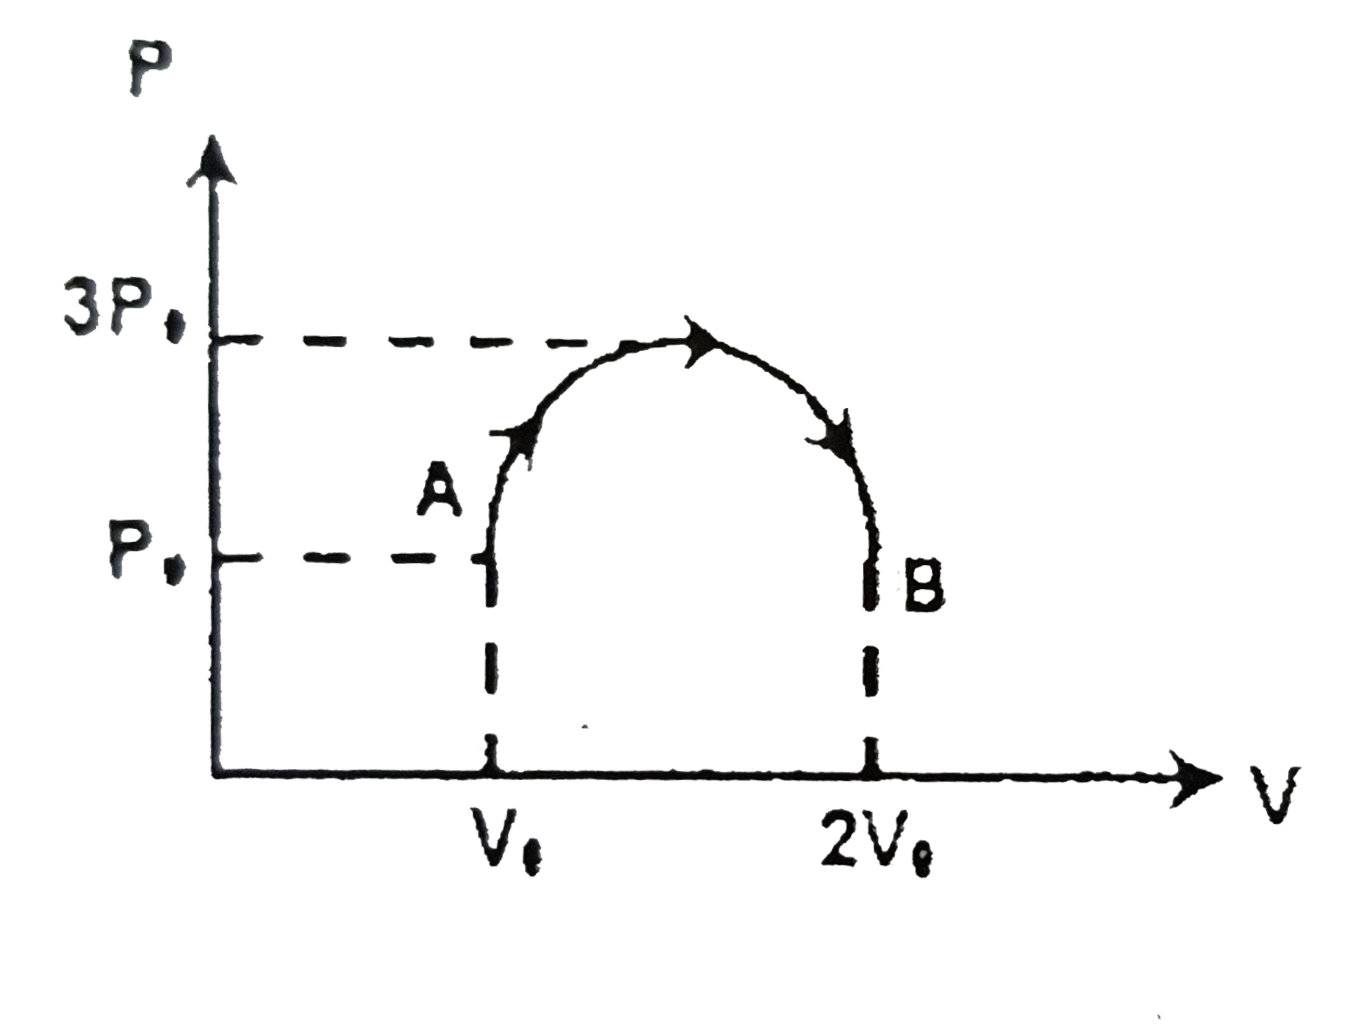 View Solution
In a thermodynamic process on an ideal diatomic gas, work done by the gas is η times. The heat supplied (η<1). The molar heat capacity of the gas for the process is
View SolutionThe molar heat capacity in a process of a diatomic gas if it does a work of Q4 when a heat of Q is supplied to it is
View Solution

