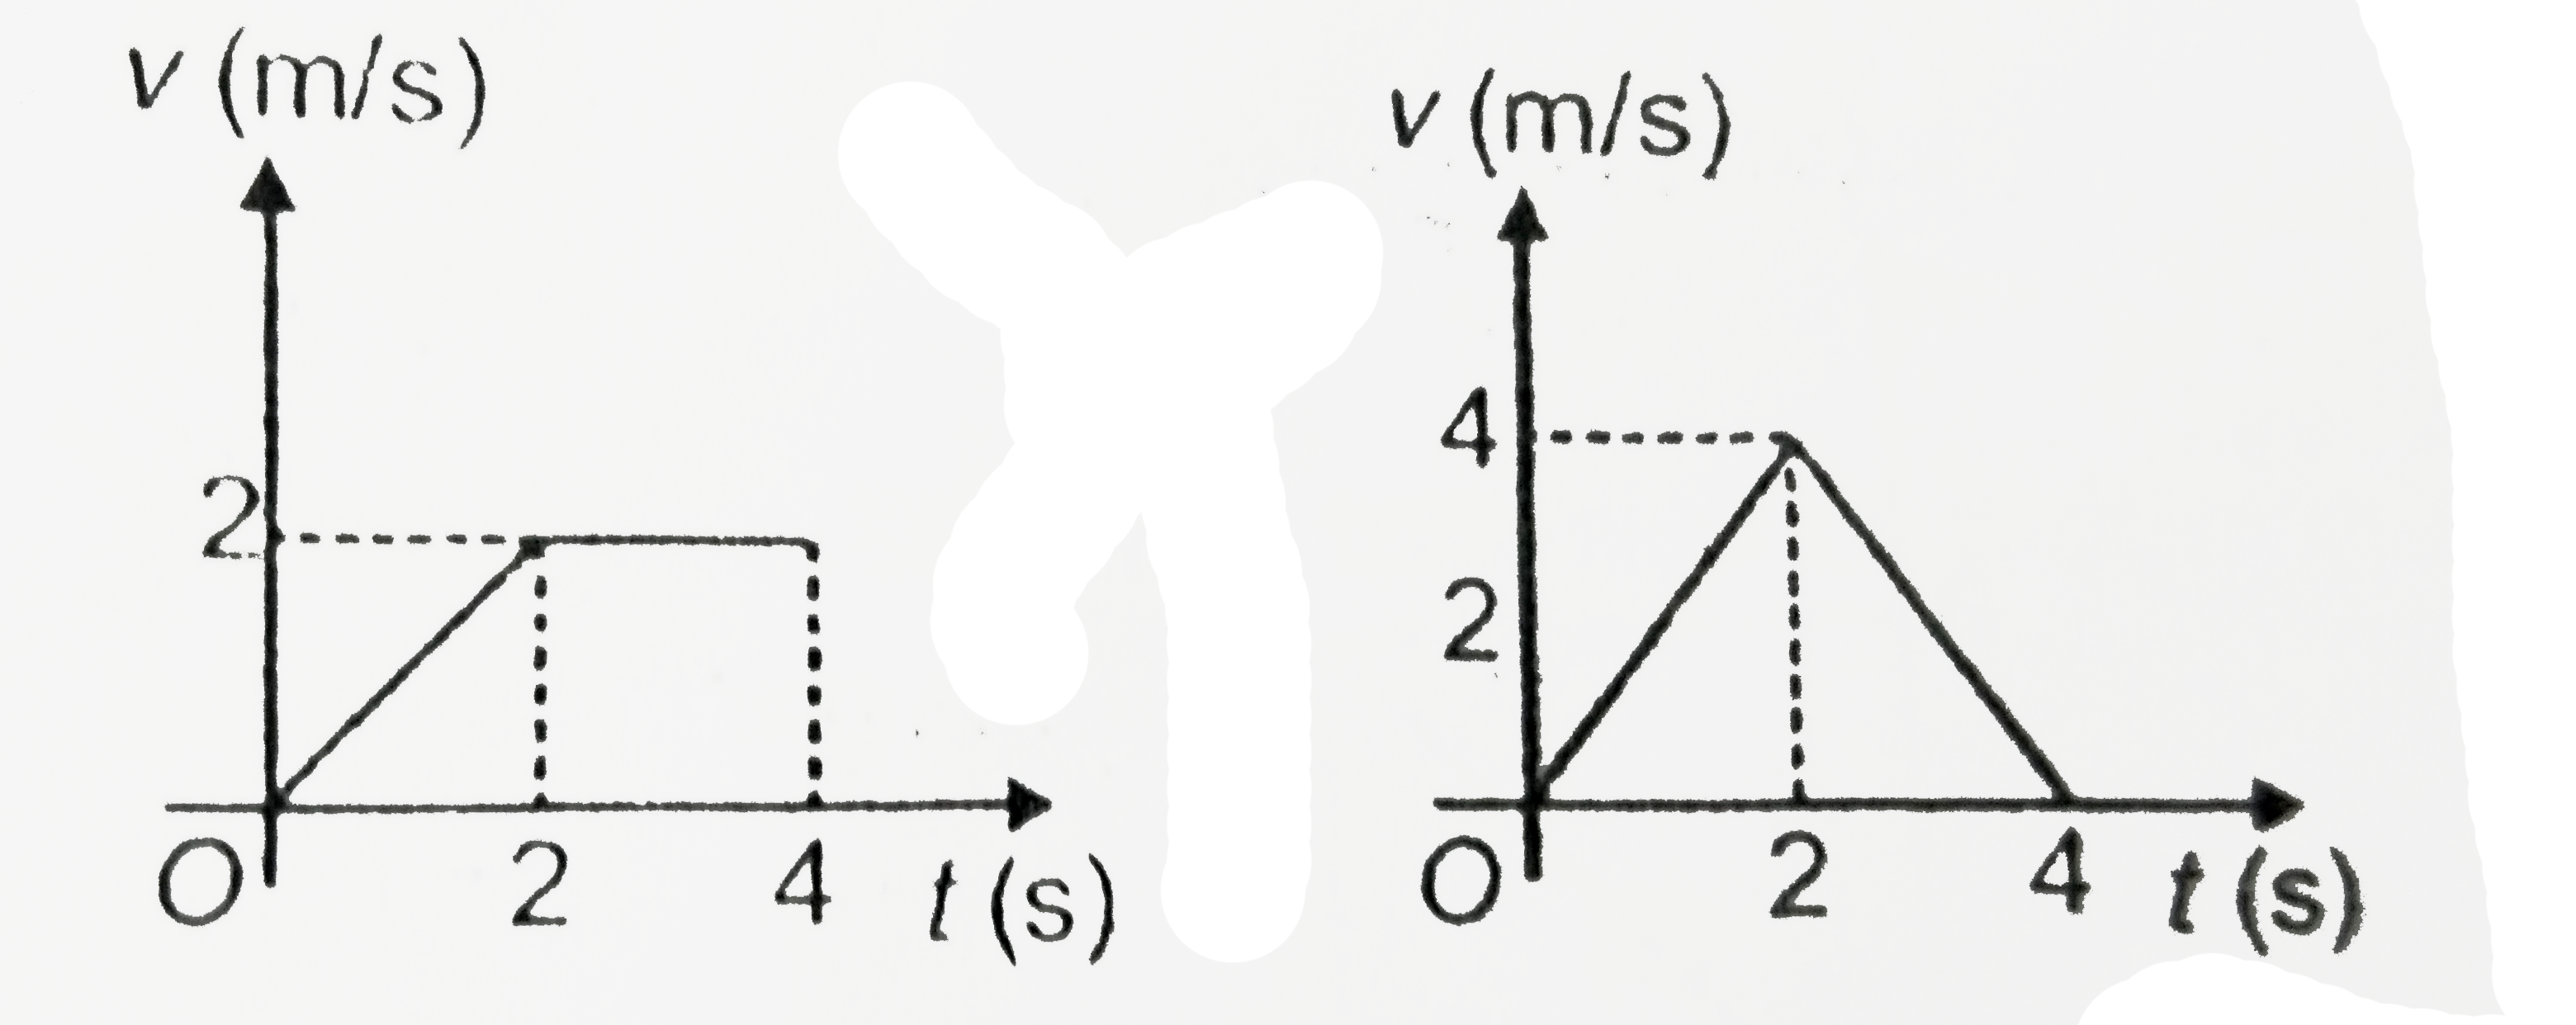
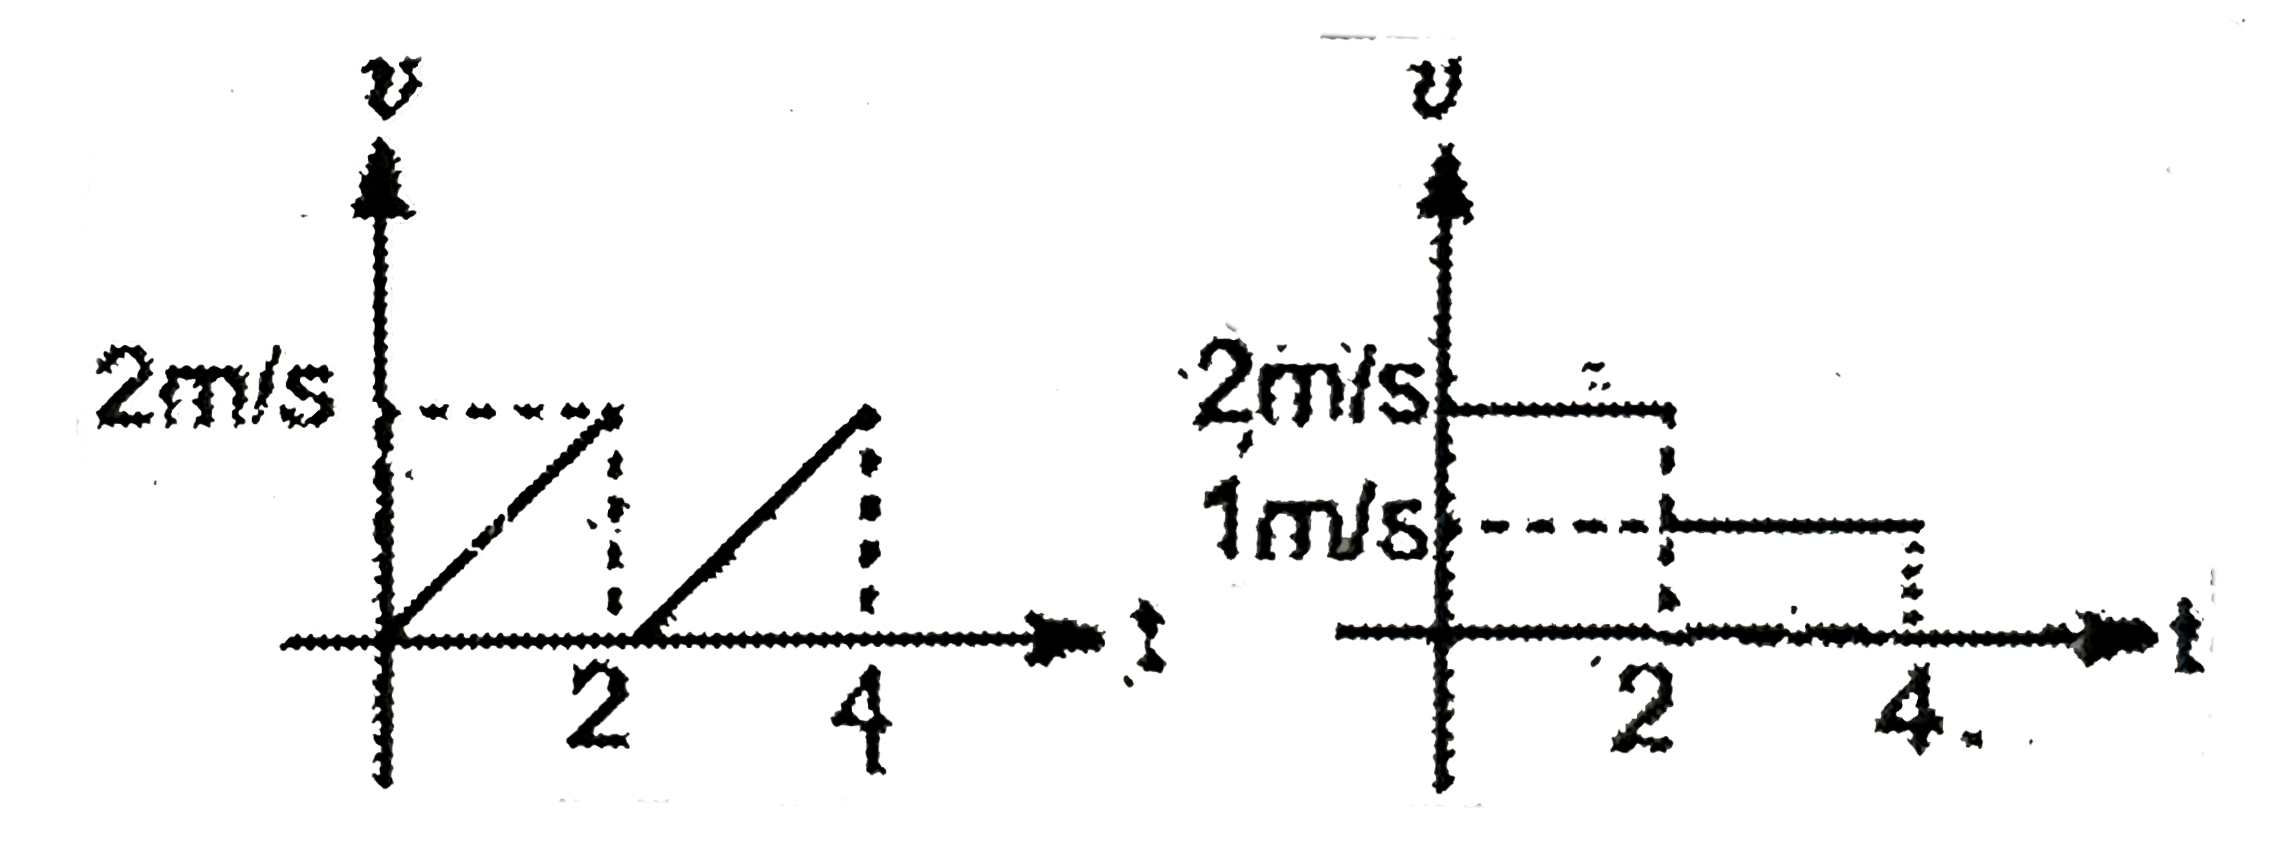
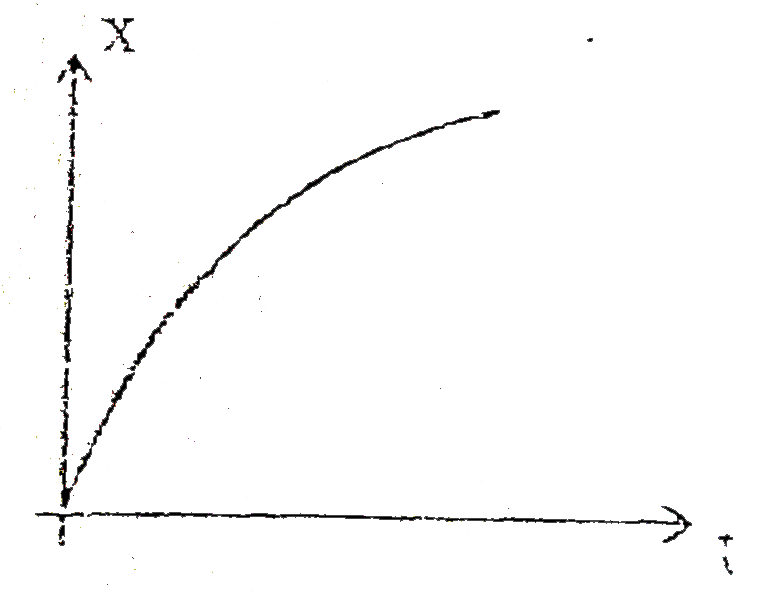
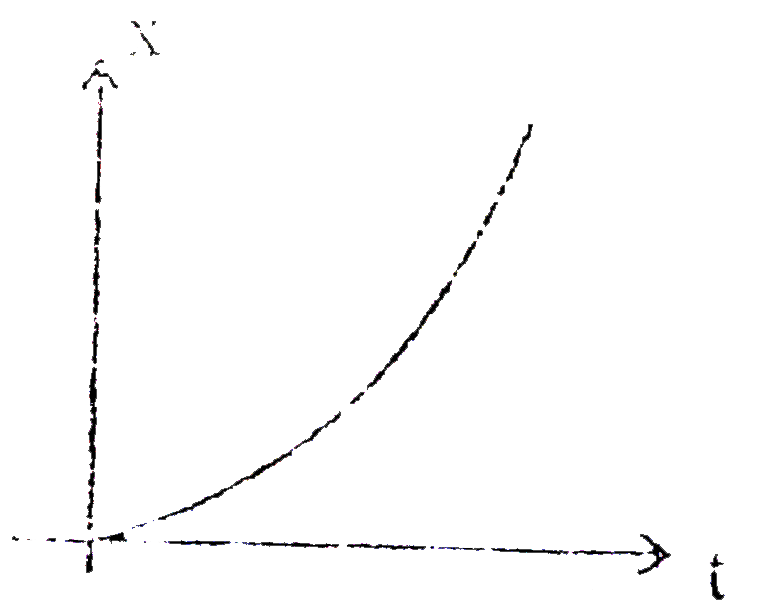
For a particle moving along axis, speed must be increasing for the following graph
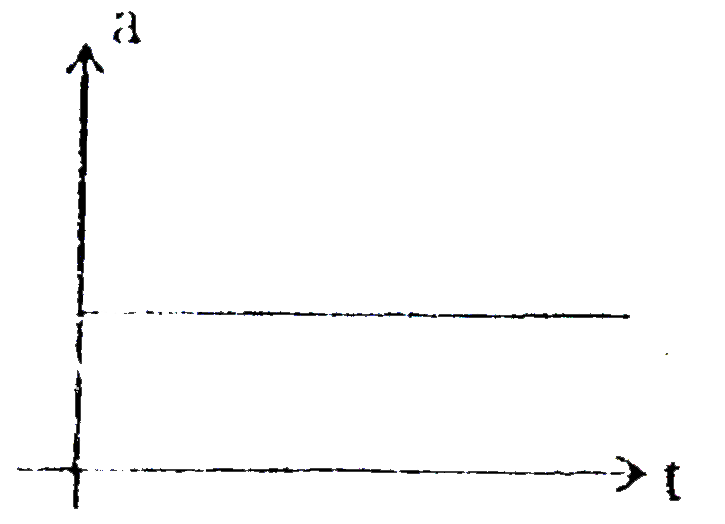
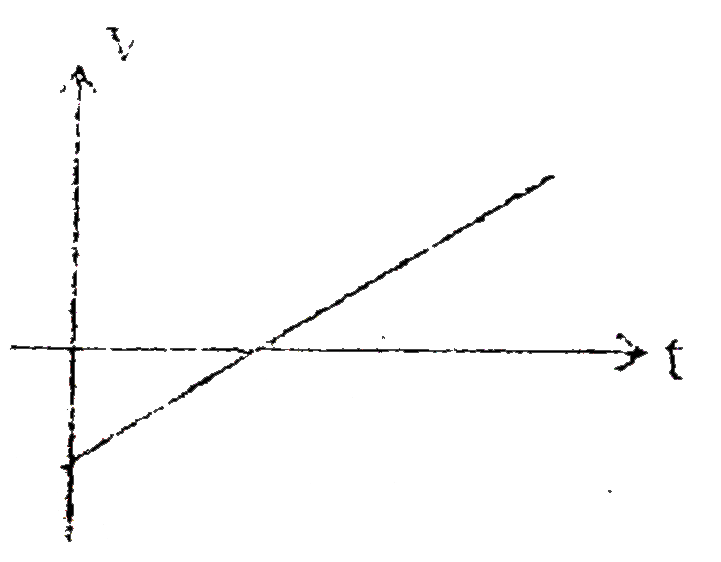
The correct Answer is:D
For For speeding up, signs of and a must be same and for speeding down signs of and a must be opposite.
For speed[velocity] speed first then
For & speed [slope of graph]
Topper's Solved these Questions
- TEST PAPERBOOK - ALLENCHAPTER - TEST PAPEREXERCISE - PHYSICS
4 Videos
- TEST PAPERBOOK - ALLENCHAPTER - TEST PAPEREXERCISE - PHYSICS
4 Videos
- SIMPLE HARMONIC MOTIONBOOK - ALLENCHAPTER - SIMPLE HARMONIC MOTIONEXERCISE - Example
1 Videos
- TEST PAPER 1BOOK - ALLENCHAPTER - TEST PAPER 1EXERCISE - PHYSICS
11 Videos
Similar Questions
Knowledge Check
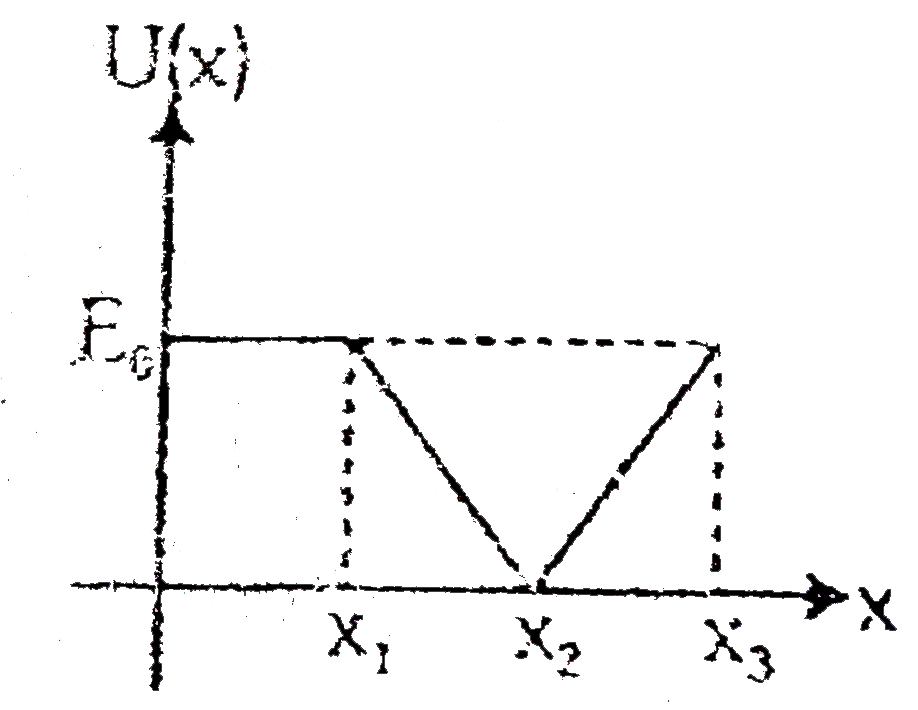
The potential energy U(x) of a particle moving along x−axis is shown in figure. Which one of the following graphs represents the variation of kinetic energy of this particel if its total mechanical enery is E0
 A
A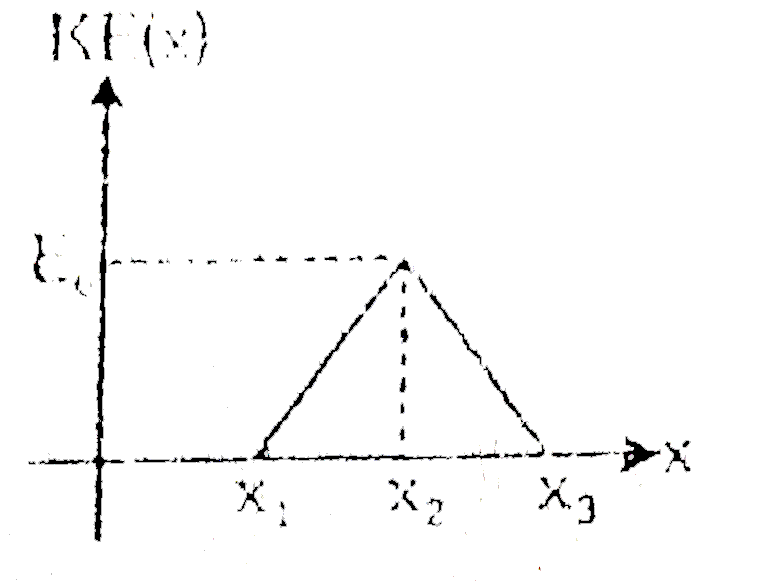 B
B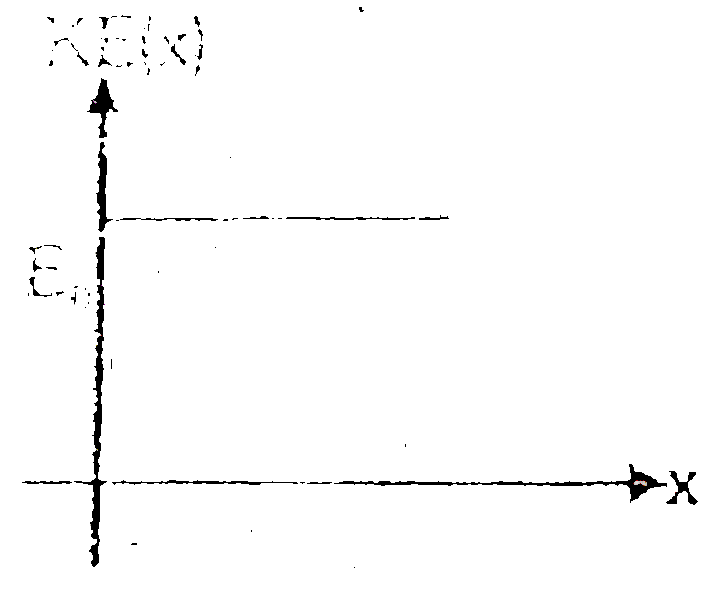 C
C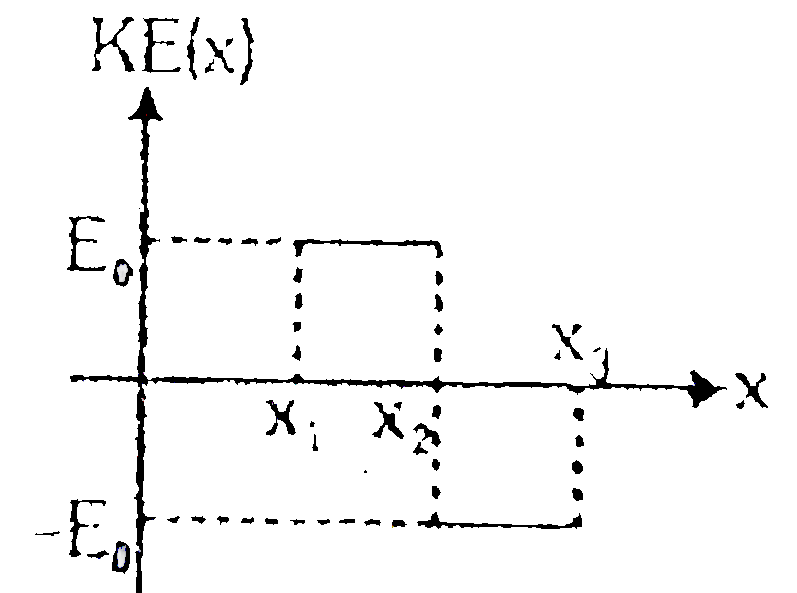 D
D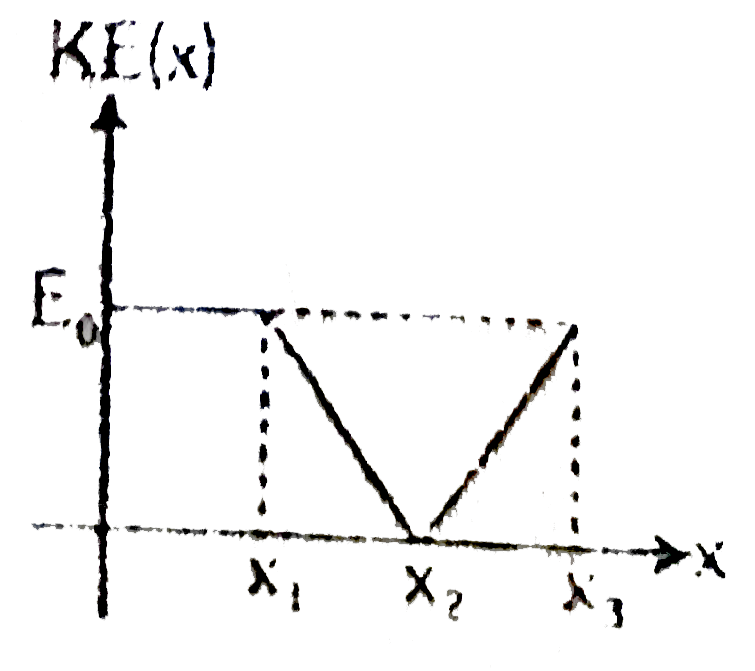
If a particle is moving along straight line with increasing speed, then
AIts acceleration is negativeBIts acceleration may be decreașingCIts acceleration is positiveDBoth (2) & (3)For a particle moving along the x-axis, mark the correct statement(s).
Aif x is positive and is increasing with the time, then average velocity of the particle is positive.Bif x is negative and becoming positive after some time, then the velocity of the particle is always positive.CIf x is negative and becoming less negative as time passes, then the average velocity of the particle is positive.DIf x is positive and is increasing with time, then the velocity of the particle is always positive.
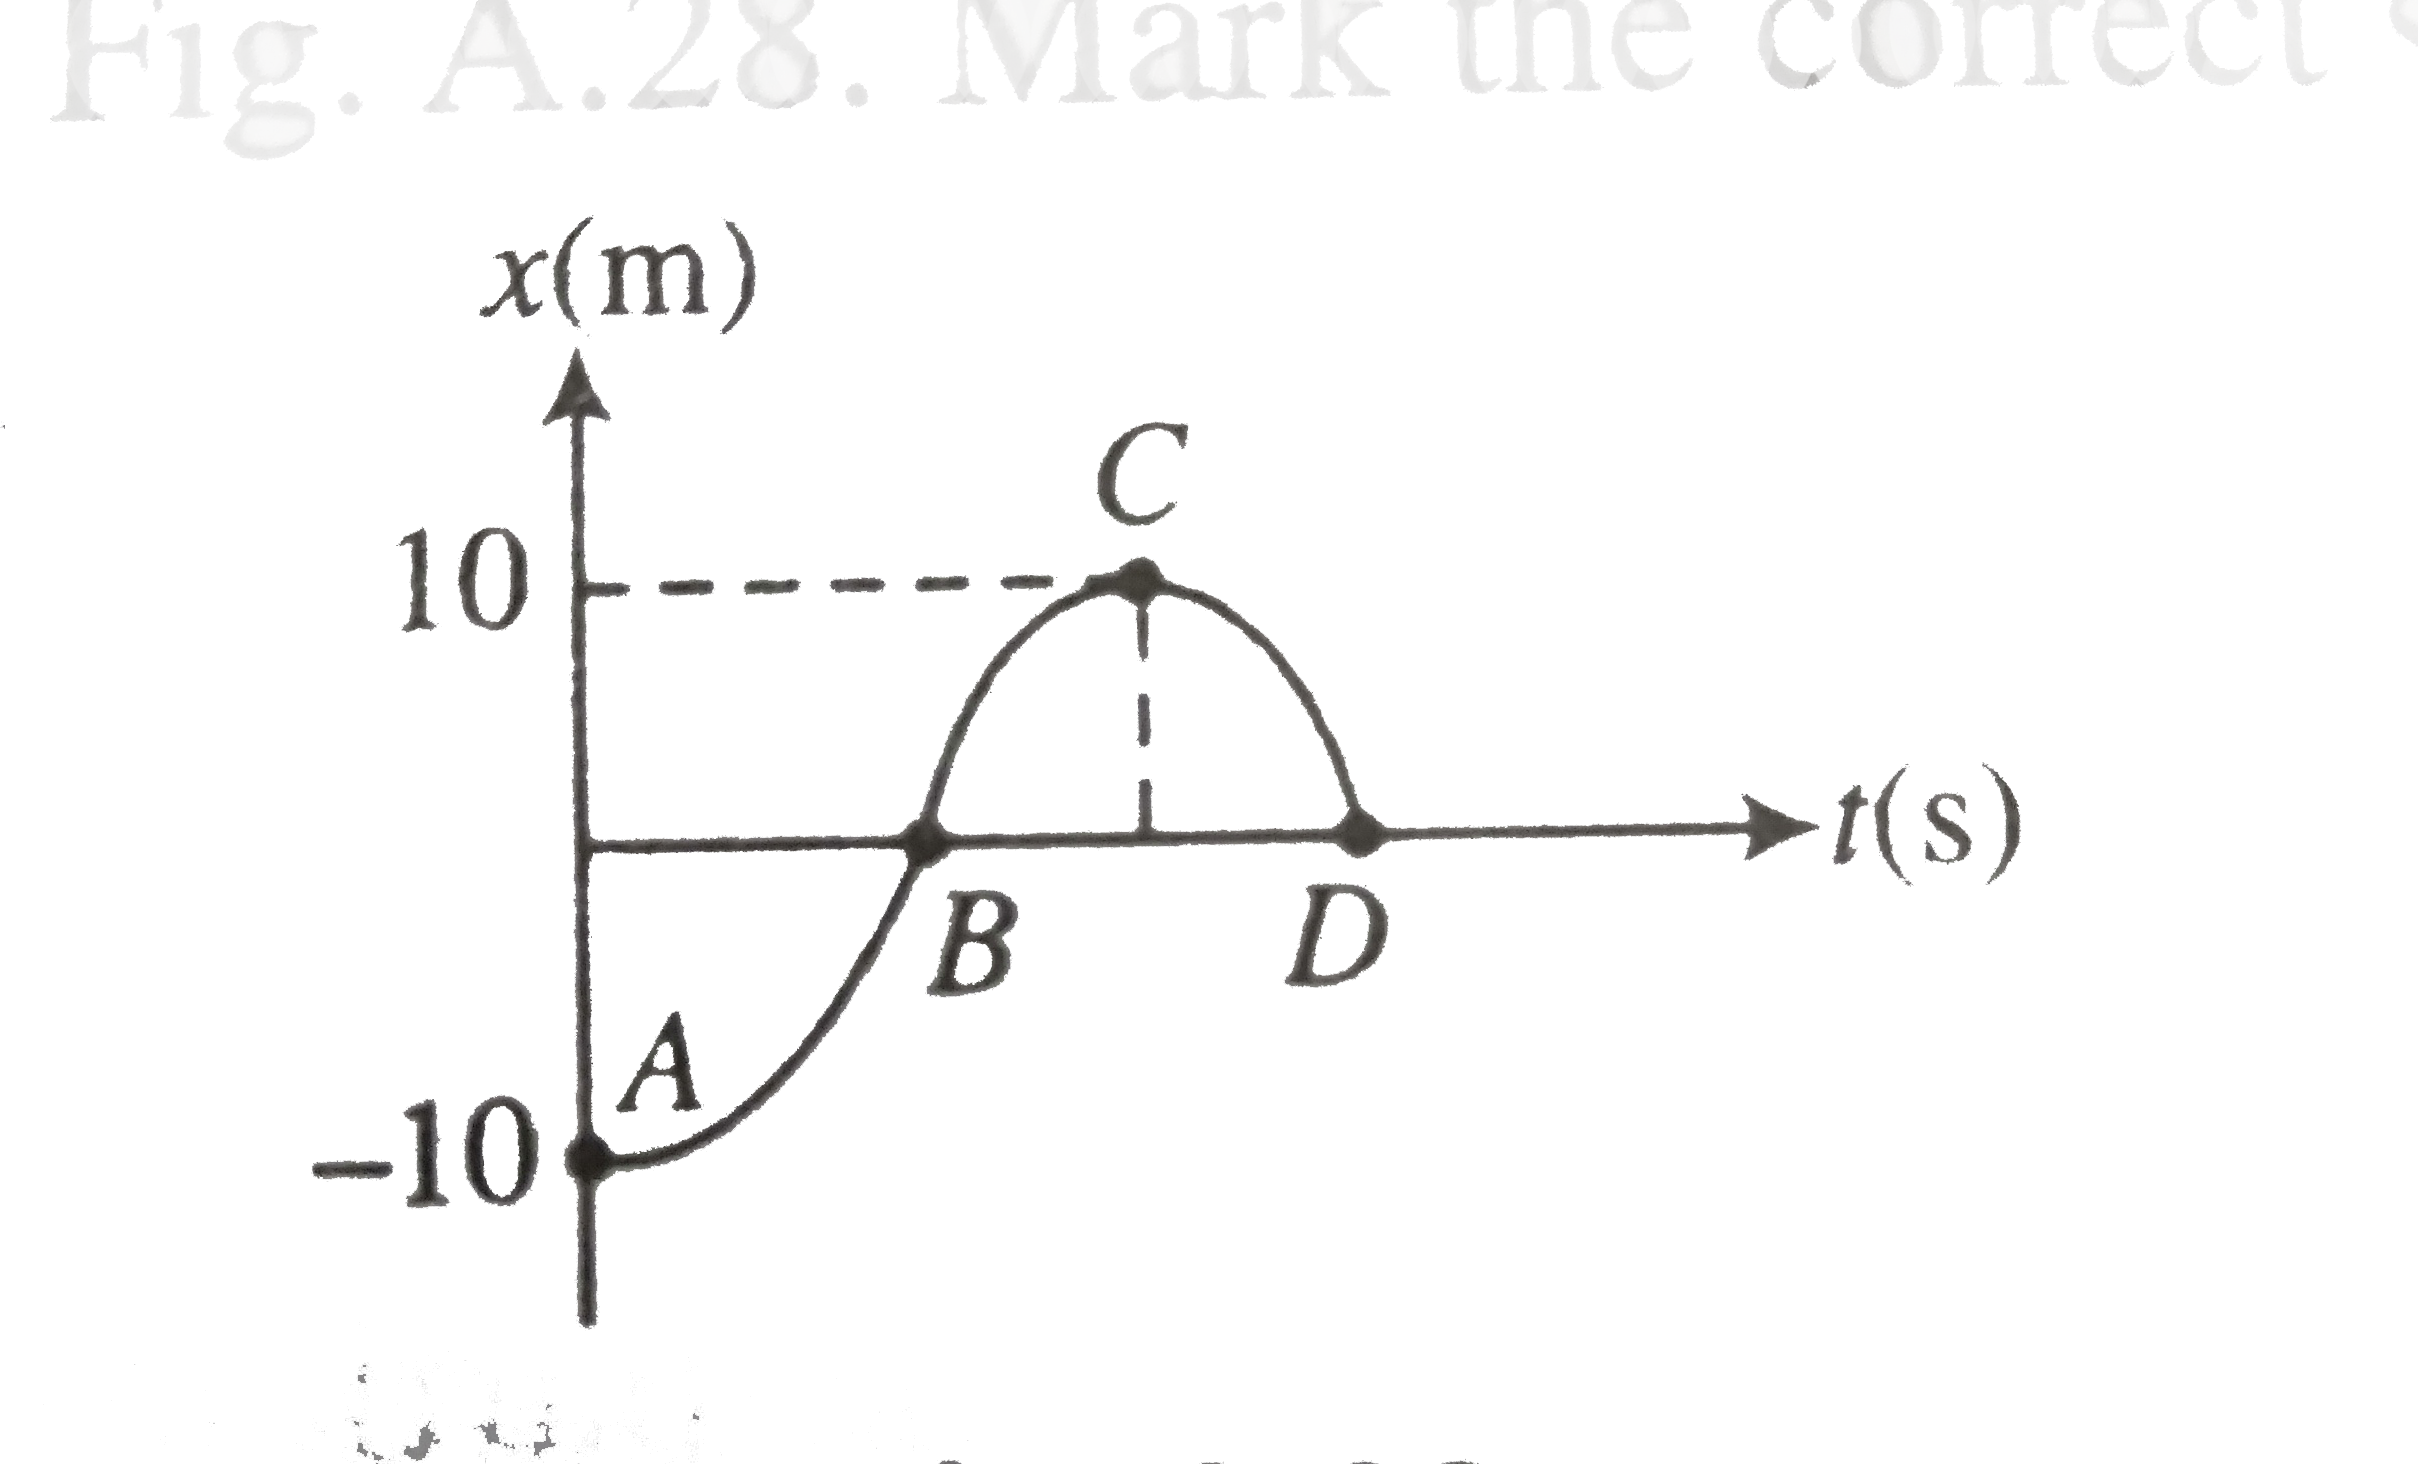
For a particle moving along the x-axis, x-t graph is as given as graph in figure. Mar the correct statement (s).
(#BMS_V01_MAA_E01_052_Q01.png" width="80%">
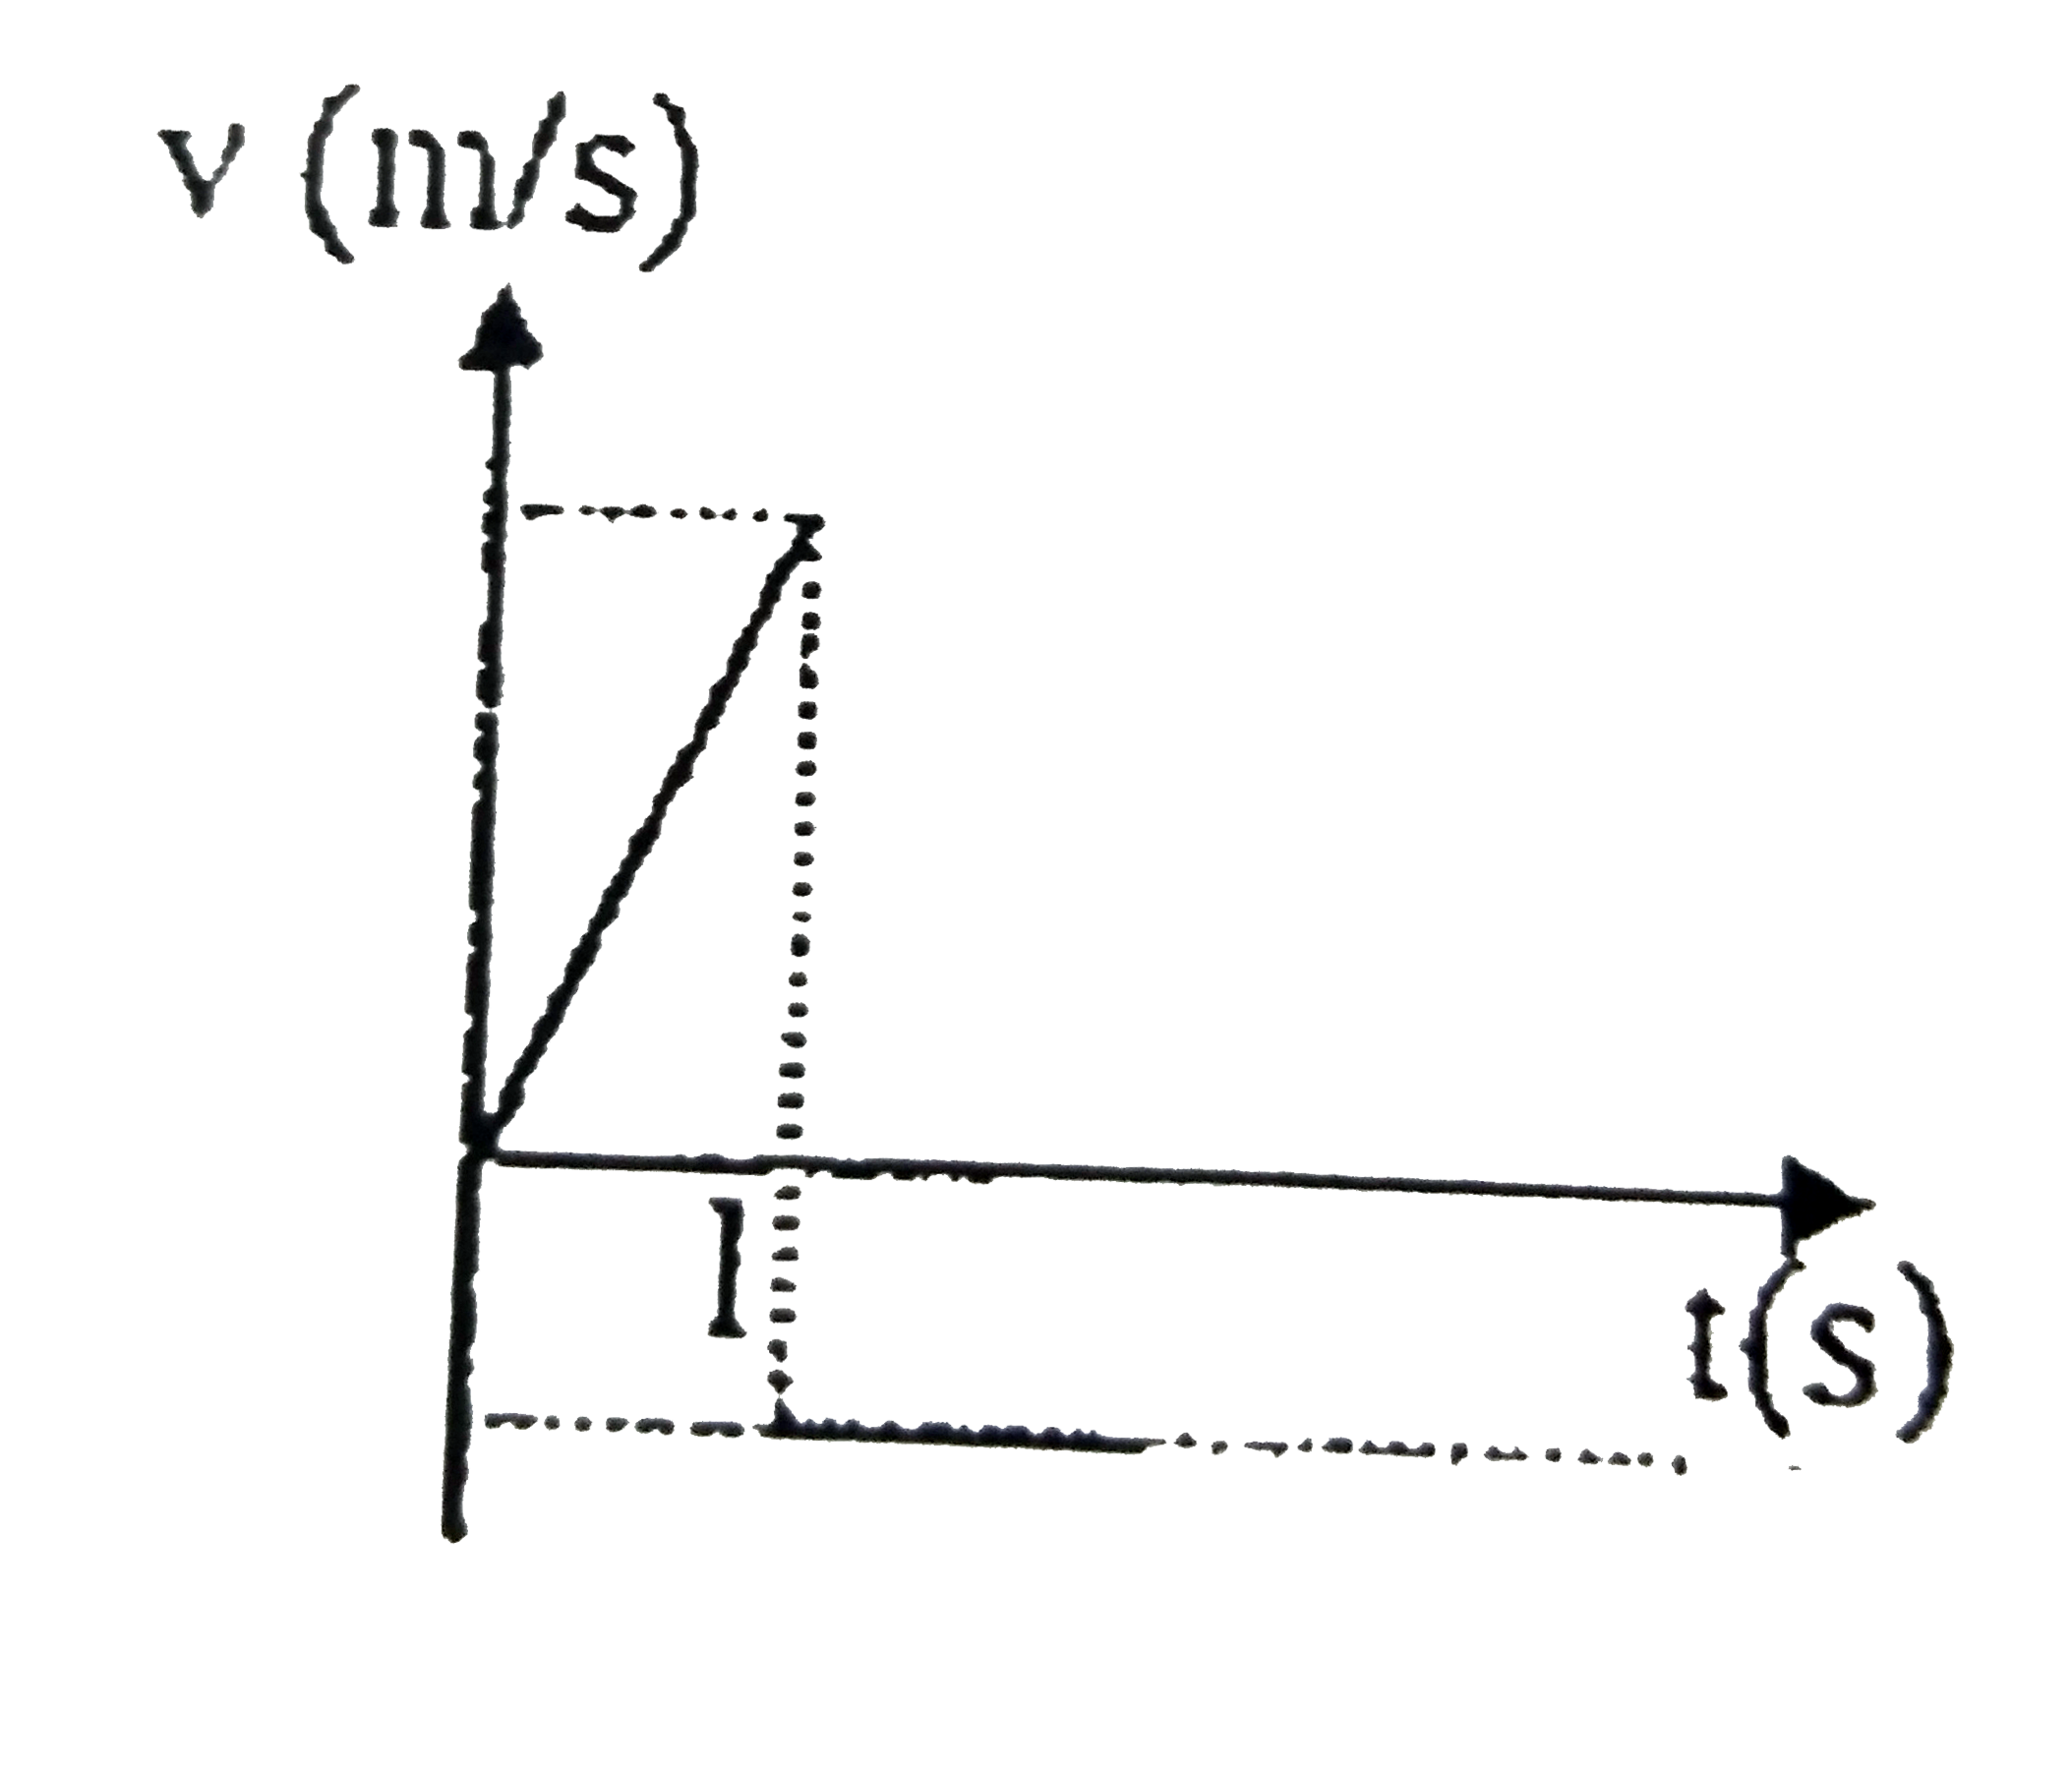
View SolutionThe velocity time graph for a particle moving along x-axis is shown in the figure. The corresponding displacement time graph is correctly shown by
View SolutionFor a particle moving along x-axis, a scaled x-6 graph is shown in figure. Mark the correct statement (s).
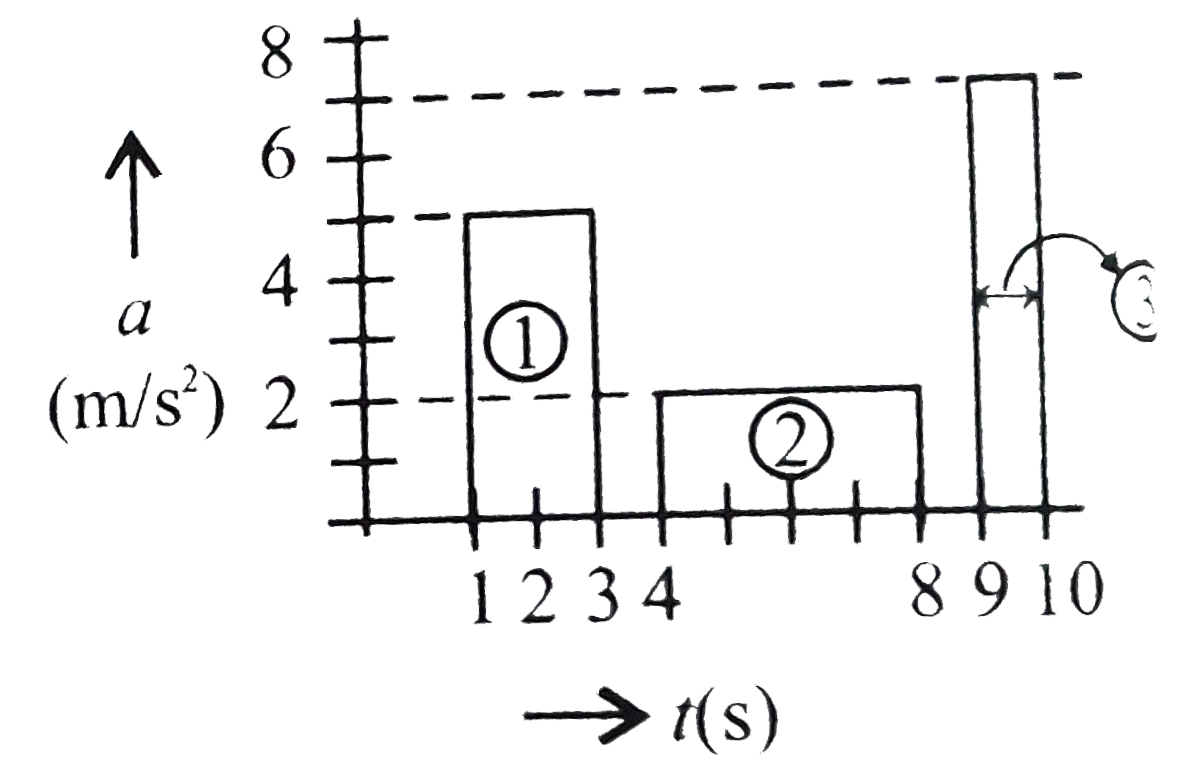
View SolutionThe figure shows a particle moving along x - axis subjected to three particles of acceleration (a). Rank the periods according to the increase they produce in the particle velocity, greatest first.
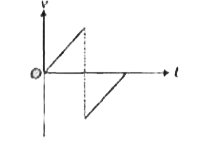
View SolutionThe velocity (v) - time (t) graph for a particle moving along x - axis is shown in the figure. The corresponding position (x) - time (t) is best represented by
View Solution

