The following bar graph shows the number of vehicles passing through a road crossing in Delhi in different time intervals on a particular day. Read the bar graph and answer the following questions: What does the bar graph represent? Also, give the maximum number of vehicles. When is the hourly traffic maximum? Also give the minimum number of vehicles. When is the hourly traffic minimum? What is the total number of vehicles passing through a crossing during a particular day?
Step by step video & image solution for The following bar graph shows the number of vehicles passing through a road crossing in Delhi in different time intervals on a particular day. Read the bar graph and answer the following questions: What does the bar graph represent? Also, give the maximum number of vehicles. When is the hourly traffic maximum? Also give the minimum number of vehicles. When is the hourly traffic minimum? What is the total number of vehicles passing through a crossing during a particular day? by Maths experts to help you in doubts & scoring excellent marks in Class 6 exams.
Updated on:21/07/2023Topper's Solved these Questions
Similar Questions
Read the bar graph and answer the following questons.
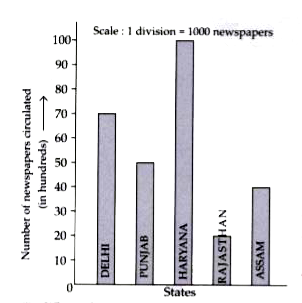
What information is given by graph ?
View SolutionRead the graph and answer the following questions
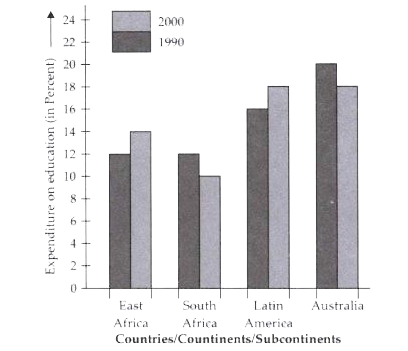
Give a suitable title to bar graph
View SolutionRead the graph and answer the following questions
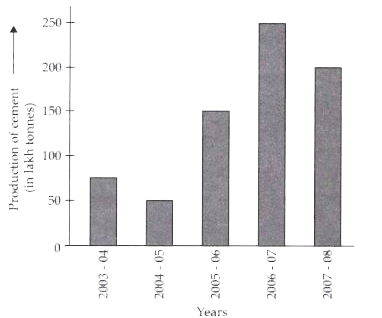
What information is conveyed by the bar graph
View SolutionRead the bar graph given below and answer the following questions:
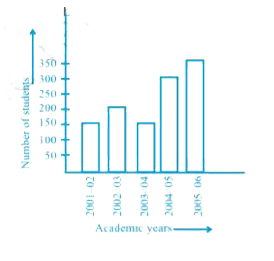
What information is given by the þar graph?
View SolutionThe following bar graph shows the number of houses (out of 100) in a town using different types of fuels for cooking.
Read the bar graph and answer the following questions:
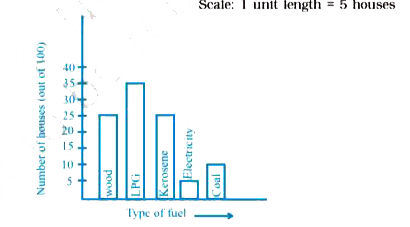
How many houses are using coal as fuel?
View SolutionThe following bar graph shows the number of houses (out of 100) in a town using different types of fuels for cooking.
Read the bar graph and answer the following questions:
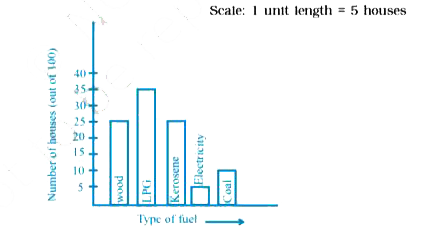
Which fuel is used in maximum number of houses?
View SolutionNumber of wrist watches manufactured by a factory in six days of a particular week is given below.
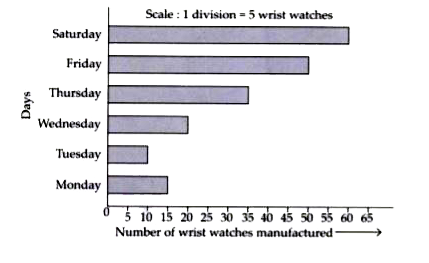
Read the bar graph and answer the following questions.
What information does the bar graph gives ?
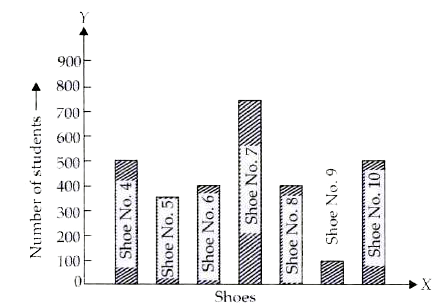
View SolutionRead the bar graph shown in figure and answer the following questions.
Which shoe number is worn by the maximum number of students? Also give its number
View SolutionRead the bar graph given below and answer the following questions:

In which year is the number of students maximum?
View SolutionObserve the bar graph and answer the following questions.
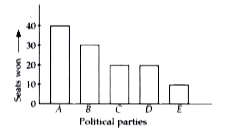
What is the total number of seats won by party A and party B?
View Solution
