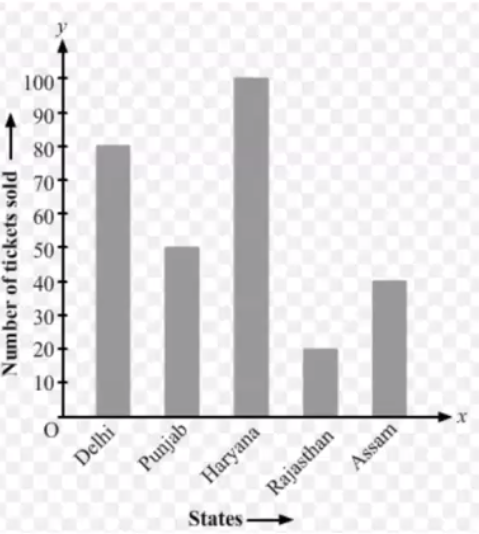
Read the bar graph shown in Figure and answer
the following questions:
What is the information given by the bar graph?
How many tickets of Assam State Lottery were
sold by the agent?
Of which state, were the maximum number of
tickets sold?
State whether true of false.
The maximum number of tickets sold is the three
times the minimum number of tickets sold.
Of which state were the
minimum number of tickets sold?

Step by step video & image solution for Read the bar graph shown in Figure and answer the following questions: What is the information given by the bar graph? How many tickets of Assam State Lottery were sold by the agent? Of which state, were the maximum number of tickets sold? State whether true of false. The maximum number of tickets sold is the three times the minimum number of tickets sold. Of which state were the minimum number of tickets sold? by Maths experts to help you in doubts & scoring excellent marks in Class 6 exams.
Updated on:21/07/2023Topper's Solved these Questions
Similar Questions
Read the bar graph shown in Figure and answer the following questions: What is the information given by the bar graph? What is the order of the change of number of students over several years? State whether true or false. The enrolment during 1996-97 is twice that of 1995-96
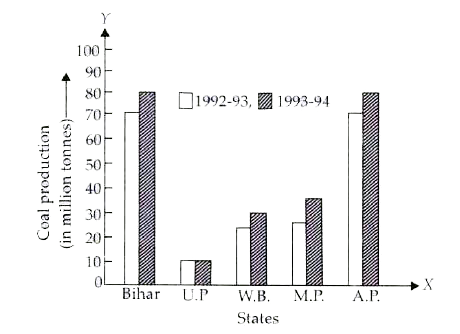
View SolutionRead the following bar graph given in figure and answer the following questions.

Which state has minimum production?
View Solution
Knowledge Check
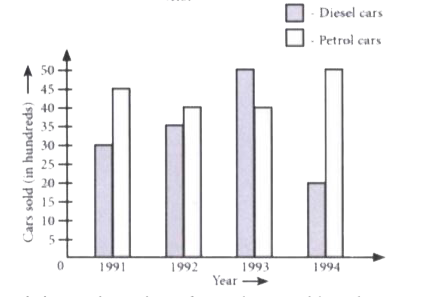
Study the graph carefully and answer the following questions.

How many cars were sold during the year 1991?A9000B6500C7500D7000What is the difference between the number of tickets of movie D sold in Kolkata and the number of tickets of movie B sold in Lucknow?
A700B6000C14000D9000The number of tickets of movie E sold in Chennai is what per cent of number of tickets of movies A sold in Mumbai?
A170B70C30D130
Read the bar graph shown in Figure and answer the following questions: What is the information given by the bar graph? What are the different numbers of the shoe-worn by the students? What is the number of students wearing shoe No. 6? Which shoe number is worn by the maximum number of students? Also give its number. Which shoe number is worn by the minimum number of students? Also give its number. State whether true or false. The number of students wearing shoe no.10 is less than three times the number of students wearing shoe no. 9.
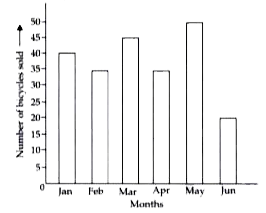
View SolutionLook at the bar graph and answer the following questions.

In which month 40 bicycles were sold?
View SolutionRead the following bar graph given in Figure and answer the following questions: What information is given by this bar graph? Which two states have same production in 1993-94? Name the state having same production in both the years? Which state has minimum production?
View SolutionRead the following bar graph (Figure) and answer the following questions: What is the information given by the bar graph? State each of the following whether true or false. The number of government companies in 1957 is that of 1982 is 1:9. The number of government companies have decreased over the year 1957 to 1983.
View SolutionWhat is the average number of tickets of movie C sold in all the six cities?
View Solution
