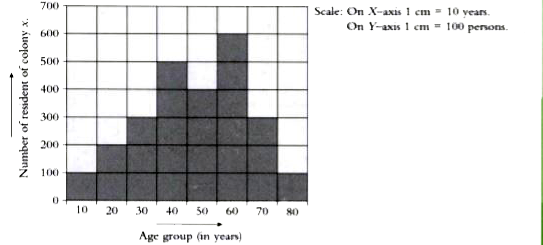
Study the bar graph representing the number of
persons in various age groups in a town shown in Figure. Observe the bar
graph and answer the following questions:
What is the percentage of the youngest
age-group persons over those in the oldest age group?
What is the total population of the town?
What is the number of persons in the age group
60-65?
How many persons are more in the age-group
10-15 than in the age group 30-35?
What is the age-group of exactly 1200 persons
living in the town?
What is the total number of persons living in
the town in the age group 50-55?
What is the total number of person living in
the town in the age-groups 10-15 and 60-65?
Whether the population in general increases,
decreases or remains constant with the increase in the age-group.
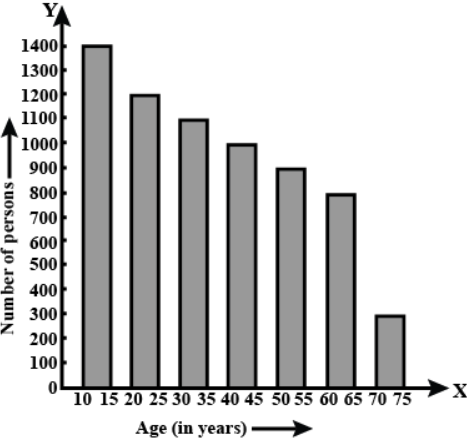
Step by step video & image solution for Study the bar graph representing the number of persons in various age groups in a town shown in Figure. Observe the bar graph and answer the following questions: What is the percentage of the youngest age-group persons over those in the oldest age group? What is the total population of the town? What is the number of persons in the age group 60-65? How many persons are more in the age-group 10-15 than in the age group 30-35? What is the age-group of exactly 1200 persons living in the town? What is the total number of persons living in the town in the age group 50-55? What is the total number of person living in the town in the age-groups 10-15 and 60-65? Whether the population in general increases, decreases or remains constant with the increase in the age-group. by Maths experts to help you in doubts & scoring excellent marks in Class 6 exams.
Updated on:21/07/2023Topper's Solved these Questions
Similar Questions
Knowledge Check
What is the age group of late childhood stage?
A2 to 6 yearsB6 to 12 yearsC4 to 7 yearsD11 to 15 yearsWhat is the total number of person in the age group of 20 to 50 years in the villages A and B, taken together
A4300B4200C4100D4000Study the following histogram and answer the questions.
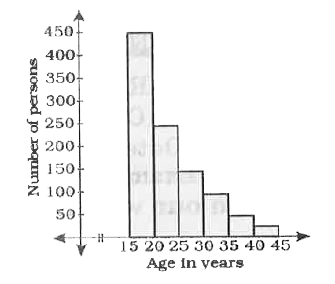
The number of persons in the age group 20 - 30 years is :A475B400C300D700
Number of mobile phone users in various age groups in a city is listed below:
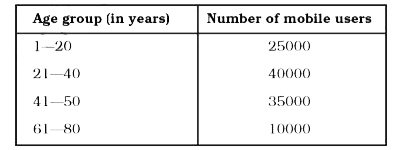
Draw a bar graph to represent the above information.
View SolutionRead the adjacent histogram and answer the following questions.
Find the group in which number of persons is more.
View SolutionNumber of persons in various age groups in a town is given in the following tableDraw a bar graph to represent the above information and answer the following questions. (take 1 unit length = 20 thousands)(a) Which two age groups have same population?(b) All persons in the age group of 60 and above are called senior citizens. How many senior citizens are there in the town?
View Solution___ means the number of people in different age groups in a given population.
View SolutionWhat is the ratio of total number of persons of ages above 50 years in the villages B and C taken together to the total number of persons having ages between 20 and 50 years in the said village
View Solution

