In a school, there are five sections of class VII. The number of students in each section is given below. Construct a bar graph representing this data: Section, A, B, C, D, E Number of students, 40, 48, 52, 45, 30
To construct a bar graph representing the number of students in each section of class VII, follow these steps:
1. Identify the Data:
- Sections: A, B, C, D, E
- Number of Students: 40, 48, 52, 45, 30
2. Set Up the Axes:
- Draw a horizontal line (X-axis) and a vertical line (Y-axis).
- Label the X-axis with the sections (A, B, C, D, E).
- Label the Y-axis with the number of students. Choose a suitable scale (e.g., increments of 5).
3. Determine the Scale for the Y-axis:
- Start from 0 and go up to at least 55 (the highest number of students).
- Mark the Y-axis with increments of 5: 0, 5, 10, 15, 20, 25, 30, 35, 40, 45, 50, 55.
4. Plot the Bars:
- For Section A (40 students), draw a bar that reaches up to 40 on the Y-axis.
- For Section B (48 students), draw a bar that reaches up to 48 on the Y-axis.
- For Section C (52 students), draw a bar that reaches up to 52 on the Y-axis.
- For Section D (45 students), draw a bar that reaches up to 45 on the Y-axis.
- For Section E (30 students), draw a bar that reaches up to 30 on the Y-axis.
5. Label the Bars:
- Optionally, you can label the top of each bar with the number of students it represents for clarity.
6. Review the Graph:
- Ensure all bars are of equal width and properly aligned with their respective sections.
- Check that the heights of the bars accurately represent the number of students.
- Sections: A, B, C, D, E
- Number of Students: 40, 48, 52, 45, 30
- Draw a horizontal line (X-axis) and a vertical line (Y-axis).
- Label the X-axis with the sections (A, B, C, D, E).
- Label the Y-axis with the number of students. Choose a suitable scale (e.g., increments of 5).
- Start from 0 and go up to at least 55 (the highest number of students).
- Mark the Y-axis with increments of 5: 0, 5, 10, 15, 20, 25, 30, 35, 40, 45, 50, 55.
- For Section A (40 students), draw a bar that reaches up to 40 on the Y-axis.
- For Section B (48 students), draw a bar that reaches up to 48 on the Y-axis.
- For Section C (52 students), draw a bar that reaches up to 52 on the Y-axis.
- For Section D (45 students), draw a bar that reaches up to 45 on the Y-axis.
- For Section E (30 students), draw a bar that reaches up to 30 on the Y-axis.
- Optionally, you can label the top of each bar with the number of students it represents for clarity.
- Ensure all bars are of equal width and properly aligned with their respective sections.
- Check that the heights of the bars accurately represent the number of students.
Topper's Solved these Questions
Similar Questions
In a school, there are five sections of class VII. The number of students in each section is given below. Construct a bar graph representing this data: Section, A, B, C, D, E No. of Students, 40, 48, 52, 45, 30
View SolutionIn a school, there are five sections of class IX. The number of students in each section is given below. Construct a bar graph representing this data: Section: A B C D E No. of Students 40 48 52 45 30
View Solution
Knowledge Check
In a school, the number of students in each section is equal to the number of sections. If the total number of students is 625, then find the numbr of sections
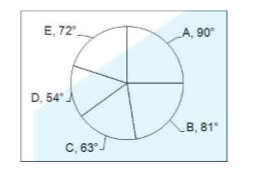
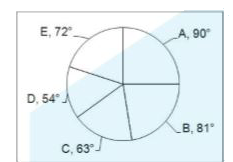
A10B20C15D25The pie chart given below shows the number of students in 5 sections .The number of students is 7200.

What is the total number of students in section E and section B?Aa)3060Bb)2900Cc)5300Dd)6000The pie chart given below shows the number of students in 5 sections .The number of students is 7200.
The number of students in section A is what percent of that of section B?
 Aa)90Bb)110Cc)109Dd)111.11
In a school, there are five sections of Class VI. The number of students in each section is given below:

Represent the above data using a bar graph.
View SolutionDraw a pictograph for representing the number of students in each class based on the given data.

View SolutionIn a school, there are four sections of 40 students each in XI standard. In how many ways can a set of 4 student representatives be chosen, one from each section?
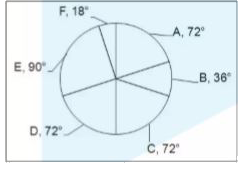
View SolutionThe pie chart given below shows the number of students in 6 different sections. The total number of students is 1800.

What is the ratio of number of students in section D to the number of students in section F and B?
View SolutionRead the data given below and answer the questions based on it.
There were 3 sections namely A, B and C in a test. Out of three 33 students passed in section A, 34 students passed in Section B and 32 passed in Section C. 10 students passed in Section A and Section B, 9 passed in Section B and Section C, 8 passed in Section A and Section C. The number of students who passed each section alone was equal and was 21 for each section.
The ratio of the number of students passed in one or more of the sections to the number of students who passed in section A alone is :
A. 78/21
B. 3
C. 73/21
D. 75/21
View Solution
