The population of four major cities in India in a particular year is given below: City, Mumbai, Kolkata, Delhi, Chennai Number of students, 120, 130, 150, 80 Construct a bar graph to represent the above data.
To construct a bar graph representing the number of students in four major cities in India, follow these steps:
1. Identify the Data:
- Cities: Mumbai, Kolkata, Delhi, Chennai
- Number of Students: 120, 130, 150, 80
2. Draw the Axes:
- Draw a horizontal line (x-axis) and a vertical line (y-axis).
- Label the x-axis with the names of the cities: Mumbai, Kolkata, Delhi, Chennai.
- Label the y-axis with the number of students. Choose a suitable scale (for example, intervals of 20).
3. Mark the Scale on the Y-Axis:
- Start from 0 and mark the following values on the y-axis: 0, 20, 40, 60, 80, 100, 120, 140, 160.
- Ensure that the highest value (150) is included in your scale.
4. Draw Bars for Each City:
- For Mumbai (120 students), draw a bar that reaches up to the 120 mark on the y-axis.
- For Kolkata (130 students), draw a bar that reaches up to the 130 mark on the y-axis.
- For Delhi (150 students), draw a bar that reaches up to the 150 mark on the y-axis.
- For Chennai (80 students), draw a bar that reaches up to the 80 mark on the y-axis.
5. Label the Bars:
- Optionally, you can label each bar with the corresponding number of students for clarity.
6. Final Touches:
- Review your graph to ensure all bars are of equal width and properly aligned with the city names and student numbers.
- Cities: Mumbai, Kolkata, Delhi, Chennai
- Number of Students: 120, 130, 150, 80
- Draw a horizontal line (x-axis) and a vertical line (y-axis).
- Label the x-axis with the names of the cities: Mumbai, Kolkata, Delhi, Chennai.
- Label the y-axis with the number of students. Choose a suitable scale (for example, intervals of 20).
- Start from 0 and mark the following values on the y-axis: 0, 20, 40, 60, 80, 100, 120, 140, 160.
- Ensure that the highest value (150) is included in your scale.
- For Mumbai (120 students), draw a bar that reaches up to the 120 mark on the y-axis.
- For Kolkata (130 students), draw a bar that reaches up to the 130 mark on the y-axis.
- For Delhi (150 students), draw a bar that reaches up to the 150 mark on the y-axis.
- For Chennai (80 students), draw a bar that reaches up to the 80 mark on the y-axis.
- Optionally, you can label each bar with the corresponding number of students for clarity.
- Review your graph to ensure all bars are of equal width and properly aligned with the city names and student numbers.
Topper's Solved these Questions
Similar Questions
The population of four major cities in India in a particular year is given below: City: Mumbai Kolkata Delhi Chennai No. of Students: 120 130 150 80 Construct a bar graph to represent the above data.
View SolutionThe population of four major cities in India in a particular year is given below: City, Mumbai, Kolkata, Delhi, Chennai No. of Students, 120, 130, 150, 80 Construct a bar graph to represent the above data.
View SolutionGiven below is the data of school going students (boys and girls):

Draw the bar graph to represent the above data.
View SolutionThe production of saleable steel in some of the steel plants of our country during 1999 is given below: Plant, Bhilai, Durgapur, Rourkela, Bokaro Production (in thousand tonnes), 160, 80, 200, 150 Construct a bar graph to represent the above data on a graph paper by using the scale 1 big divisions = 20 thousand and tonnes.
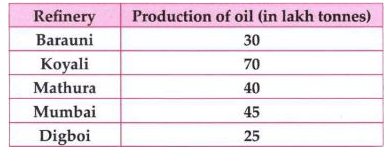
View SolutionThe production of oil (in lakh tonnes) in some of the refineries in India during 2008 is given below :

Construct a bar graph to represent the above data
View SolutionThe daily pocket expenses of 206 students in a school are given below.

Construct a frequency polygon representing the above data.
View SolutionThe daily pocket expenses of 206 students in a school are given below.

Construct a frequency polygon representing the above data.
View SolutionThe marks obtained (out of 100) by a class of 80 students are given below:

Construct a histogram to represent the data above
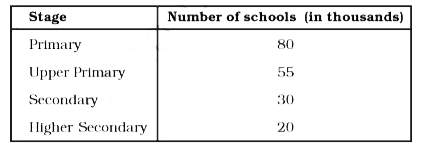
View SolutionThe following table gives the data of number of schools (stage-wise) of a country in the year 2002.

Draw a bar graph to represent the above data:
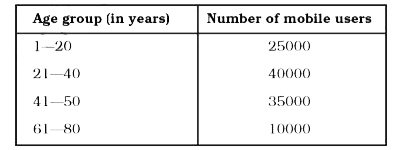
View SolutionNumber of mobile phone users in various age groups in a city is listed below:

Draw a bar graph to represent the above information.
View Solution
