The following data gives the production of food grains (in thousand tonnes) for some years: Year 1995 1996 1997 1998 1999 2000 Production (in thousand tonnes) 120 150 140 180 170 190 Represent the above data with the help of a bar graph.
Step by step video & image solution for The following data gives the production of food grains (in thousand tonnes) for some years: Year 1995 1996 1997 1998 1999 2000 Production (in thousand tonnes) 120 150 140 180 170 190 Represent the above data with the help of a bar graph. by Maths experts to help you in doubts & scoring excellent marks in Class 7 exams.
Updated on:21/07/2023Topper's Solved these Questions
Similar Questions
. The following data shows the year wise strength of a school.Represent the the above data by bar graph:
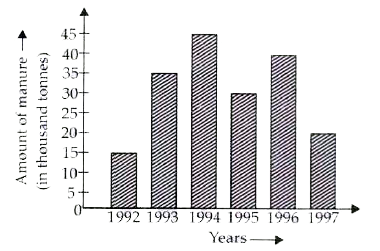
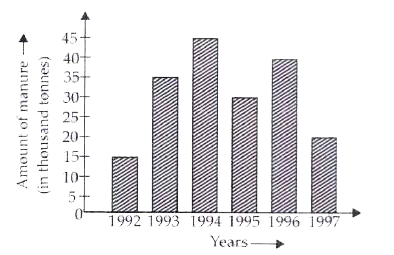
View SolutionThe following data gives the amount of manure (in thousand tonnes) manufactured by a company during some years: Year, 1992, 1993, 1994, 1995, 1996, 1997 Manure (In thousand tonnes), 15, 35, 45, 30, 40, 20 Represent the above data with the help of a bar graph. Indicate with the help of the bar graph the year in which the amount of manure manufactured by the company was maximum. Choose the correct alternative: The consecutive years during which there was maximum decrease in manure production are: 1994 to 1995 (b) 1992 and 1993 1996-1997 (d) 1995 and 1996
View Solution
Knowledge Check
The following graph gives the amount of manure (in thousand tonnes) manufactured by a company during some years.

In which year the amount of manure manufactured by the company was maximum?A1993B1994C1996D1997The following graph gives the amount of manure (in thousand tonnes) manufactured by a company during some years.

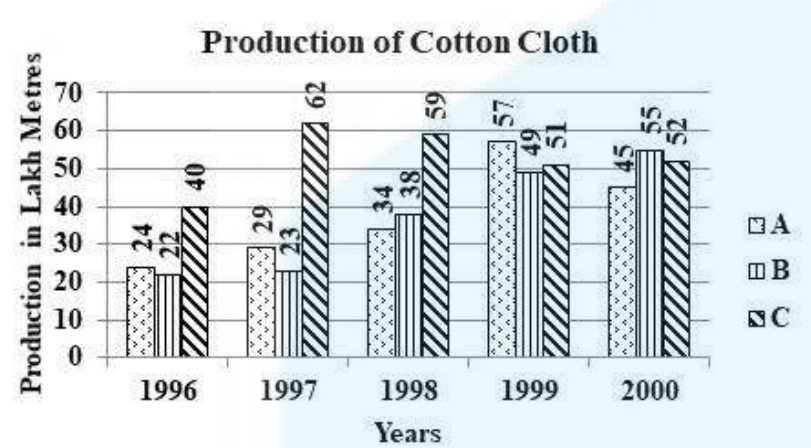
In which year the amonnt of manure manufactured by the company was minimum?A1992B1993C1995D1997The following graph shows the production of cotton cloth (in lakh metres) by three companies A, B and C over the years.

What is the ratio of the production of Company C in the years 1996 and 1997 to the production of Company B in the years 1999 and 2000?A3:11B51:52C11:3D52:51
The following data gives the number of students of Delhi state who went abroad for study during some years: year: 1995 1996 1997 1998 1999 2000 No. of Students 1400 1600 1250 1000 2000 2200 Represent the above data with the help of a bar graph.
View SolutionThe following data gives the number of students of Delhi state who went abroad for study during some years: year 1995 1996 1997 1998 1999 2000 No. of Students 1400 1600 1250 1000 2000 2200 Represent the above data with the help of a bar graph.
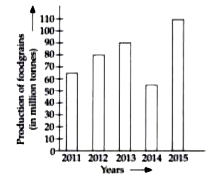
View SolutionRead the bar graph given below and answer the following questions.

Find the difference between the production of foodgrains in million tonnes) in the year 2012 and 2015.
View SolutionThe following table gives the route length (in thousand kilometres) of the Indian Railways in some of the years: Year, 1960-61, 1970-71, 1980-81, 1990-91, 2000-2001 Route length (in thousand kilometres), 56, 60, 61, 74, 98 Represent the above data with the help of a bar graph.
View SolutionThe following data gives the number (in thousands) of applicants registered with an Employment Exchange during, 1995-2000: year, 1995, 1996, 1997, 1998, 1999, 2000 No. of application (Registered (in Thousand), 18, 20, 24, 28, 30, 34 Construct a bar graph to represent the above data.
View Solution
