Total number of visitors and Percentage of male and out of these visitors are give
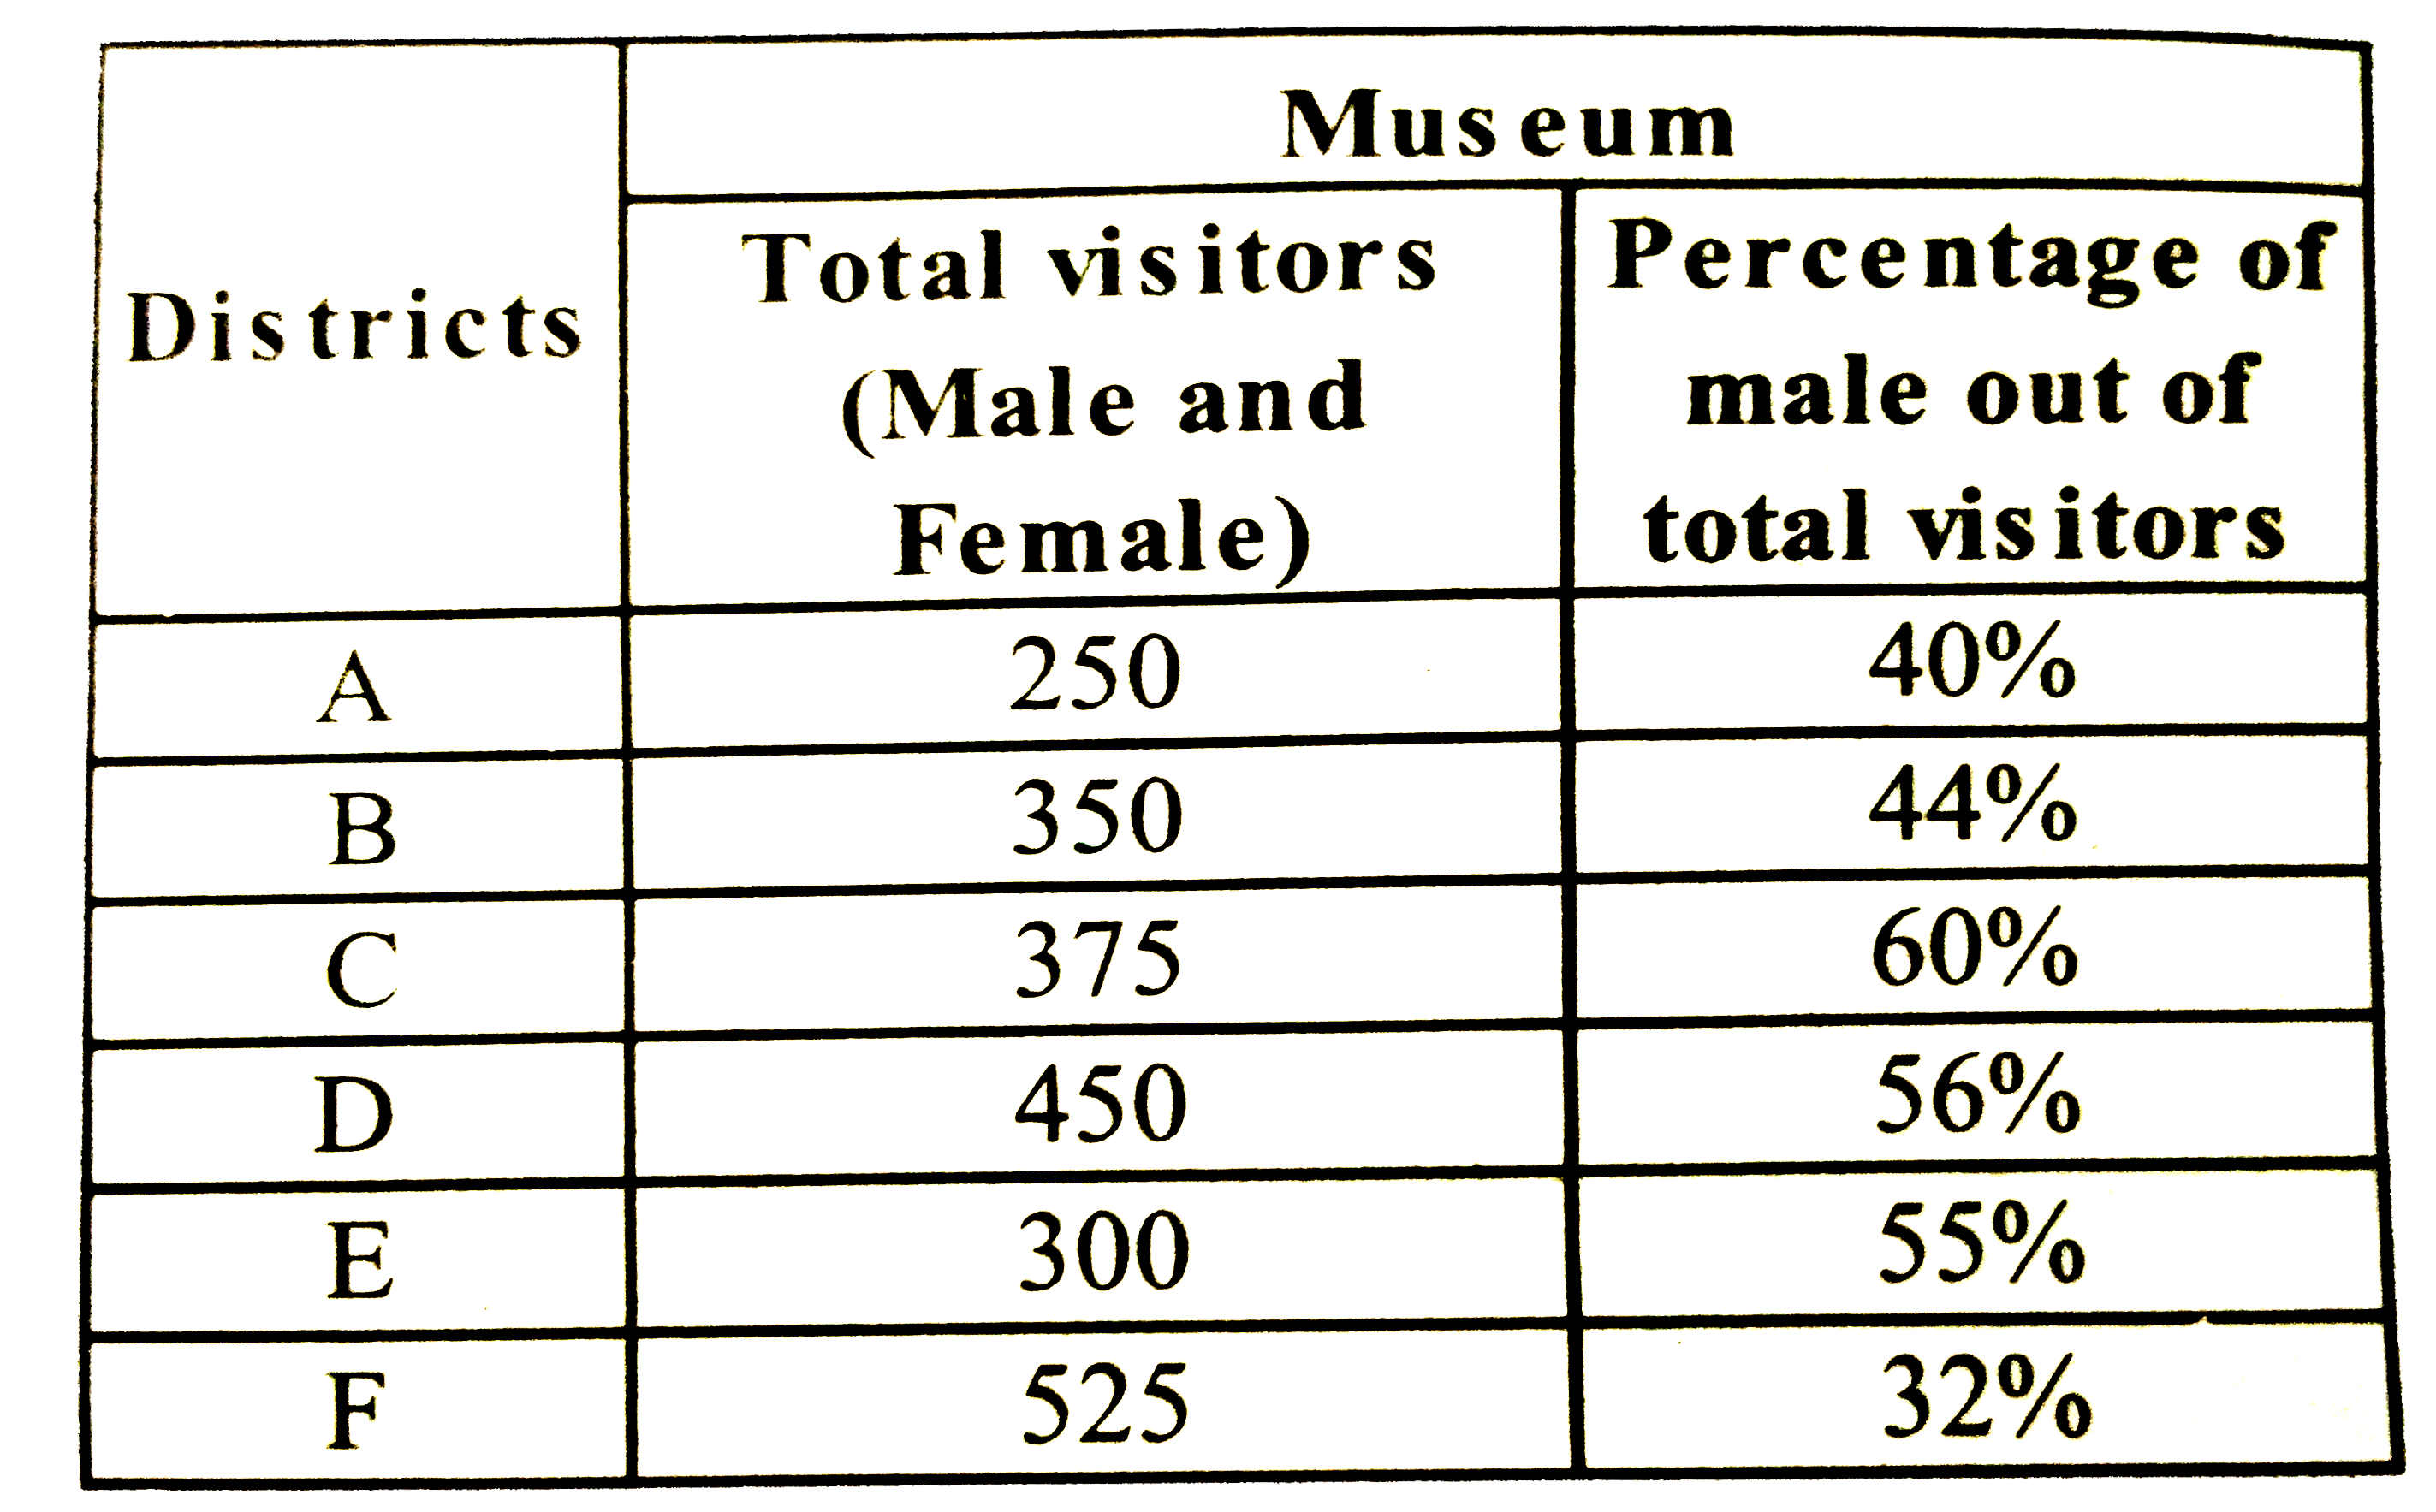
Male visitors from district C to see the museum are what percent more /less than the female visitors from district E to see the museum ?(Calculate up to two decimal points)
3313%
3312%
6613
6623%
The correct Answer is:D
Required %255−135135×100
=6623%
Topper's Solved these Questions
Similar Questions
Total number of visitors and Percentage of male and out of these visitors are give
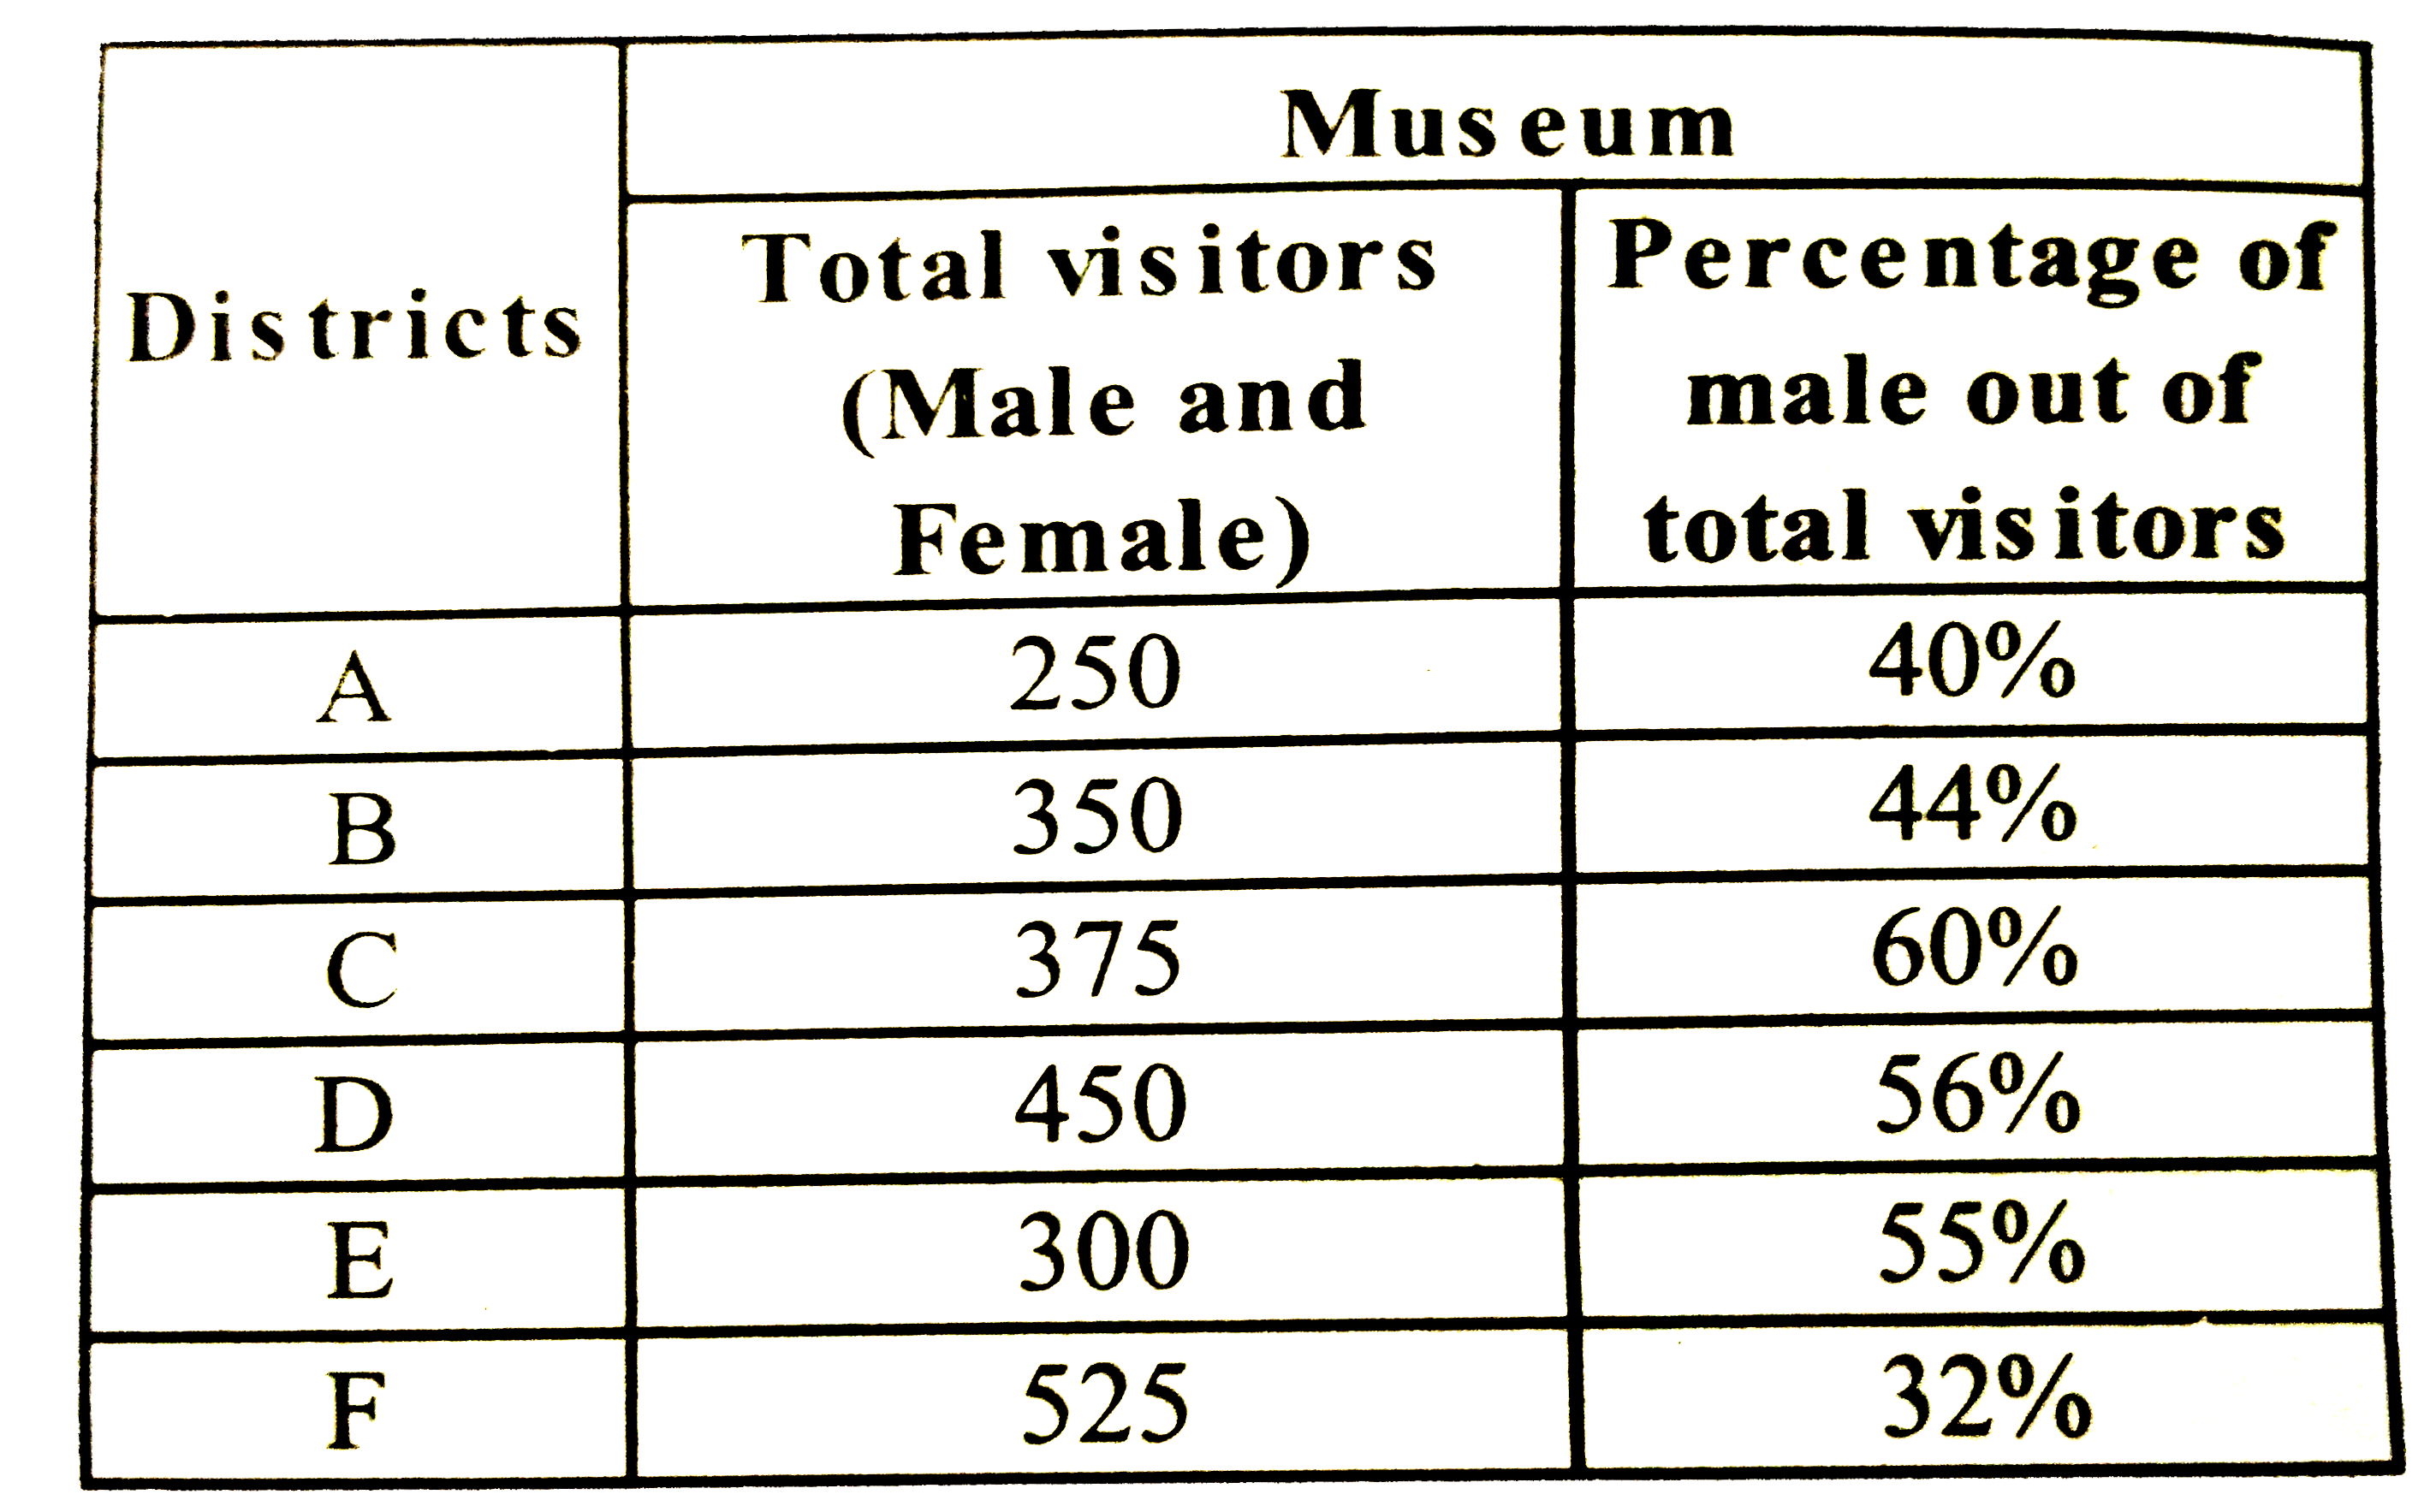
Find the ratio of the male visitors from district E and F together to see the museum to the female visitors form district C and D together to see the museum ?
View SolutionTotal number of visitors and Percentage of male and out of these visitors are give
The number of female visitors from district B and C together to see the museum are how much more/less than total number of male are visitors from district C and D together to see the museum ?
View Solution
Knowledge Check
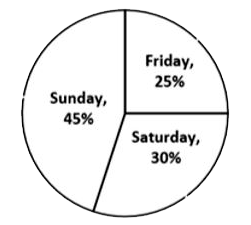
Study the following piechart and table carefully to answer the questions that follow.
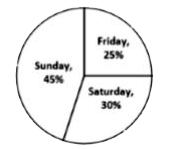
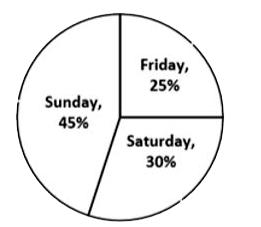
Percentage of visitors (male and female) in a museum on the given 3 days-Friday, Saturday and Sunday is depicted in the pie chart given below.
Total number of visitors on the given three days = 400
Ratio of male visitors to female visitors on the given three days is depicted in the table given below:
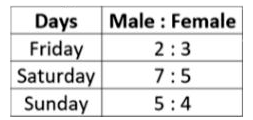
The number of female visitors on Friday was what percentage of the number of female visitors on Sunday?A70%B85%C80%D75%Study the following piechart and table carefully to answer the questions that follow.
Percentage of visitors (male and female) in a museum on the given 3 days-Friday, Saturday and Sunday is depicted in the pie chart given below.
Total number of visitors on the given three days = 400
Ratio of male visitors to female visitors on the given three days is depicted in the table given below:
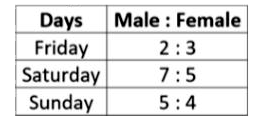
On Tuesday, the number of female visitors was 1/5 more than that of Saturday. If the respective ratio between the number of male visitors and that of female visitors on Tuesday is 11 : 6, then what was the total number of visitors (male and female) on Tuesday?A208B170C182D130Study the following piechart and table carefully to answer the questions that follow.
Percentage of visitors (male and female) in a museum on the given 3 days-Friday, Saturday and Sunday is depicted in the pie chart given below.
Total number of visitors on the given three days = 400
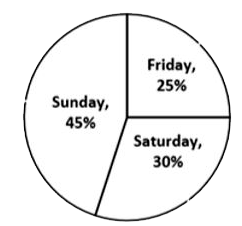
Ratio of male visitors to female visitors on the given three days is depicted in the table given below:
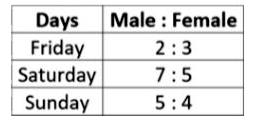
What is the central angle corresponding to the number of visitors (male and female) on Sunday (in degrees)?A172.8∘B165.6∘C162∘D154∘
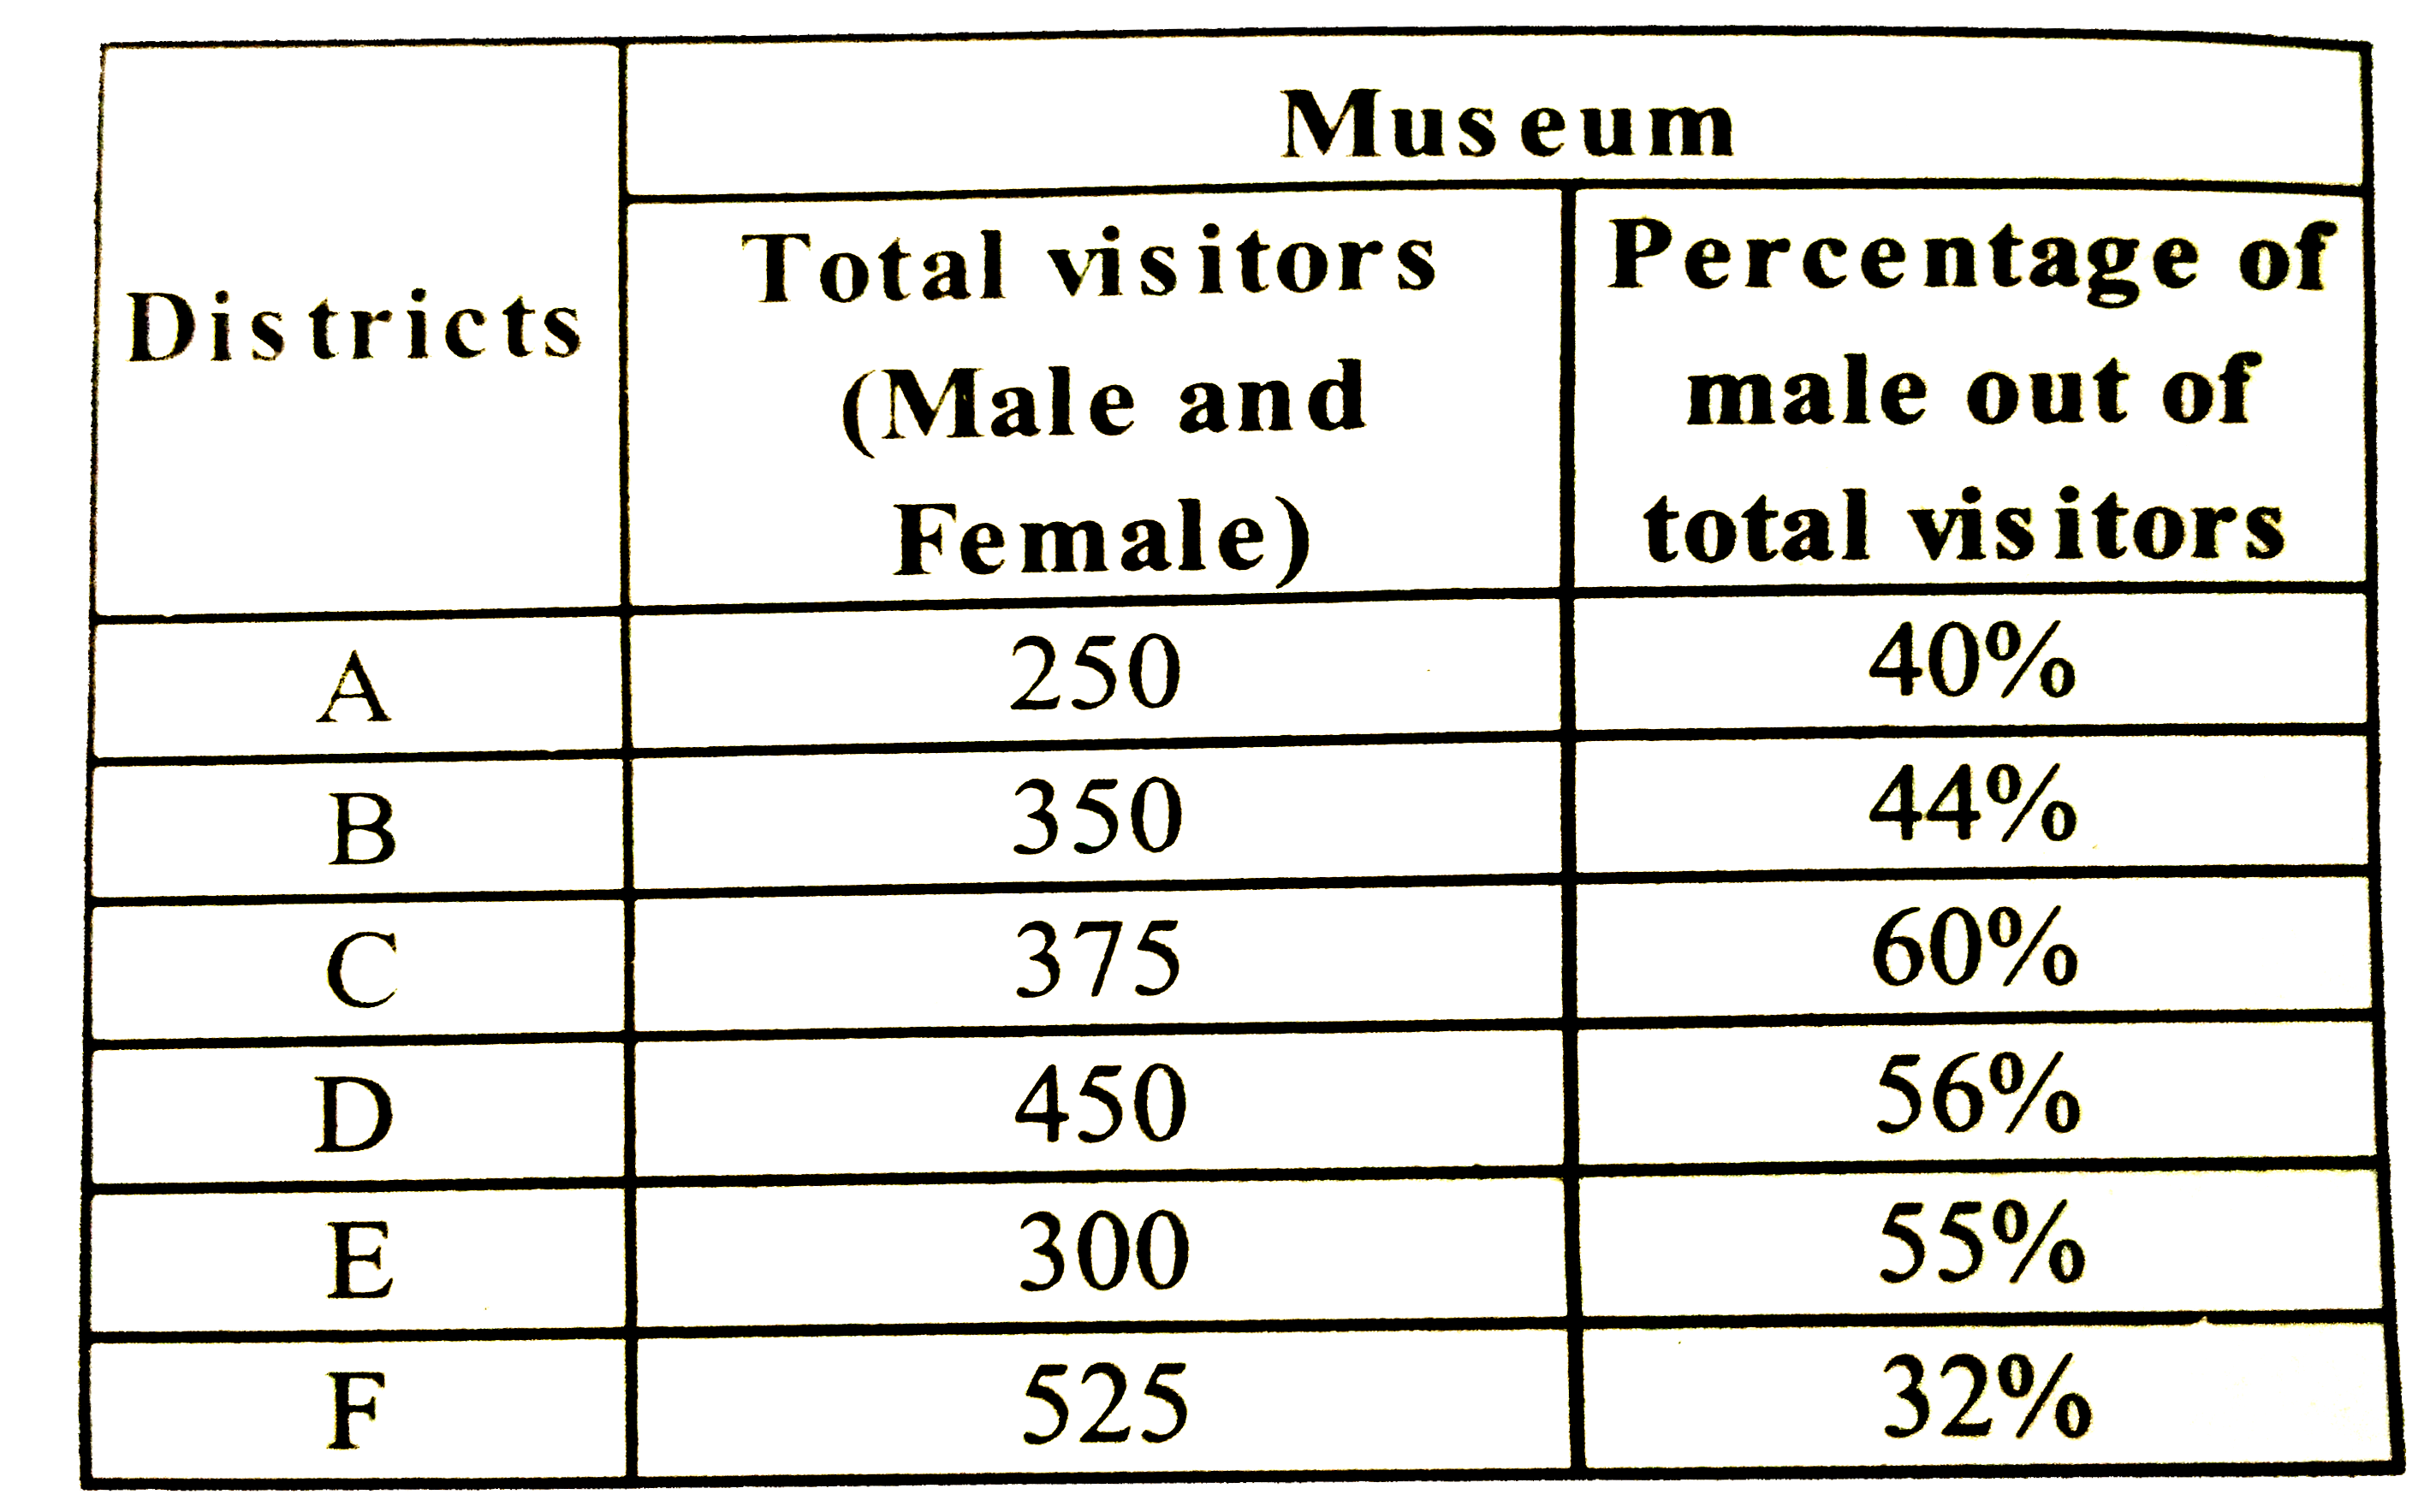
Total number of visitors and Percentage of male and out of these visitors are give
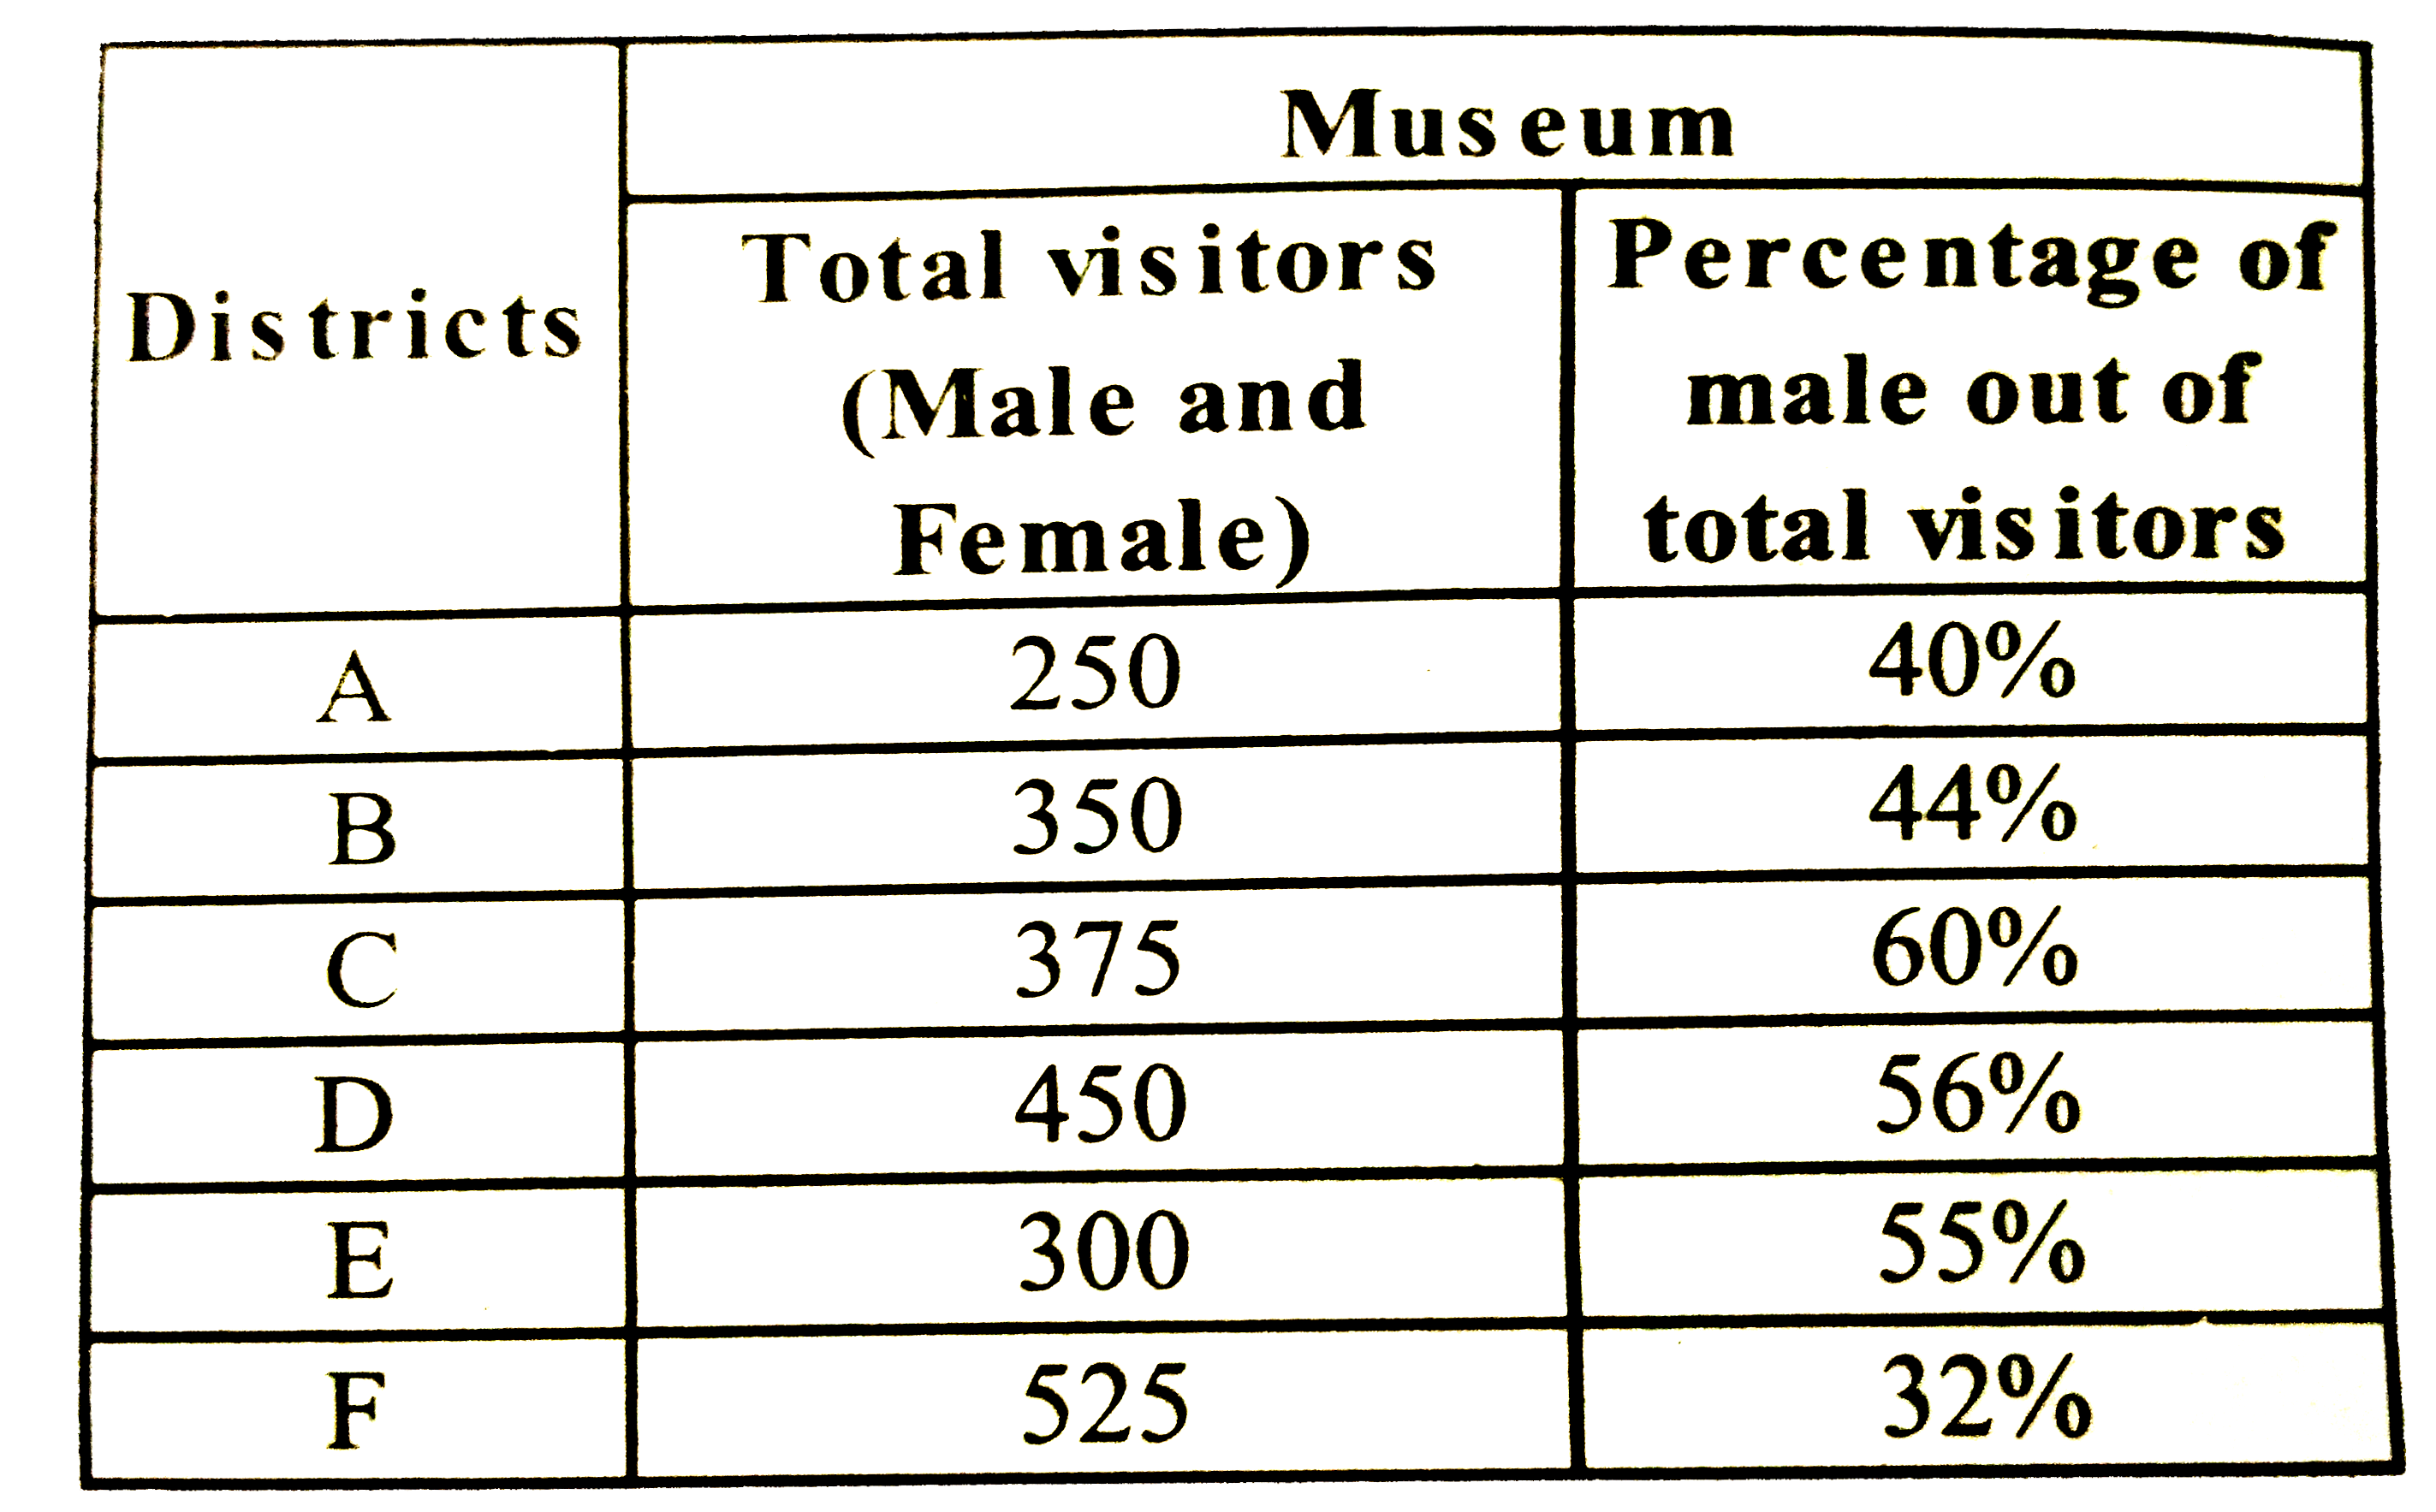
Average number of visitors from district A, B and C together to see the museum are approximately what percent of the average number of visitors from district D,E and F together to see the museum.
View SolutionTotal number of visitors and Percentage of male and out of these visitors are give
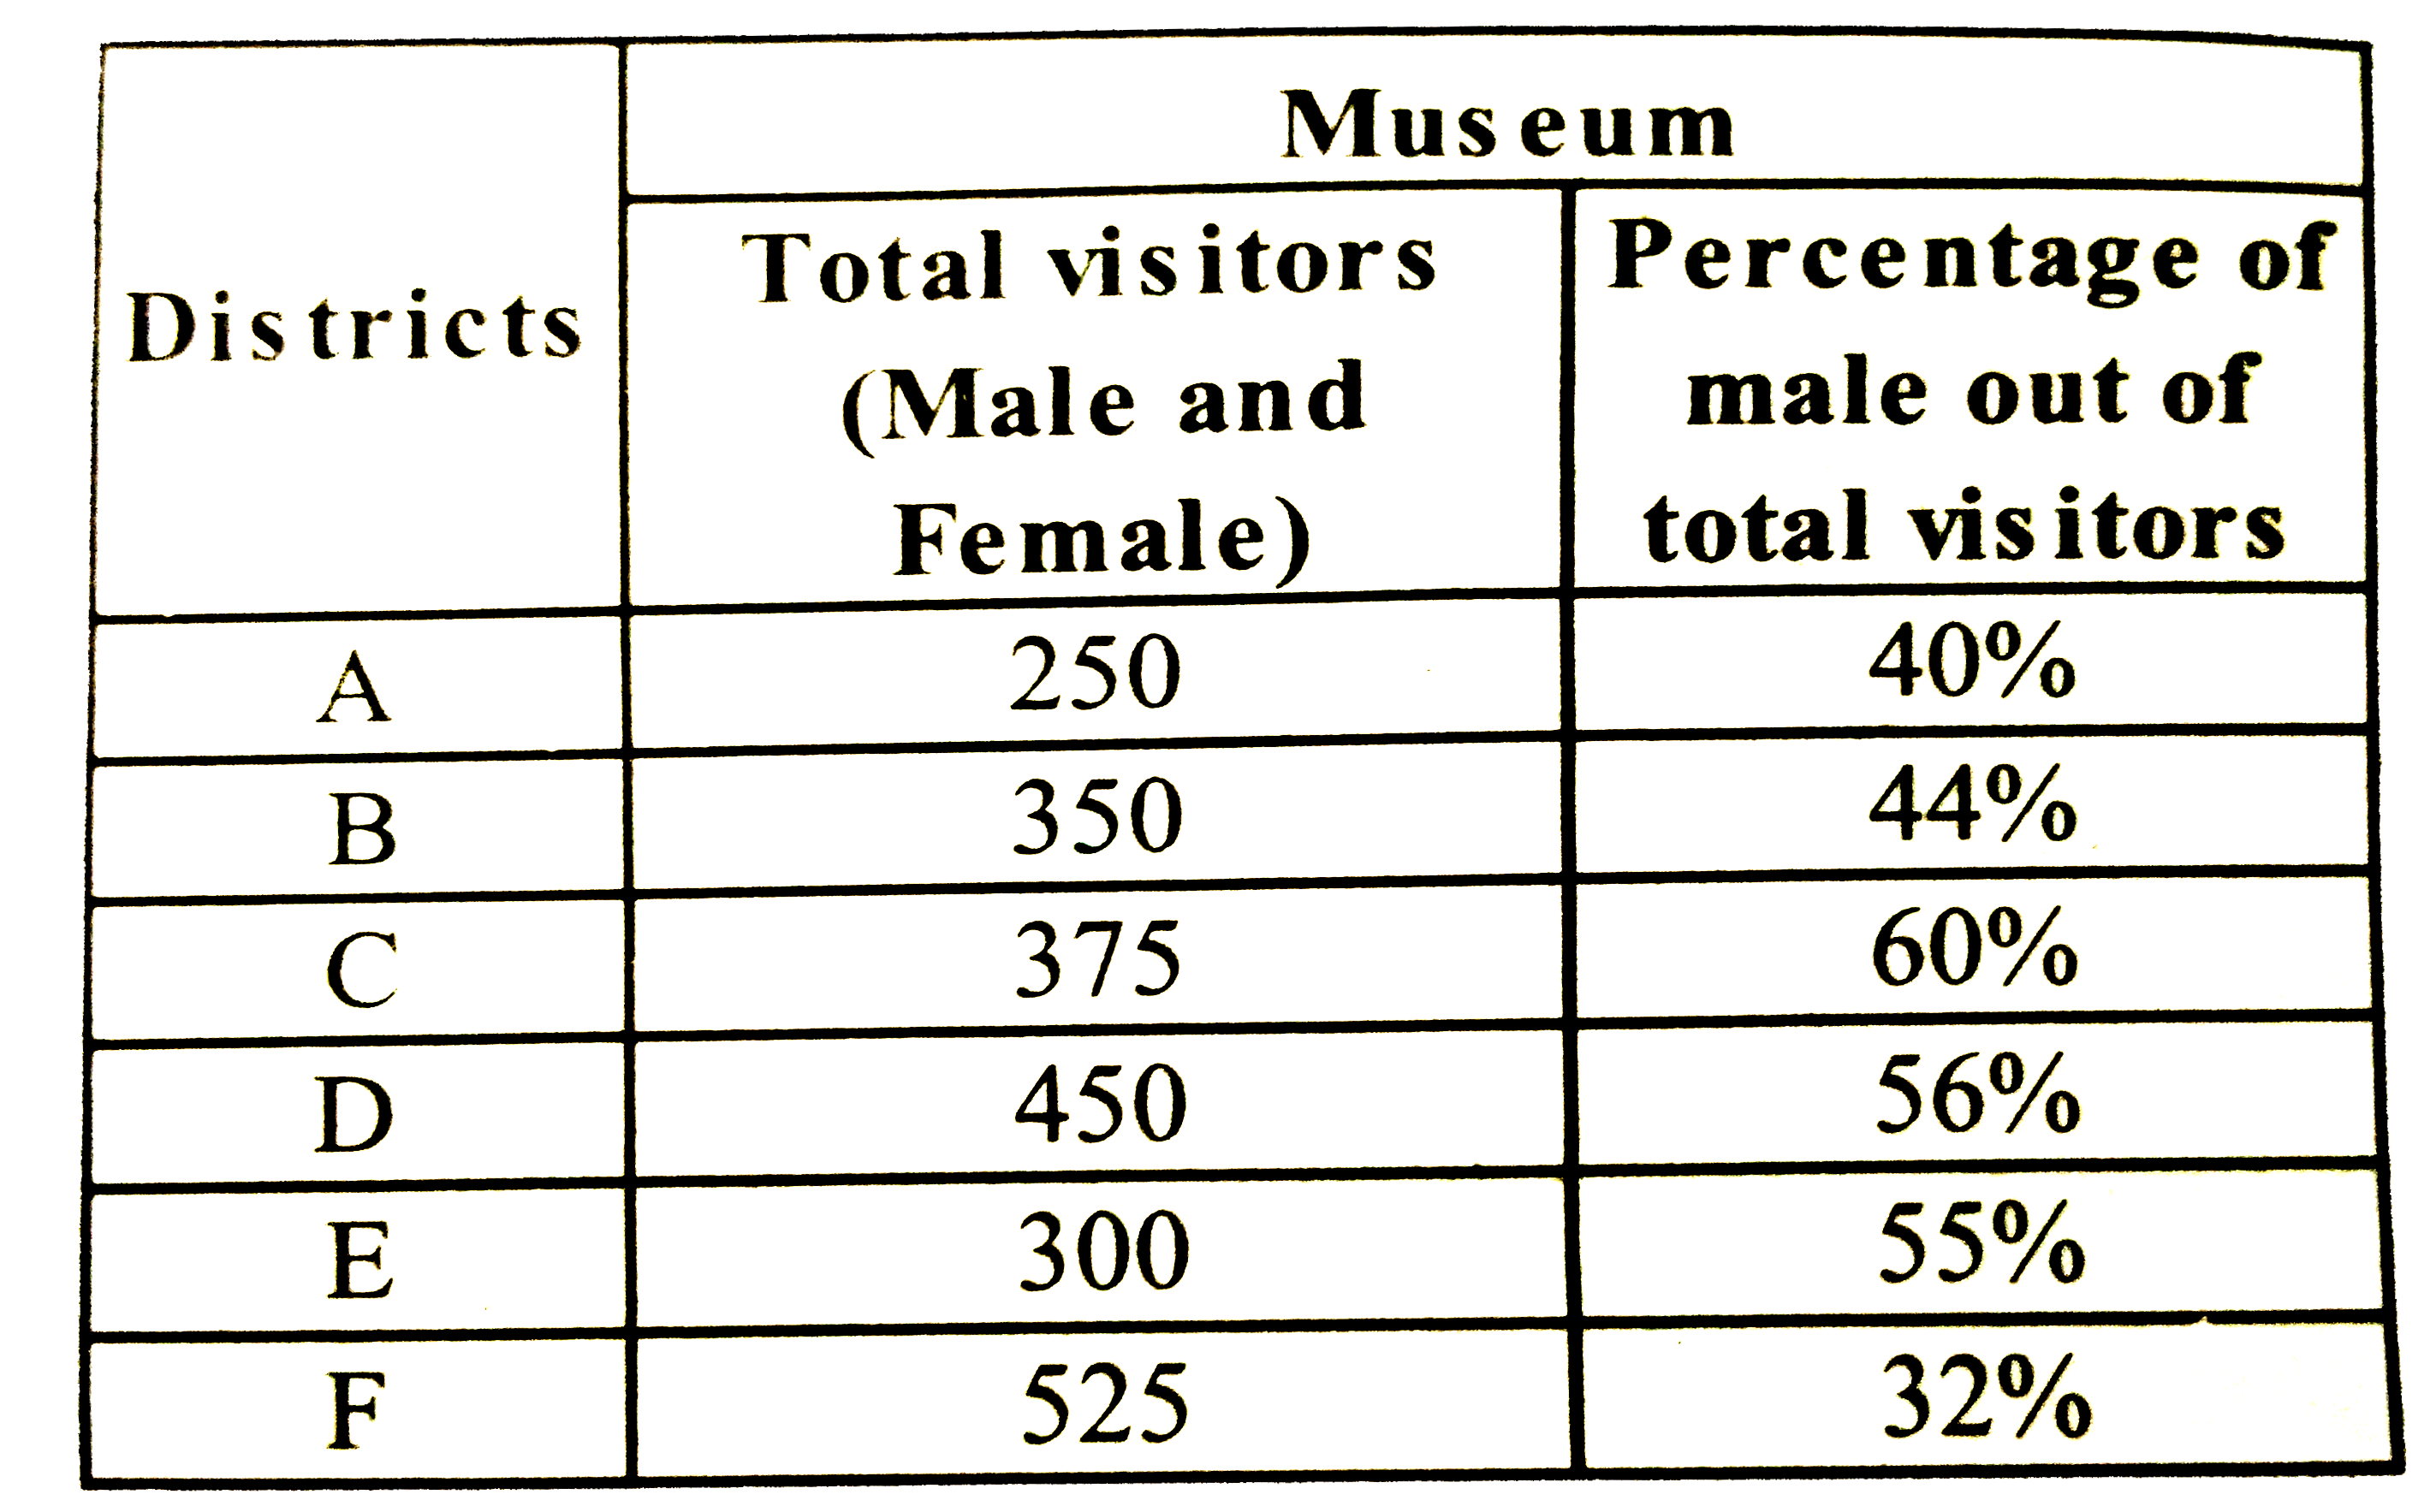
Find the difference between the total number of male visitors from district B, C and D together to see the museum and the total number of female visitors from district, D E and F together to see the museum ?
View SolutionStudy the following piechart and table carefully to answer the questions that follow.
Percentage of visitors (male and female) in a museum on the given 3 days-Friday, Saturday and Sunday is depicted in the pie chart given below.
Total number of visitors on the given three days = 400
Ratio of male visitors to female visitors on the given three days is depicted in the table given below:
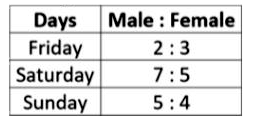
Out of the total number of visitors on Saturday, 35% were adults. The cost for 1 adult’s ticket is double that for one child’s ticket. If the total amount collected from selling tickets on Saturday was Rs.8100. What is the cost of 1 adult’s ticket?
View SolutionThe given bar graph shows the sales of cars from six branches of a dealer B1,B2,B3,B4,B5,B6 . During two consecutive years 2018 and 2019 .Blue colour corresponds to the year 2018 and red colour corresponds to the year 2019 .

The total sale of cars from all the branches in the year 2018 is what percentage less than the total sales of cars from all the branches in the year 2019 ? (correct to one decimal place)
View SolutionThe given table represents the number of computers sold by four dealers A,B, C and D during the first six months of 2016. Study the table carefully and answer the questions that follows:
दी गयी तालिका चार विक्रेताओं A, B, C और D के द्वारा 2016 के पहले छः महीनों में बेचे गए कंप्यूटरों की संख्या दर्शाती है | इस तालिका का ध्यानपूर्वक अध्ययन करें तथा पूछे गए प्रश्नों का उत्तर दें |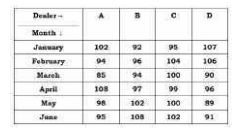 The total number of computers sold by dealer A during February to June is what percentage more
than the total number of computers sold by all the dealers in June?(Correct to one decimal place) /
फरवरी से जून के दौरान विक्रेता A के द्वारा बेचे गए कंप्यूटरों की कुल संख्या सभी विक्रेताओं के द्वारा जून में बेचे गए कंप्यूटरों की कुल संख्या से कितना प्रतिशत अधिक है ?
View Solution
