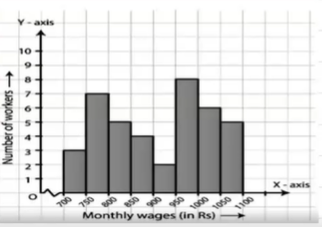
The following histogram shows the monthly wages
(in Rs.) of workers in a factory:
Figure
Find the largest and least number of workers
and also their wages in rupees.

Step by step video & image solution for The following histogram shows the monthly wages (in Rs.) of workers in a factory: Figure Find the largest and least number of workers and also their wages in rupees. by Maths experts to help you in doubts & scoring excellent marks in Class 8 exams.
Updated on:21/07/2023Topper's Solved these Questions
- DATA HANDLING-I (CLASSIFICATION AND TABULATION DATA)BOOK - RD SHARMACHAPTER - DATA HANDLING-I (CLASSIFICATION AND TABULATION DATA)EXERCISE - All Questions
27 Videos
- DATA HANDLING-III (PIE CHARTS OR CIRCLE GRAPHS)BOOK - RD SHARMACHAPTER - DATA HANDLING-III (PIE CHARTS OR CIRCLE GRAPHS)EXERCISE - All Questions
32 Videos
Similar Questions
Knowledge Check
The monthly salaries of 50 workers in a factory are given below :

Find the mean salary of workersArs 9,440BRs 9,990CRs 9,098DRs 9,198
The following table gives the weekly wage of workers in a factory:

Find the (i) mean (ii) modal class (iii) the mode.
View SolutionMonthly wages of workers of a factory are stated below. Find out the range and the coefficient of range.

View SolutionFind the mean of the daily wages of 60 workers in a factory as per given below
View SolutionThe following table shows the frequency table of daily wages of 50 workers in a trading company. Find the mean wages of a worker, by assumed mean method.

View SolutionThe following table shows monthly wages of 10 workers:

Calculate first third quartiles and quartile deviation.
View Solutionif 15% of the workers in a factory are females and the number of male workers is 272 find the total number of workers in the factory
View SolutionThe following data shows daily wages of 199 workers of a factory. Find out quartile deviation and the coefficient of quartile deviation.

View Solution


