Number of workshops organized by a school in different areas during the last five years are as follows: years, No. of workshops 1995-1996 1996-1997 1997-1998 1998-1999 1999-2000, 25 30 42 50 65 Draw a histogram representing the above data.
Step by step video & image solution for Number of workshops organized by a school in different areas during the last five years are as follows: years, No. of workshops 1995-1996 1996-1997 1997-1998 1998-1999 1999-2000, 25 30 42 50 65 Draw a histogram representing the above data. by Maths experts to help you in doubts & scoring excellent marks in Class 8 exams.
Updated on:21/07/2023Topper's Solved these Questions
- DATA HANDLING-I (CLASSIFICATION AND TABULATION DATA)BOOK - RD SHARMACHAPTER - DATA HANDLING-I (CLASSIFICATION AND TABULATION DATA)EXERCISE - All Questions
27 Videos
- DATA HANDLING-III (PIE CHARTS OR CIRCLE GRAPHS)BOOK - RD SHARMACHAPTER - DATA HANDLING-III (PIE CHARTS OR CIRCLE GRAPHS)EXERCISE - All Questions
32 Videos
Similar Questions
The following table shows the interest paid by a company (in lakhs): Year, 1995-96, 1996-97, 1997-98, 1998-99, 1999-2000 Interest (in lakhs of rupees), 20, 25, 15, 18, 30 Draw the bar graph to represent the above information.
View SolutionThe results of pass percentage of Class X and XII in C.B.S.E examination for 5 years are given in the following table: Year, 1994-95, 1995-96, 1996-97, 1997-98, 1998-99 X, 90, 95, 90, 80, 98 XII, 95, 80, 85, 90, 95 Draw bar graphs to represent the data
View Solution
Knowledge Check
Study the following information carefully and answer the questions given below:
Following are the conditions for appointing Financial Analysts in an organisation.
The candidate must
(i) be a graduate in any discipline with at least 60 percent marks.
(ii) have one of the professional qualifications of CA/ CWA /MBA-Finance / CFA.
(iii) not be more than 30 years of age as on 1.5.2003.
(iv) have passed the competitive written examination with at least 50 percent marks.
(v) have work experience of at least four years.
In the case of a candidate who fulfils all the criteria
EXCEPT-
(A) at (ii) above, but has completed his/ her post graduation in Commerce with at least 55 percent marks, his/her case is to be referred to the Director- Finance.
(B) at (v) above, but has obtained a PhD degree after completing the postgraduate professional qualification, his/her case is to be referred to the Managing Director.
Ineachquestionbelow,detailedinformationofacandidate is provided. You have to read the information provided carefully and dedde which of the following courses of action you will adopt regarding status of the candidate based on the conditions stated above. You are not to assume anything other than the information provided in each question. These cases are given to you as on 1.5.2003. You have to indicate your dedsion by marking answers to each question as follows : Give answer
Sangeeta Banerjee is a postgraduate in Commerce. She has been working for the last five years. She was twenty- six years old as on 17th December, 2001. She has secured 65 percent and 55 percent marks in the ICWA and the competitive written examination respectivelyAif the candidate is not to be appointed.Bif the case is to be referred to the Managing DirectorCif the candidate is to be appointed.Dif the data is not adequate to take proper decision
Total number of students of a school in different years is shown in the following table: Year, No. of Students 1996 1998 2000 2002 2004, 400 550 450 600 650 Represent the above data by a pictograph. Prepare a pictograph of students using one symbol an icon of a student to represent 100 students and answer the following questions: How many symbols represent total number of students in the year 2002? How many symbols represent total number of students in the year 1998? Prepare another pictograph of students using any other symbol each representing 50 students. Which pictograph do you find more informative?
View SolutionThe following data gives the number of students of Delhi state who went abroad for study during some years: year 1995 1996 1997 1998 1999 2000 No. of Students 1400 1600 1250 1000 2000 2200 Represent the above data with the help of a bar graph.
View SolutionThe following data gives the number (in thousands) of applicants registered with an Employment Exchange during, 1995-2000: year, 1995, 1996, 1997, 1998, 1999, 2000 No. of application (Registered (in Thousand), 18, 20, 24, 28, 30, 34 Construct a bar graph to represent the above data.
View SolutionThe following data gives the number of students of Delhi state who went abroad for study during some years: year: 1995 1996 1997 1998 1999 2000 No. of Students 1400 1600 1250 1000 2000 2200 Represent the above data with the help of a bar graph.
View SolutionThe following data gives the production of food grains (in thousand tonnes) for some years: Year 1995 1996 1997 1998 1999 2000 Production (in thousand tonnes) 120 150 140 180 170 190 Represent the above data with the help of a bar graph.
View SolutionStudy the graph and answer the question that follows.

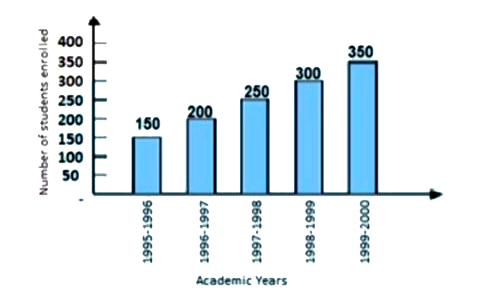
What is the ratio of enrolment during 1995 - 1996 to the enrolment during 1998 - 1999?
View SolutionThe following data gives the amount of manure (in thousand tonnes) manufactured by a company during some years: Year, 1992, 1993, 1994, 1995, 1996, 1997 Manure (In thousand tonnes), 15, 35, 45, 30, 40, 20 Represent the above data with the help of a bar graph. Indicate with the help of the bar graph the year in which the amount of manure manufactured by the company was maximum. Choose the correct alternative: The consecutive years during which there was maximum decrease in manure production are: 1994 to 1995 (b) 1992 and 1993 1996-1997 (d) 1995 and 1996
View Solution
