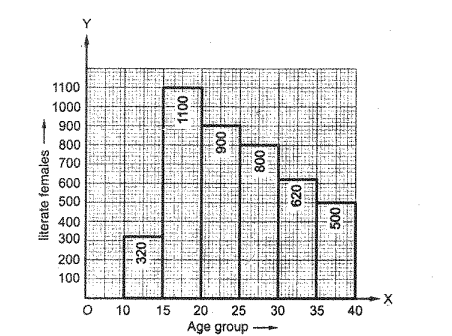
The following histogram shows the number of
literate females in the age group of 10 to 40 years in a town:
Figure
Write the age group in which the number of
literate female is the highest.
What is the class width?
What is the lowest frequency?
What are the class marks of the classes?
In which age group literate females are the
least?
Step by step video & image solution for The following histogram shows the number of literate females in the age group of 10 to 40 years in a town: Figure Write the age group in which the number of literate female is the highest. What is the class width? What is the lowest frequency? What are the class marks of the classes? In which age group literate females are the least? by Maths experts to help you in doubts & scoring excellent marks in Class 8 exams.
Updated on:21/07/2023Topper's Solved these Questions
- DATA HANDLING-I (CLASSIFICATION AND TABULATION DATA)BOOK - RD SHARMACHAPTER - DATA HANDLING-I (CLASSIFICATION AND TABULATION DATA)EXERCISE - All Questions
27 Videos
- DATA HANDLING-III (PIE CHARTS OR CIRCLE GRAPHS)BOOK - RD SHARMACHAPTER - DATA HANDLING-III (PIE CHARTS OR CIRCLE GRAPHS)EXERCISE - All Questions
32 Videos
Similar Questions
The below histogram shows the number of literate females in the age group of 10 to 40 years in a town.
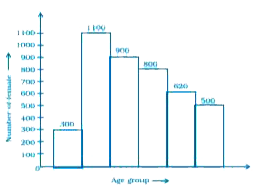
What is the classes width?
View SolutionThe below histogram shows the number of literate females in the age group of 10 to 40 years in a town.
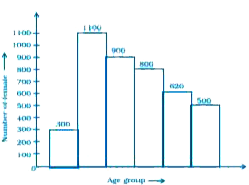
In which age group is the number of literate females the highest?
View Solution
Knowledge Check
Study the following histogram and answer the questions.
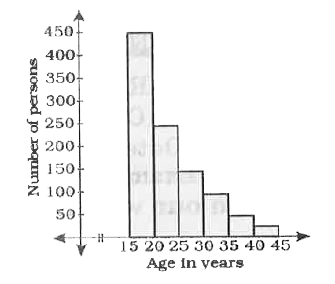
The number of persons in the age group 20 - 30 years is :A475B400C300D700The number of females in the age group 16−35 who do not read sports magazine, is
A120B90C60D30Study the following histogram and answer the questions.
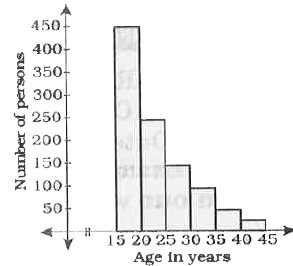
The total number of persons in the age group of 15 years to 45 years is :A450B800C1000D500
The below histogram shows the number of literate females in the age group of 10 to 40 years in a town.
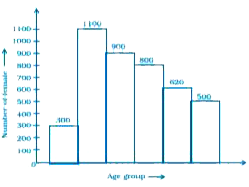
In which age group are literate females the least?
View SolutionThe following table shows the number of illitrate persons in the age group (10-58 Years) in a town. Represents the given data by means of a histogram.

View SolutionThe histogram given below shows the number of literate females iin the age group of 10 to 40 years. Study the histogram carefully and answer the questions that follow.
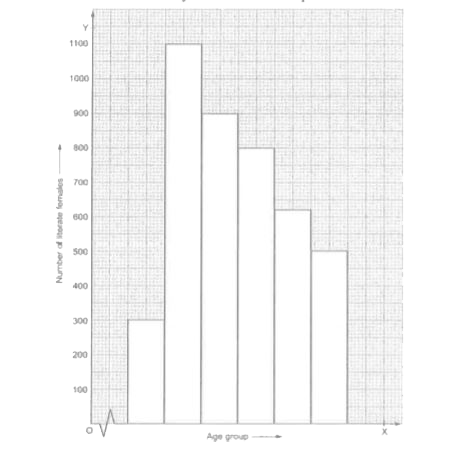
(i) Write the classes, assuming that all the classes are of equal width.
(ii) What is the class width?
(iii) In which age group are the literate females the least?
(iv) In which age group is the number of literate females the highest?
View SolutionThe given table presents the number of illiterate males in the age group (10-34) in a town.

Draw a histogram to represent the above data.
View SolutionWhat is the total number of person in the age group of 20 to 50 years in the villages A and B, taken together
View Solution
