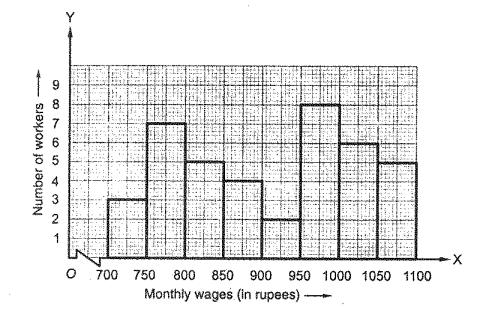
The following histogram shows the monthly wages
(in Rs.) of workers in a factory:

(Figure)
In which wage-group the largest number of workers are being kept? What is their number?
What wages are the least number of workers
getting? What is the number of such workers?
What is the total number of workers?
What is the factory size?
Step by step video & image solution for The following histogram shows the monthly wages (in Rs.) of workers in a factory: (Figure) In which wage-group the largest number of workers are being kept? What is their number? What wages are the least number of workers getting? What is the number of such workers? What is the total number of workers? What is the factory size? by Maths experts to help you in doubts & scoring excellent marks in Class 8 exams.
Updated on:21/07/2023Topper's Solved these Questions
- DATA HANDLING-I (CLASSIFICATION AND TABULATION DATA)BOOK - RD SHARMACHAPTER - DATA HANDLING-I (CLASSIFICATION AND TABULATION DATA)EXERCISE - All Questions
27 Videos
- DATA HANDLING-III (PIE CHARTS OR CIRCLE GRAPHS)BOOK - RD SHARMACHAPTER - DATA HANDLING-III (PIE CHARTS OR CIRCLE GRAPHS)EXERCISE - All Questions
32 Videos
Similar Questions
if 15% of the workers in a factory are females and the number of male workers is 272 find the total number of workers in the factory
View SolutionIn a factory, women are 35% of all the workers, the rest of the workers being men. The number of men exceeds that of women by 252. Find the total number of workers in the factory.
View Solution
Knowledge Check
In a factory one out of every 9 is female worker. If the number of female workers is 125, the total number of workers is
A1250B1125C1025D1000In a factory one out of every 9 is a female worker. If the number of female workers is 125, the total number of workers is
A1250B1125C1025D1000The ratio of male and female workers in a factory is 8:5. If there are 104 male workers. Find the number of female workers in the factory.
A60B65C70D75
Ratio of the number of male and female workers in a factory is 5:3. If there are 115 male workers, determine the number of female workers in the factory.
View Solutionin a factory,women are 35% of all the workers,the rest of the workers being men.the number of men exceeds that of women by252 .find the total number of workers in the factory."]
View SolutionFind the mean of the daily wages of 60 workers in a factory as per given below
View SolutionIn a company 60% workers are males. It the number of females. Workers in the company is 800. What is the number of male workers in the company ?
View SolutionThe daily wages (in rupees) of 60 workers in a factory are given below
Find the mean daily wages

View Solution
