In the month of July 2004, a house holder spent his monthly salary amounting to Rs. 7200 on different items as given below: Items, Clothing, Food, House Rent, Education, Misc. Amount spent (in Rs.), 600, 4000, 1200, 400, 1000 Represent the information in the form of a pie-chart.
Step by step video & image solution for In the month of July 2004, a house holder spent his monthly salary amounting to Rs. 7200 on different items as given below: Items, Clothing, Food, House Rent, Education, Misc. Amount spent (in Rs.), 600, 4000, 1200, 400, 1000 Represent the information in the form of a pie-chart. by Maths experts to help you in doubts & scoring excellent marks in Class 8 exams.
Updated on:21/07/2023Topper's Solved these Questions
Similar Questions
Draw a pie-diagram for the following data of expenditure pattern in a family: Items, Food, Clothing, Rent, Edu, Misc. Expenditure (in Rs) 4000, 2000, 1500, 1500, 1000
View SolutionFollowing is the break up of the expenditure of a family on different items of consumption.: Items, Food, Clothing, Rent, Education, Fuel etc., Medicine, Misc. Expenditure (in Rs), 1600, 200, 600, 150, 100, 80, 270 Draw a pie-diagram to represent the above data.
View Solution
Knowledge Check
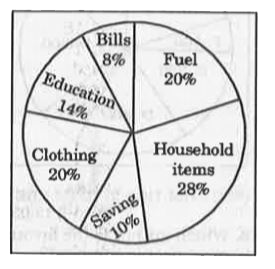
The given pie chart shows the monthly expenditure on various items and monthly savings of a household. The same distribution is followed for all the months of the year.

If the difference in monthly expenditure on clothing and education is Rs. 9000, then what is the different (in Rs.) in yearly saving and yearly expenditure on bills?A64000B76000C36000D48000The given pie chart shows the monthly expenditure on various items and monthly savings of a household. The same distribution is followed for all the months of the year.

If the difference in monthly expenditure on clothing and education is Rs. 9000, then what is the different (in Rs.) in yearly saving and yearly expenditure on bills?A64000B76000C36000D48000Mr Sumanth spends two-fifth of his salary on house rent and one-fouth on food. After spending Rs 2000 on miscellaneous, if he could save an amount of Rs 5000, then find his monthly income (in Rs)
A20000B25000C15000D16000
The following data shows the expenditure of a person on different items during a month. Represent the data by a pie-chart. Items of expenditure, Rent, Education, Food, Clothing, Others Amount (in Rs.), 2700, 1800, 2400, 1500, 2400
View SolutionMonthly salary of a person is Rs. 15000. Then the amount he spends on food and house rent given the central angle of the sector representing this is 60∘.
View SolutionThe following data gives the amount spent on the construction of a house. Draw a pie diagram. Items, Cement, Timber, Bricks, Labour, Steel, Misc. Expenditure (in thousand Rs), 60, 30, 45, 75, 45, 45
View SolutionFind the central angles of the components of a data given below, when represented in a pie chart ?
¯¯¯¯¯¯¯¯¯¯¯¯¯¯¯¯¯¯¯¯¯¯¯¯¯¯¯¯¯¯¯¯¯¯¯¯¯¯¯¯¯¯¯¯¯¯¯¯¯¯¯¯¯¯¯¯¯¯¯¯¯¯¯¯¯¯¯¯¯¯¯¯¯¯¯¯¯¯¯¯¯¯¯¯¯¯¯¯¯¯¯¯¯¯¯¯¯¯¯¯¯¯¯¯¯¯¯¯¯¯¯¯¯¯¯¯¯¯¯¯¯¯¯¯¯¯¯¯¯¯¯¯¯¯¯¯¯¯¯¯¯¯¯¯¯¯¯¯¯¯¯¯¯¯¯Component Food Education Rent Clothing Savings TotalExpenses (in Rs.) 3600 2400 2100 1200 1500 10800––––––––––––––––––––––––––––––––––––––––––––––––––––––––––––––––––––––––––––––––––––––––––––––––––––––
View SolutionMr Sumanth spends two-fifth of his salary on house rent and one-fouth on food. After spending Rs 2000 on miscellaneous, if he could save an amount of Rs 5000, then find his monthly income (in Rs)
View Solution
