Which of the following graphs shows a line where each value of y is three more than half of x?
Graph (1)

Graph (2)

Graph (3)

Graph (4)

The correct Answer is:B
Topper's Solved these Questions
Similar Questions
Knowledge Check
Which of the following figures has more than three lines of symmetry?
A B
B C
C D
D
Which of the following graphs shows a stong positive association between x and y?
A B
B C
C D
D
Which of the following is the graph of a line perpendicular to the line defined by the equation 2x+5y=10?
A B
B C
C D
D
Which of the following translations of the graph of y=x2 would result in the graph of y=x2−6x+k , where k is a constant greater than 10 ?
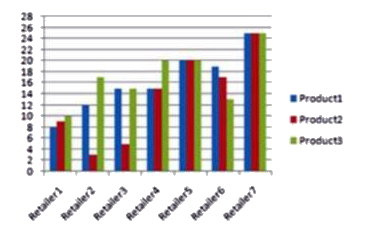
View SolutionBased on the following graph, which retailer offers all the three products for less than ? 10 each?

View SolutionWhich of the following option show more entropy of first compound than second:
View SolutionStudy the following graph carefully and answer the given questions :-
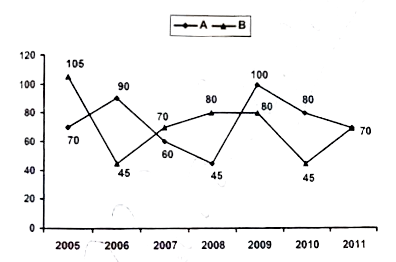
The following graph shows the % profit of two companies over the years :-

In which of the following years was the total income more than double the total expenditure in that year for company A ?
View SolutionEach of the following graphs in the standard (x,y) coordinate plane has the same scale on both axes. One graph is the graph of ax+by≤c, where 0<a<b<c. Which one is it?
View Solution

