Figure represents on the log-log scale pressure (P) dependence of adiabatic compressibility (K) of two gasses. Mark the correct option/s.
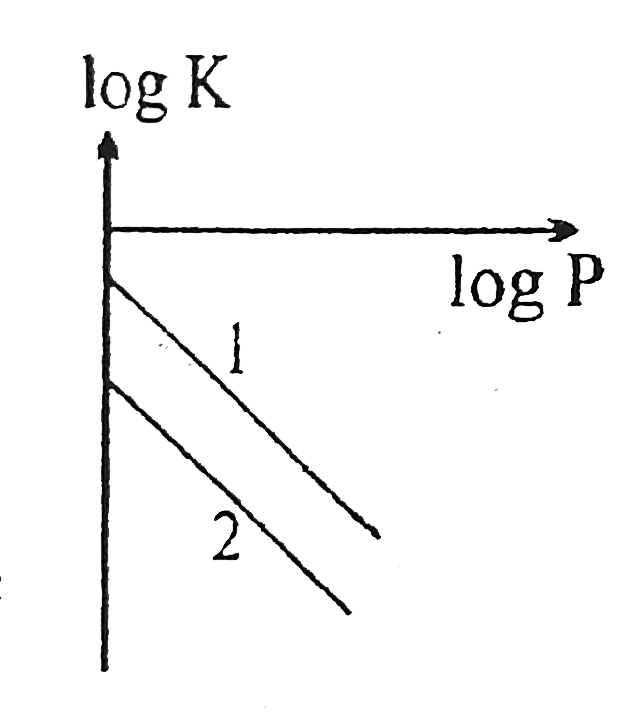
Line 1 & 2 may represent monoatomic and diatomic gas respectively.
Line1 & 2 may represent diatomic and monoatomic gasses respectively.
Degree of freedom for the gas represented by line 1 is more then the degree of freedom for line 2
Degree of freedom for the gas represented by line 2 is more than the degree of freedom for line 1.
The correct Answer is:B, C
Adiabatic compressibility (K) =1/(γP) Taking log
In K=−lnγP=−lnP−lnγ
Let lnK=y,lnP=xandlnγ=c
⇒y=−x−c
intercept on y axis is-c =−lnγ
⇒γ2>γ1
Higher γ means lower atomicity and lower degree of freedom. So (B) and (C)
Topper's Solved these Questions
- BOOK - BANSALCHAPTER - MASTER PRACTICE PROBLEMEXERCISE - Subjective107videos
MASTER PRACTICE PROBLEM
- BOOK - BANSALCHAPTER - MASTER PRACTICE PROBLEMEXERCISE - Additional topic70videos
MASTER PRACTICE PROBLEM
- BOOK - BANSALCHAPTER - MASTER PRACTICE PROBLEMEXERCISE - Reasoning75videos
MASTER PRACTICE PROBLEM
- BOOK - BANSALCHAPTER - FLUID MECHANICSEXERCISE - PYQS AIEEE10videos
FLUID MECHANICS
- BOOK - BANSALCHAPTER - SEMICONDUCTORSEXERCISE - CBSE Question32videos
SEMICONDUCTORS
Similar Questions
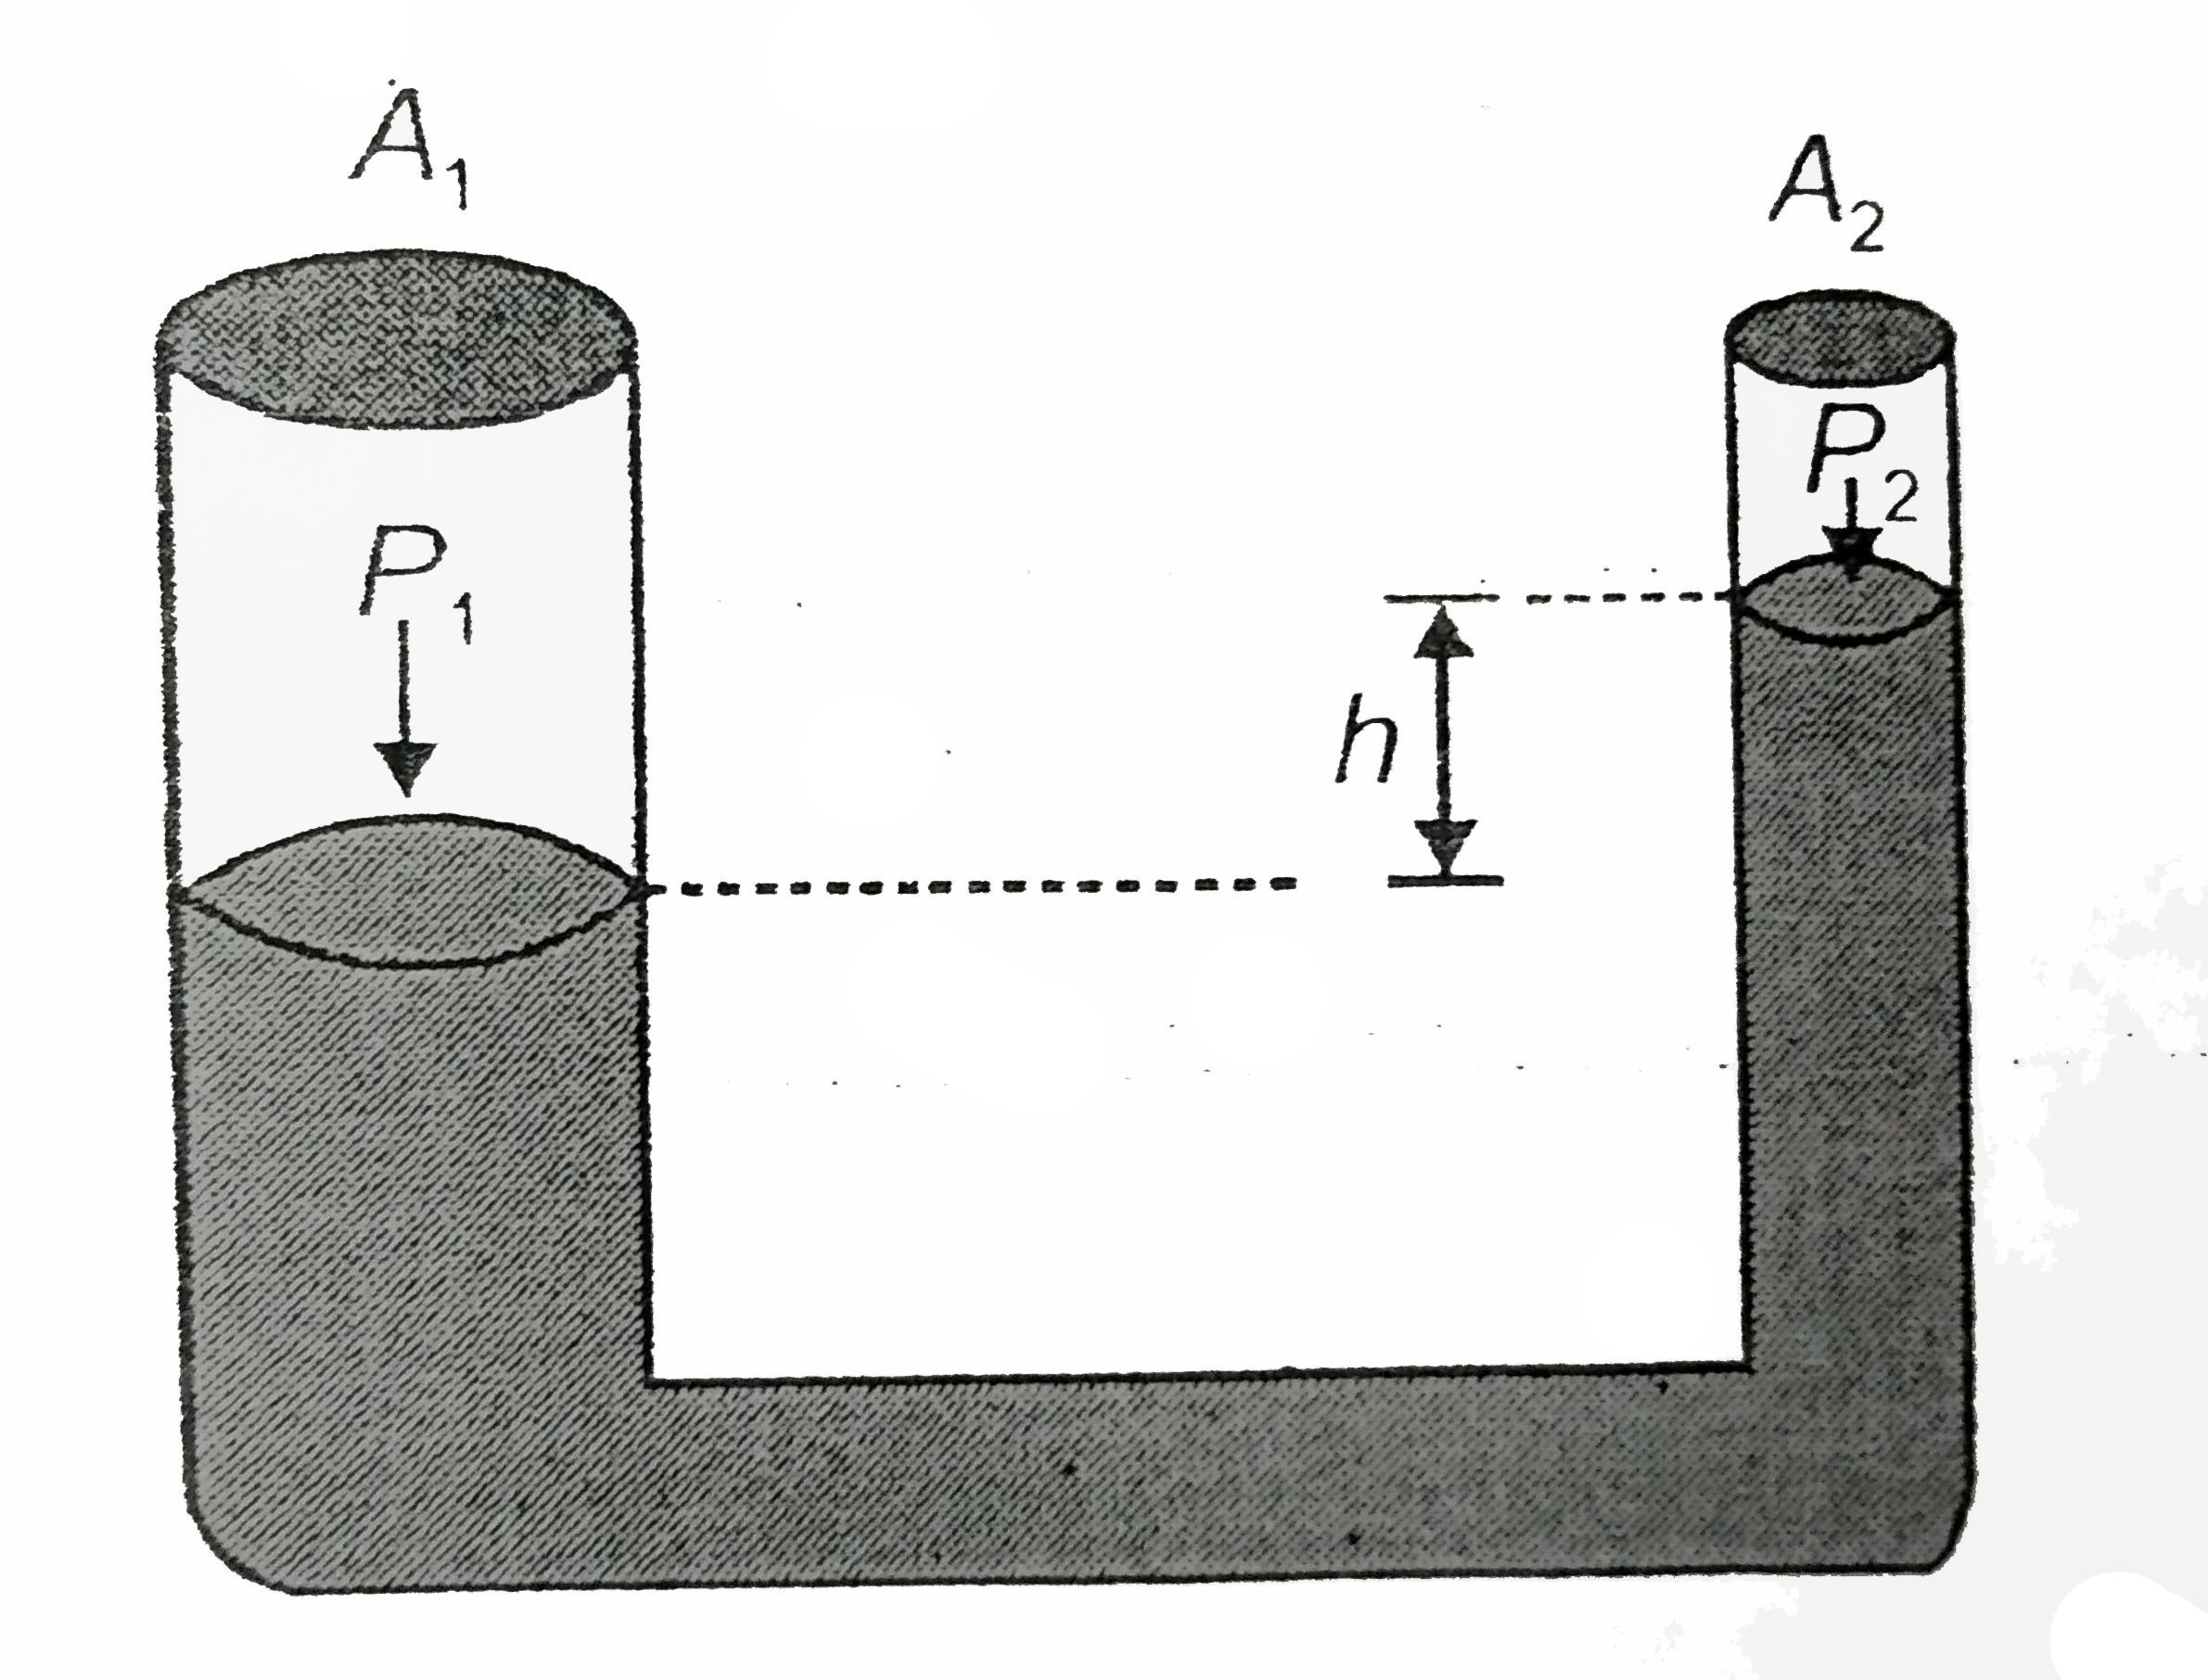
In the adjoing figure P1andP2 are the pressures in broad and narrow tubes with closed ends. Select the correct option
 View Solution
The temperature of a gas in a vessel changes depending on whether the vessel is open or closed, and so does the diffusion coefficient. The temperature dependence of the diffusion coefficient D for both cases is shown in the figure on the log-log scale. Which line corresponds to the case of an open vessel and which to the case of a closed vessel? The effective cross sections of the molecules are assumed to be constant
View Solution
Knowledge Check
- Question 1 - Select One
In these figures, two life-cycles are described. Mark the correct option.
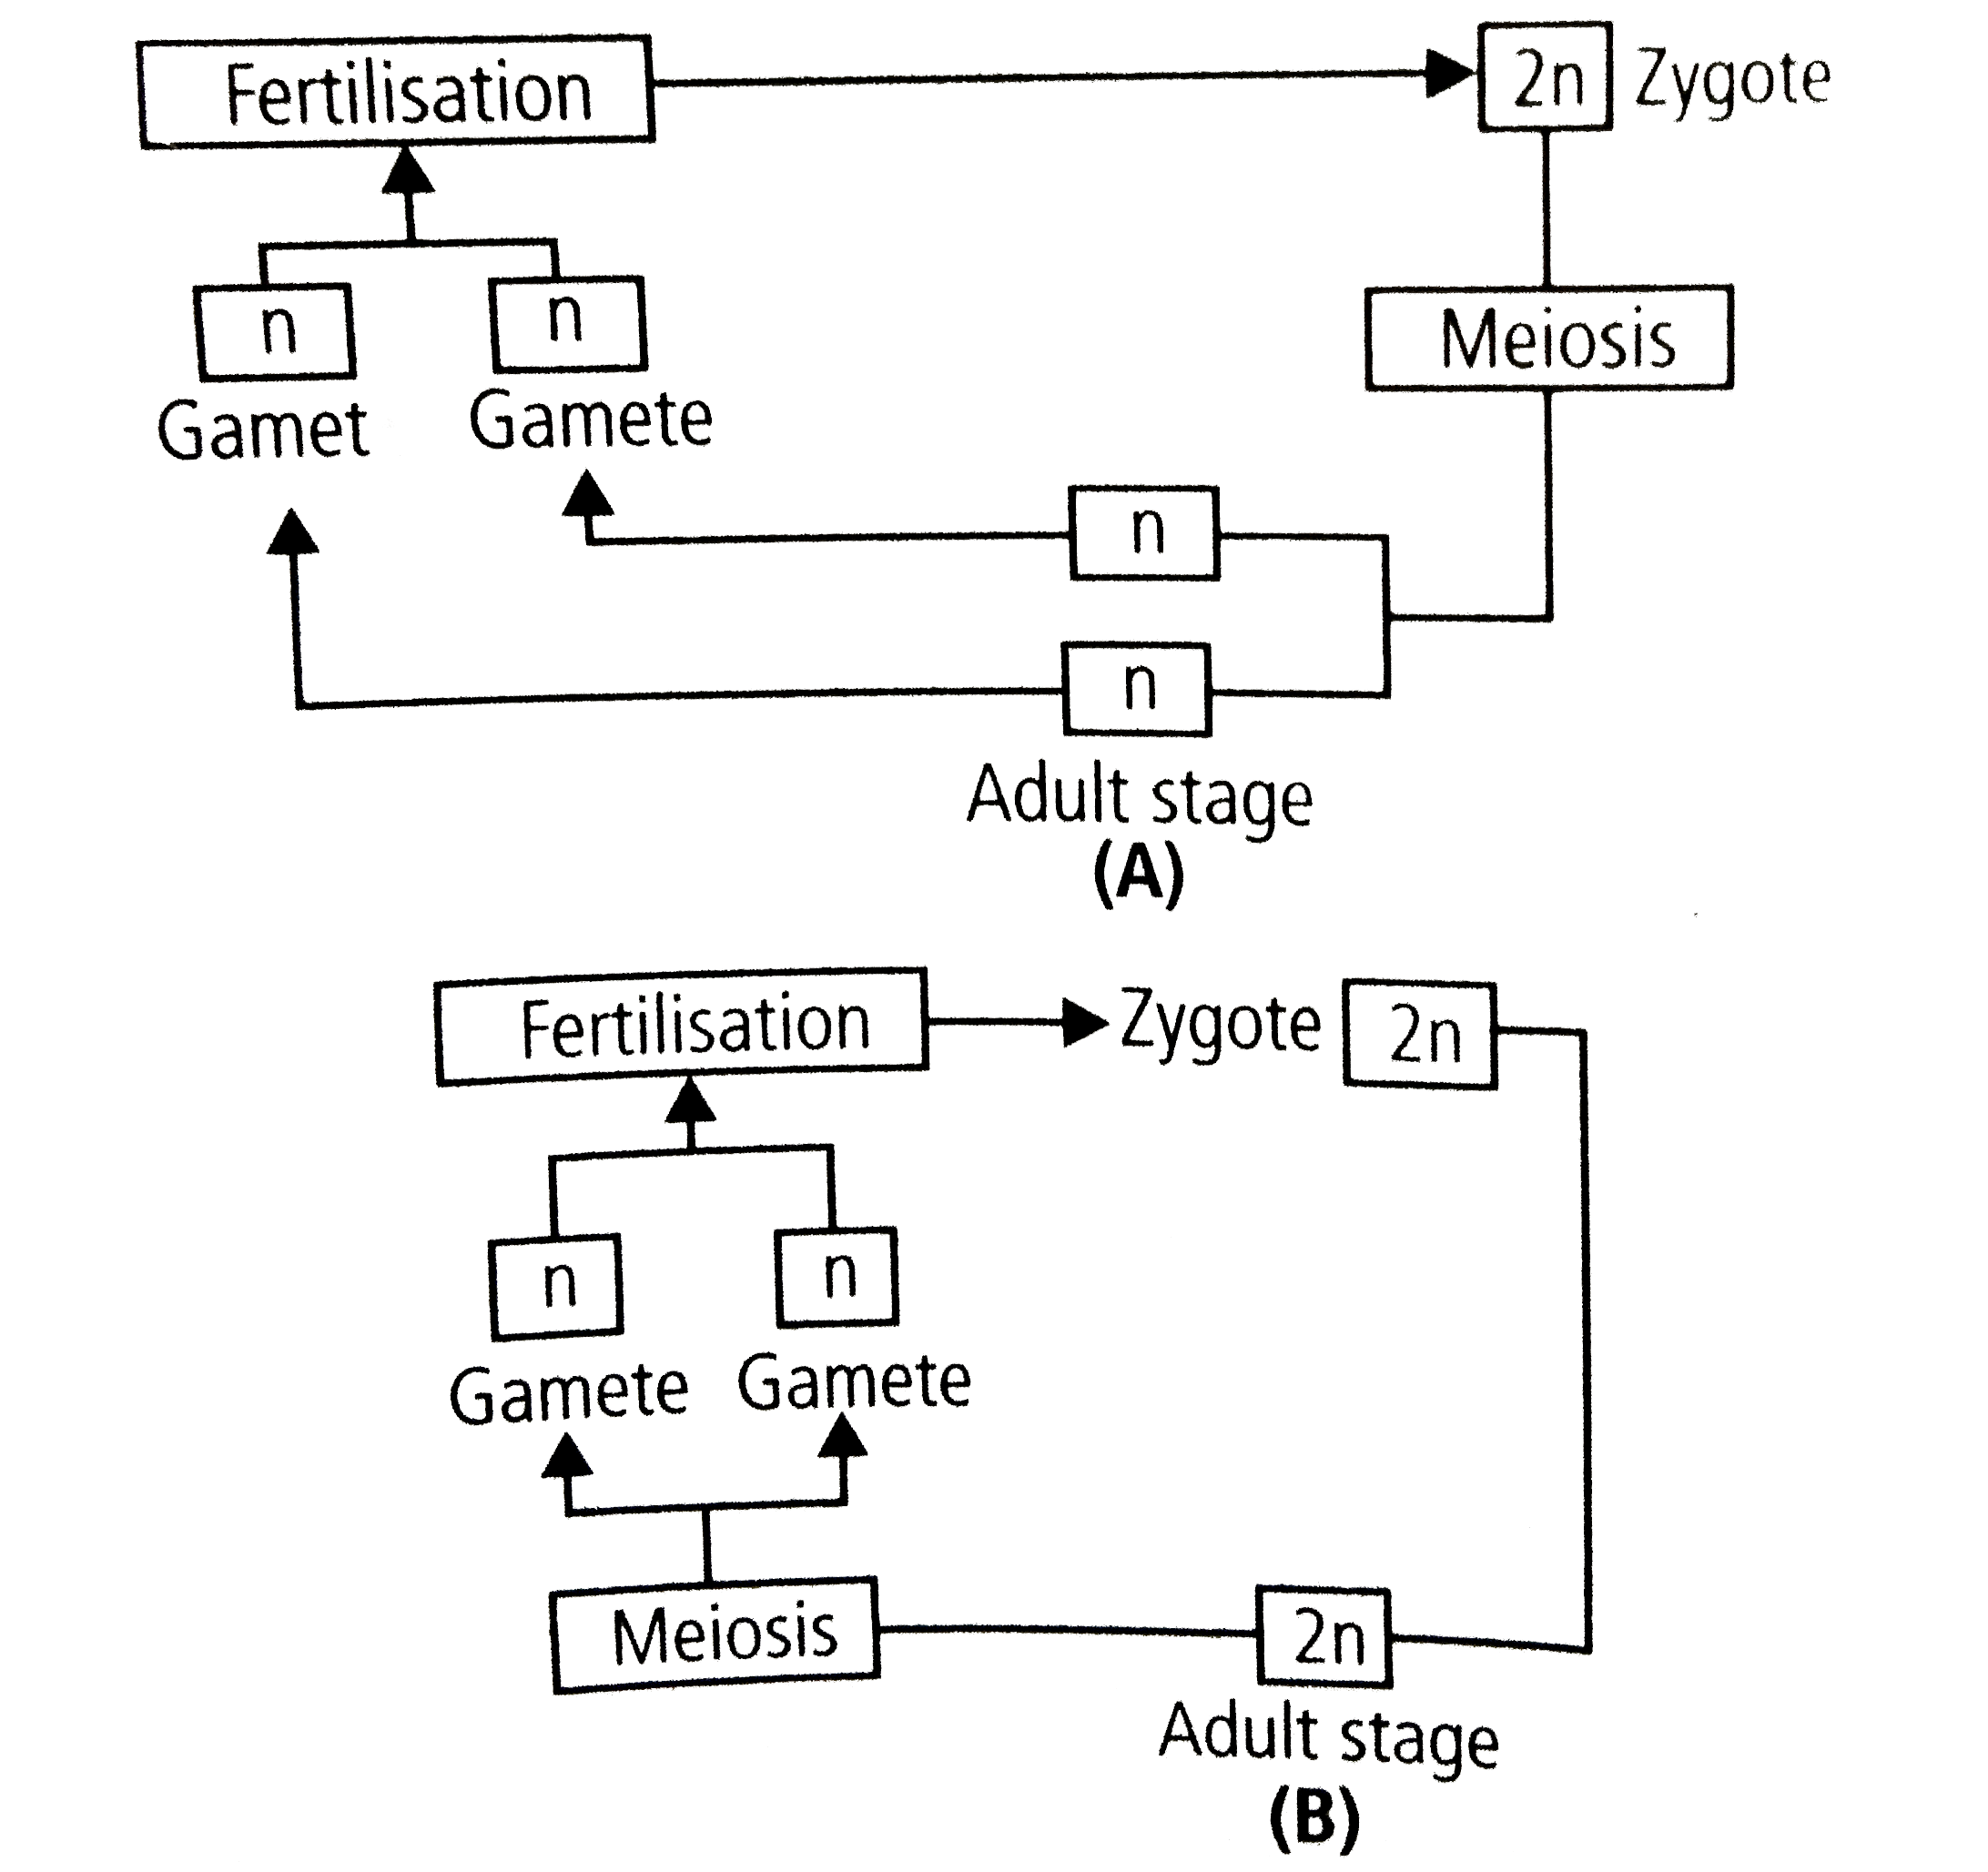 AA represents primitive life forms and B represents more advnced life forms.BA represents terrestrial life forms and B represents aquatic life forms.CA rrepresents asexual reproduction and B represents sexual reproduction.DBoth flow charts basically represent the same life-cycle.
 - Question 2 - Select One
The correct figure representing isothermal and adiabatic compression of an ideal gas from the same initial state is:
A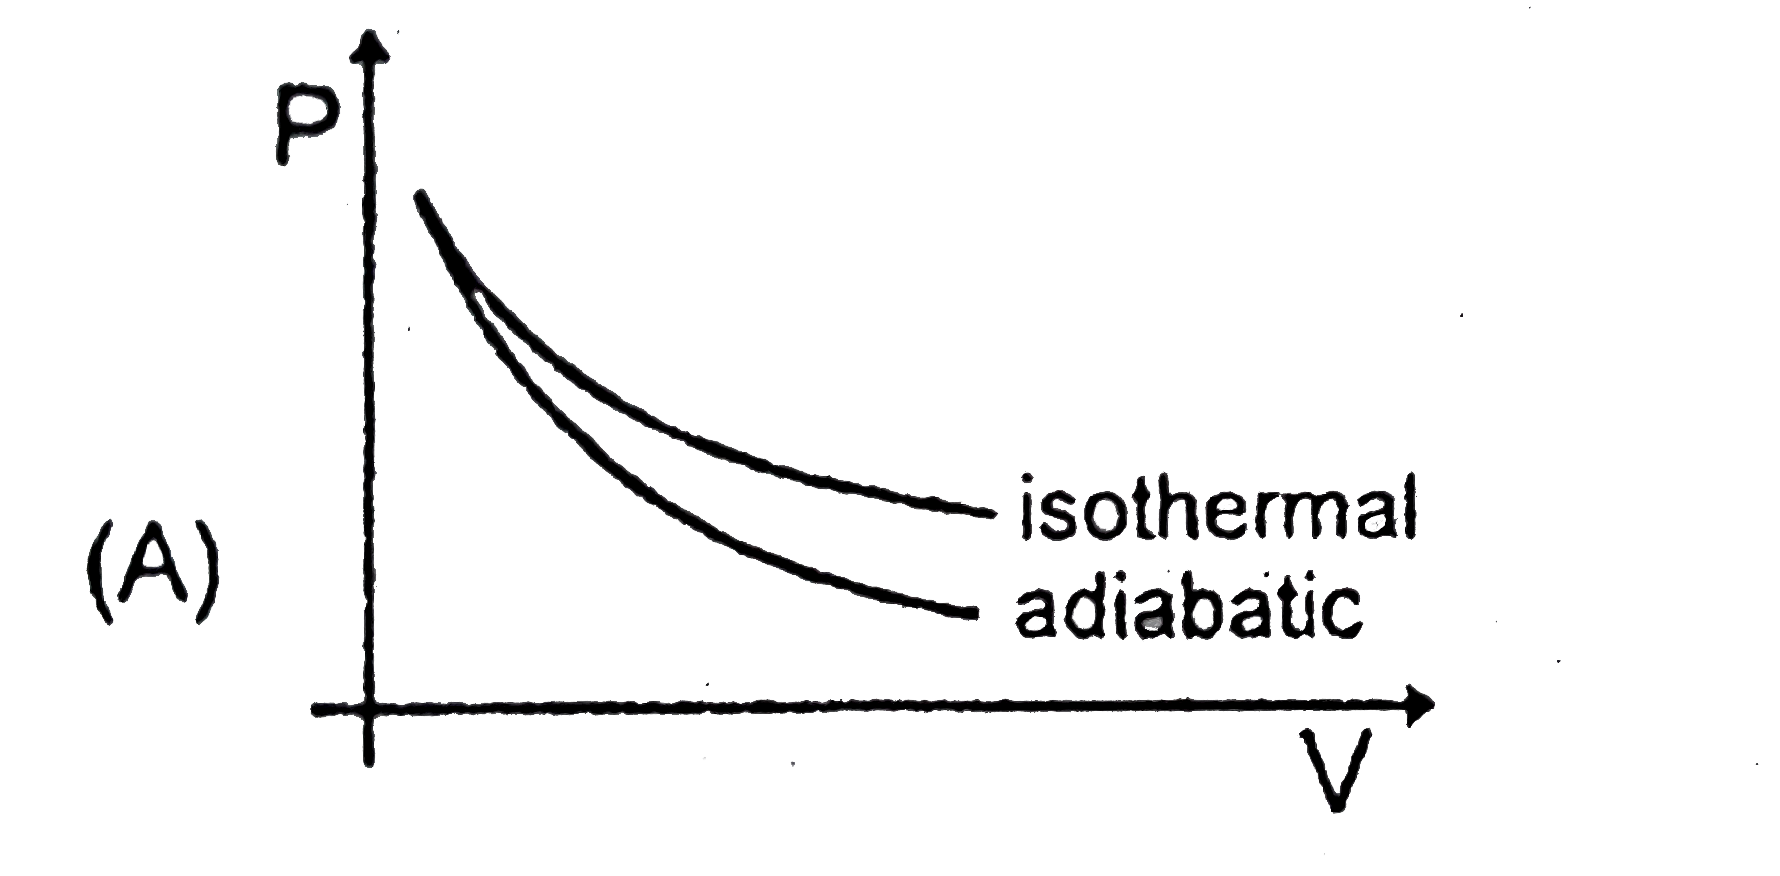 B
B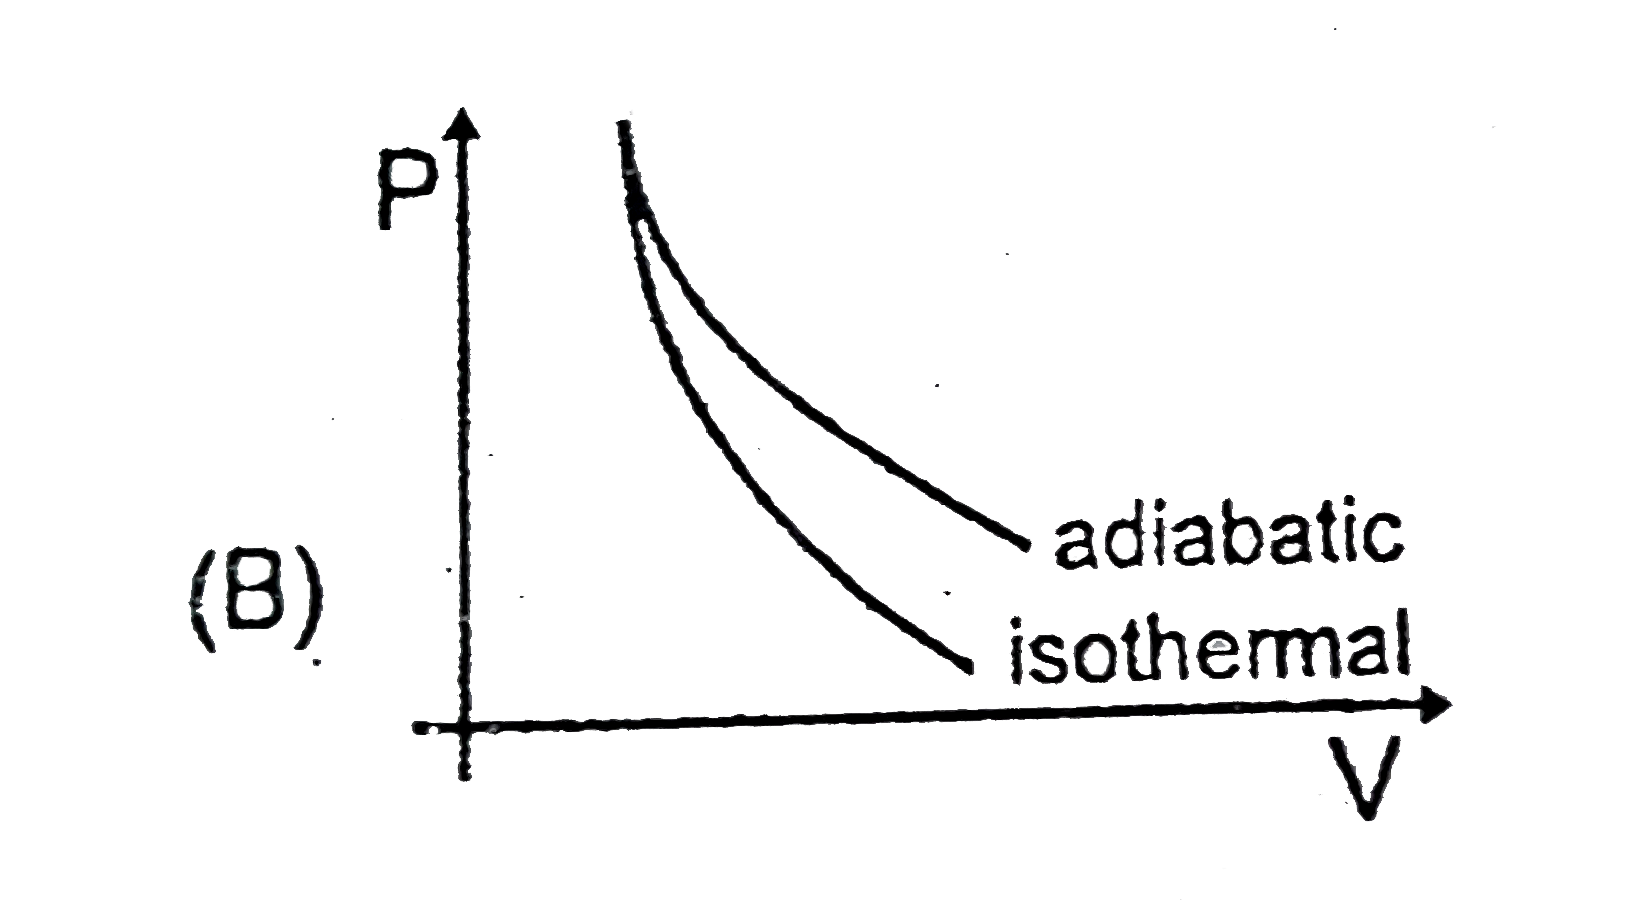 C
C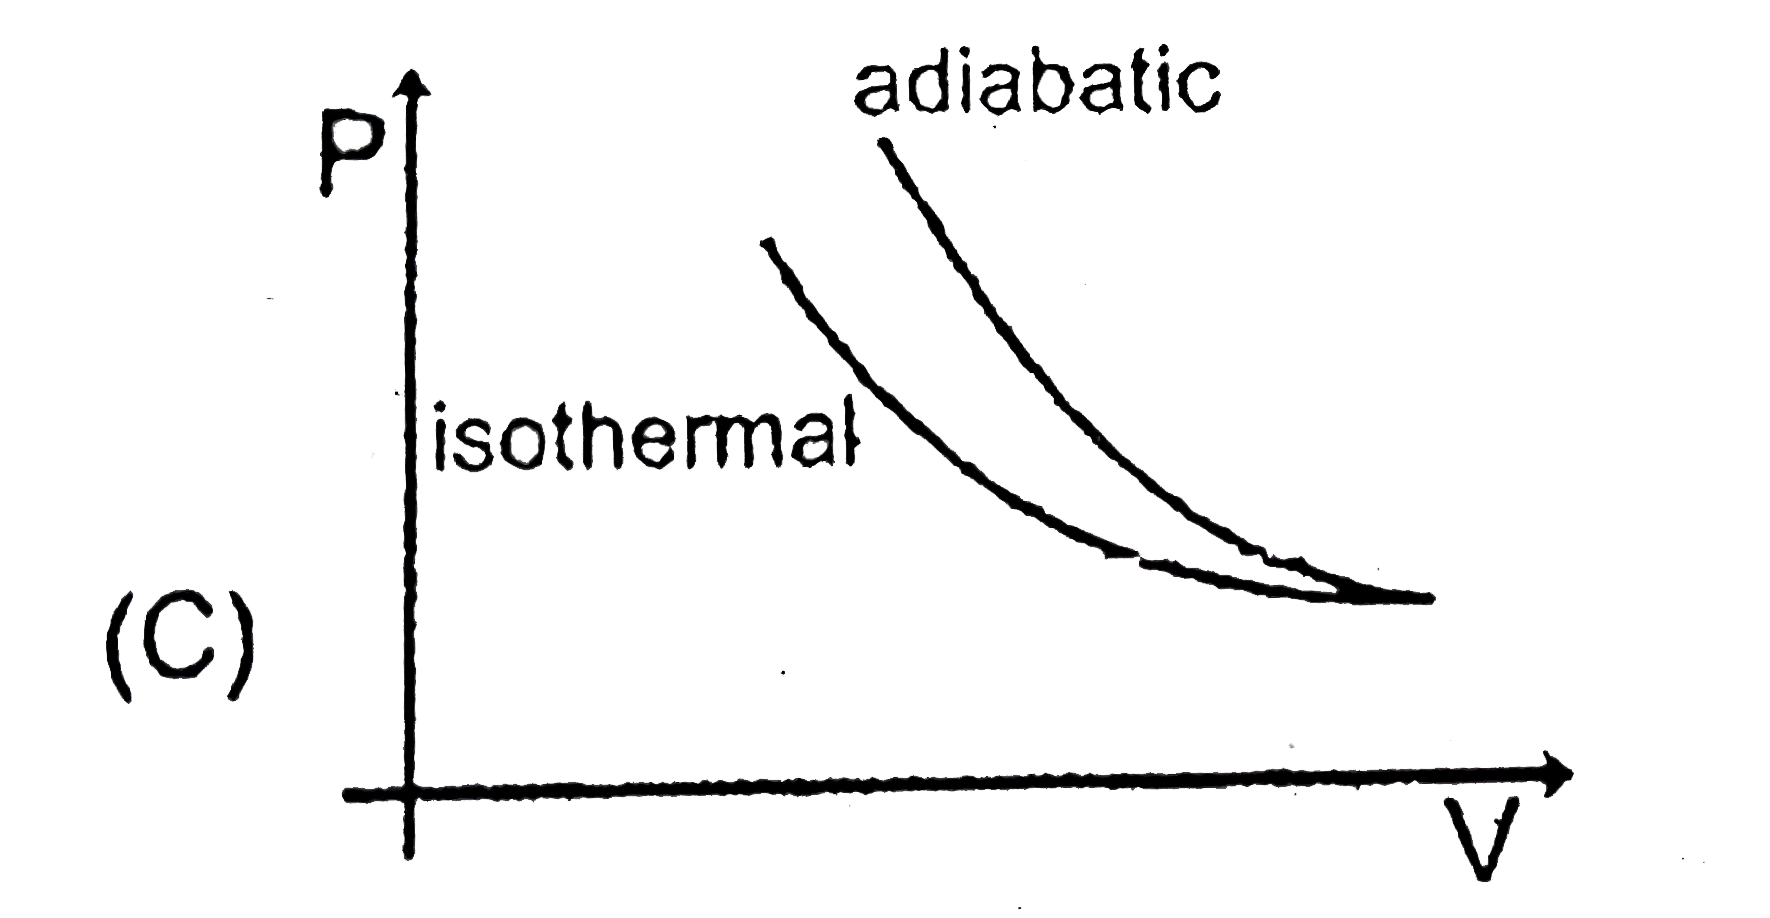 D
D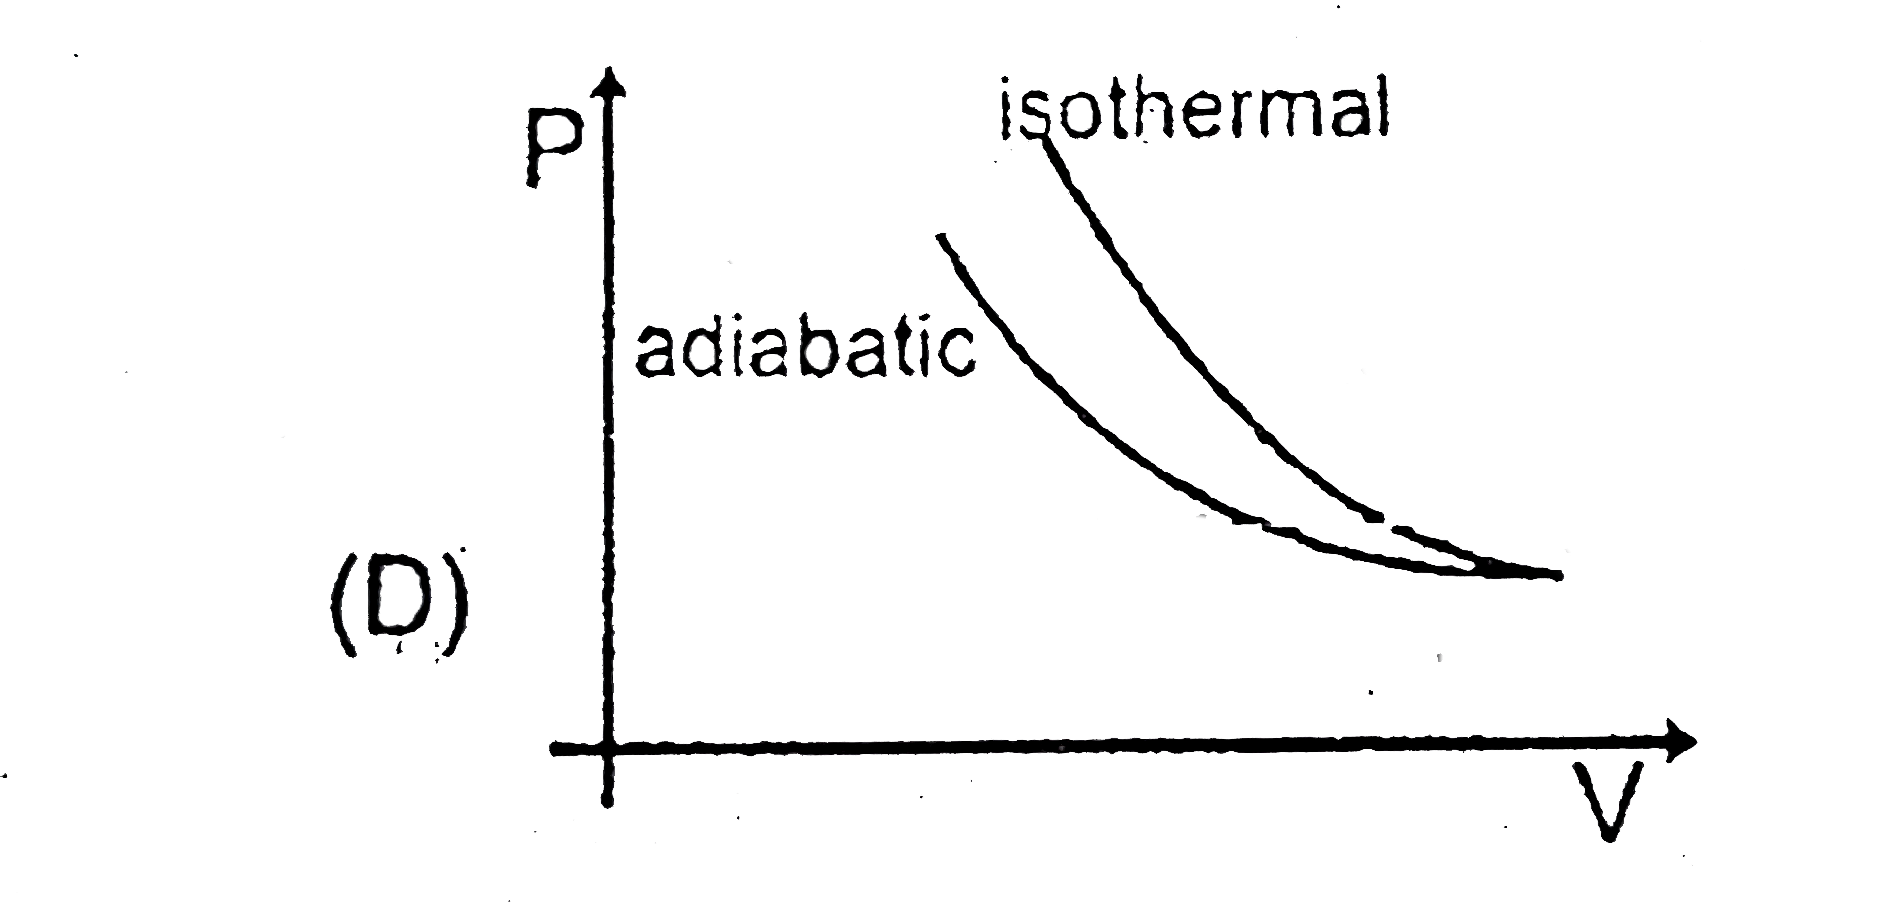
- Question 3 - Select One
Argon gas is adiabatically compressed to half its volume. If P,V and T represent the pressure, volume and temperature of the gasous, respectively, at any stage, then the correct equation representing the process is
ATV2/5= constantBTV5/3= constantCTP2/5= constantDPT2/5= constant
Assertion (A) : k=Ae−Ea/RT, the Arrhenius equation represents the dependence of rate constant with temperature.
Reason (R ): Plot of log.k against 1/T is linear and the activation energy can be calculated with this plot.View SolutionWhich of the following graph correctly represents variation of P vs V for two gases CH4 and SO3 subjected to reversible adiabatic compression from same initial condition. (Assume that vibrational degrees of freedom are not active.)
View SolutionFigure shows the adiabatic curve on log-log scale performed on a ideal gas. The gas must be:-
_S01_085_Q01.png) View Solution
View SolutionThe given figure represent the V.S. of bulbs of Allium cepa identify the different parts and select the correct options
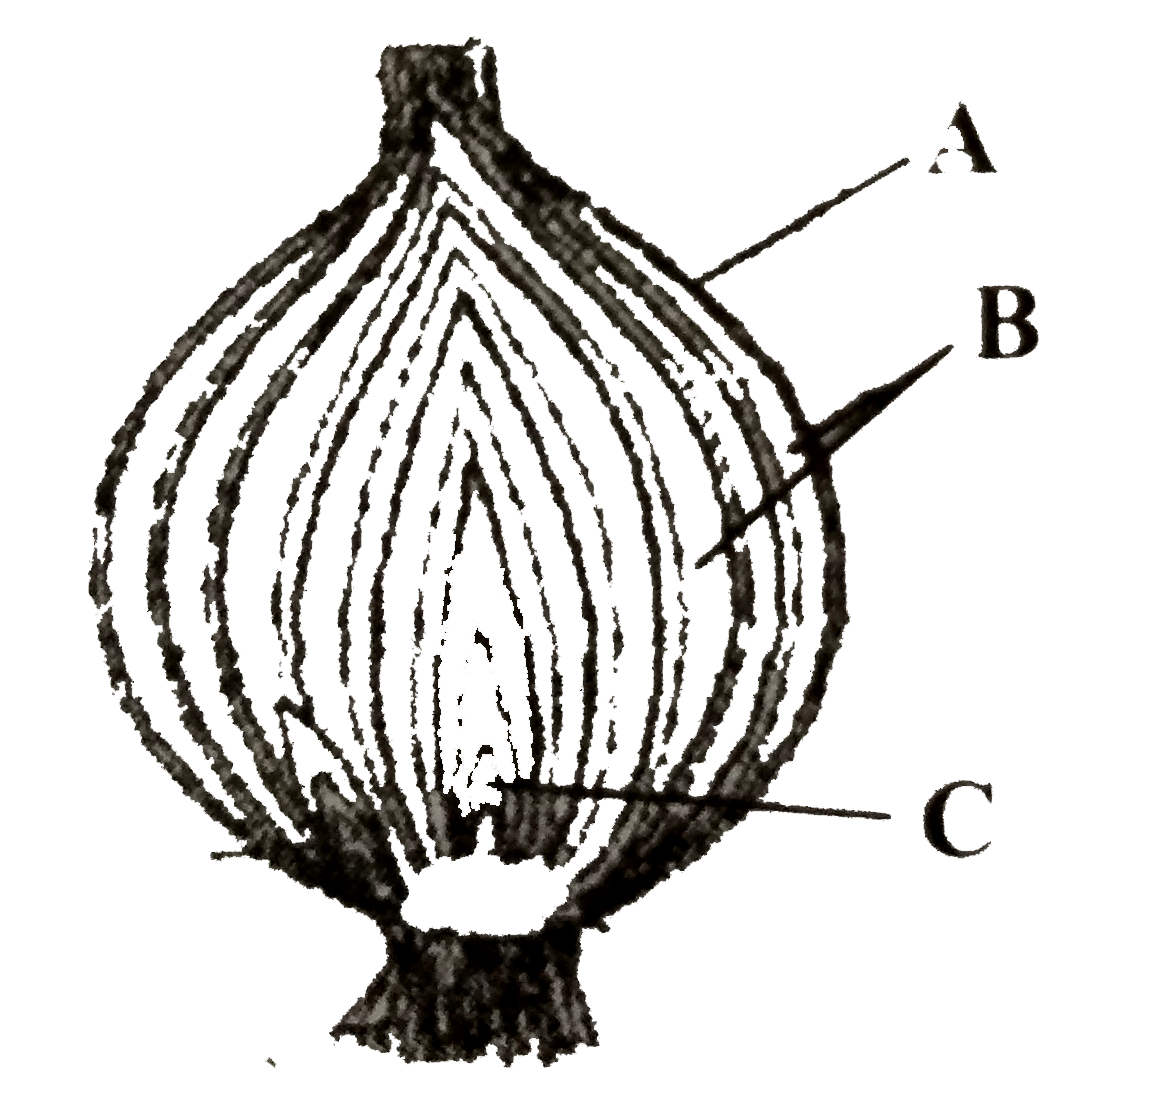 View Solution
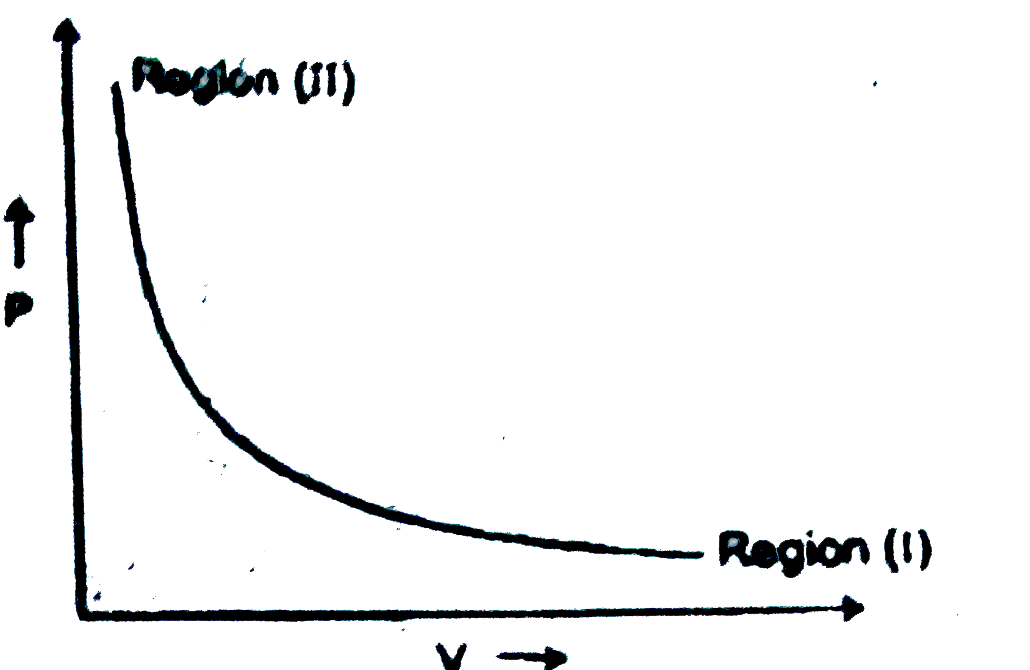
Following graph represents a pressure (P) volume (V) relationship at a fixed temperature (T) for n moles of a real gas. The graph has two regions marked (I) and (II). Which of the following options is true.
 View Solution

