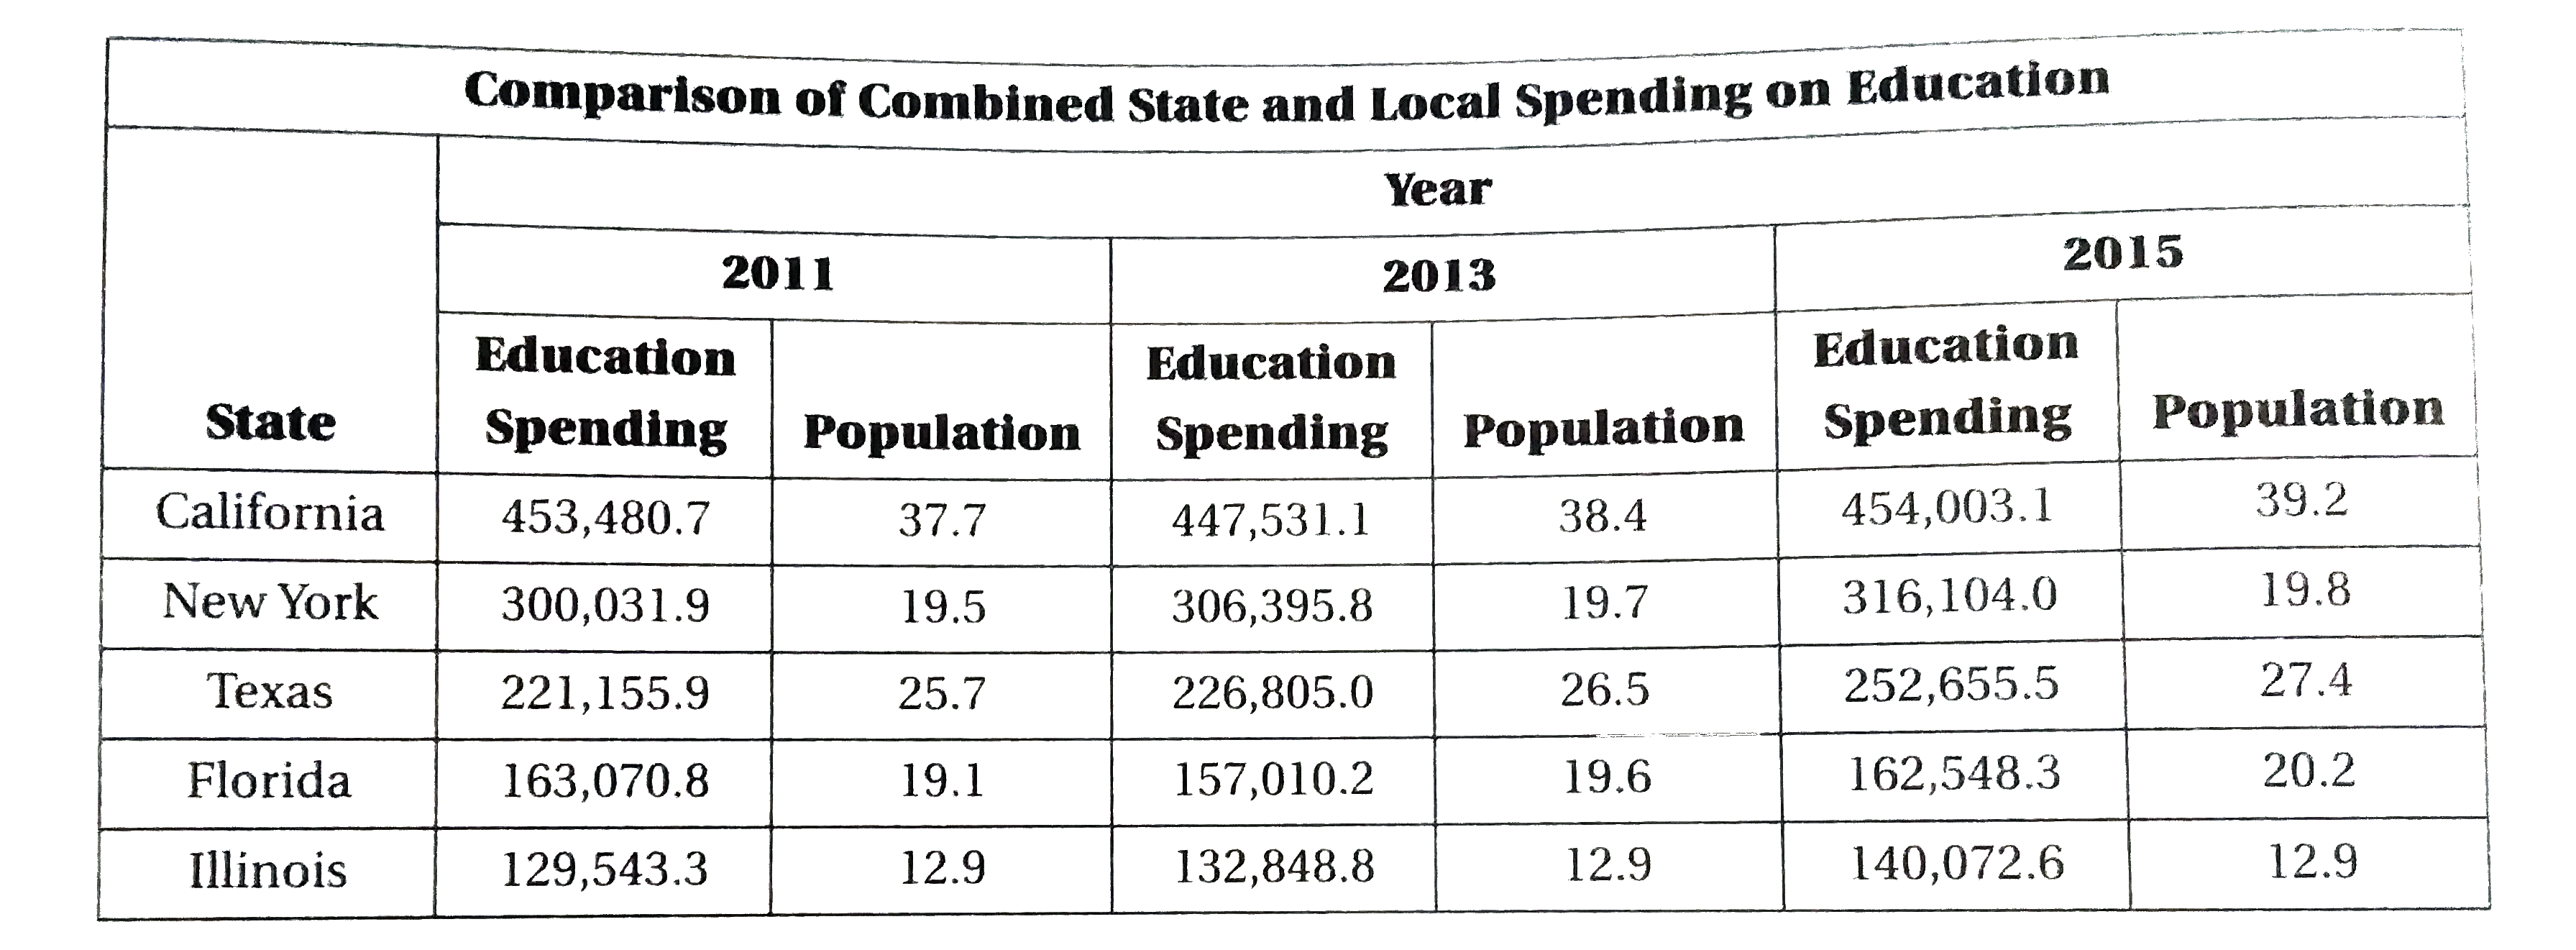
Question 16 and 17 refer to the above table, that shows the population (in millions) and education spending (in millions) and by state for each of the states listed for the years 2011, 2013, and 2015.
Q. Which of the following best approximates the average rate of change in education spending in Texas from 2011 to 2015?
3.2 billion per year
6.3 billion per year
10.5 per year
7.9 billion per year
The correct Answer is:D
Step by step video, text & image solution for Question 16 and 17 refer to the above table, that shows the population (in millions) and education spending (in millions) and by state for each of the states listed for the years 2011, 2013, and 2015. Q. Which of the following best approximates the average rate of change in education spending in Texas from 2011 to 2015? by Maths experts to help you in doubts & scoring excellent marks in Class 12 exams.
Topper's Solved these Questions
Similar Questions
743 children from the United States, aged 6 through 11, were tested to see if they were overweight . The data are shown in the table below.
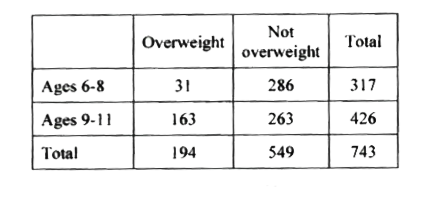
In 2014 the total population of children between 6 and 11 years old, inclusive , in the United States was about 74.3 million. If the test results are used to estimate information about children across the country, which of the following is the best estimate of the total number of children between 9 and 11 years old in the United States who were overweight in 2014 ?View SolutionQuestion 37 and 38 refer to the following information
The U.S. federal Government tracks the Consumer Price Index (CPI)- a comprehensive standard used to estimate the average price change for the typical goods and services purchased by consumers. This measure gives economics a useful way to estimate the rates of the inflation or deflation, which reflects the respective general increase or decrease of prices of goods and services in the economy. The accompanying tables summarizes the changes in the CPI for the years 2005 through 2014, which can be assumed to be the corresponding percent rates of inflation.
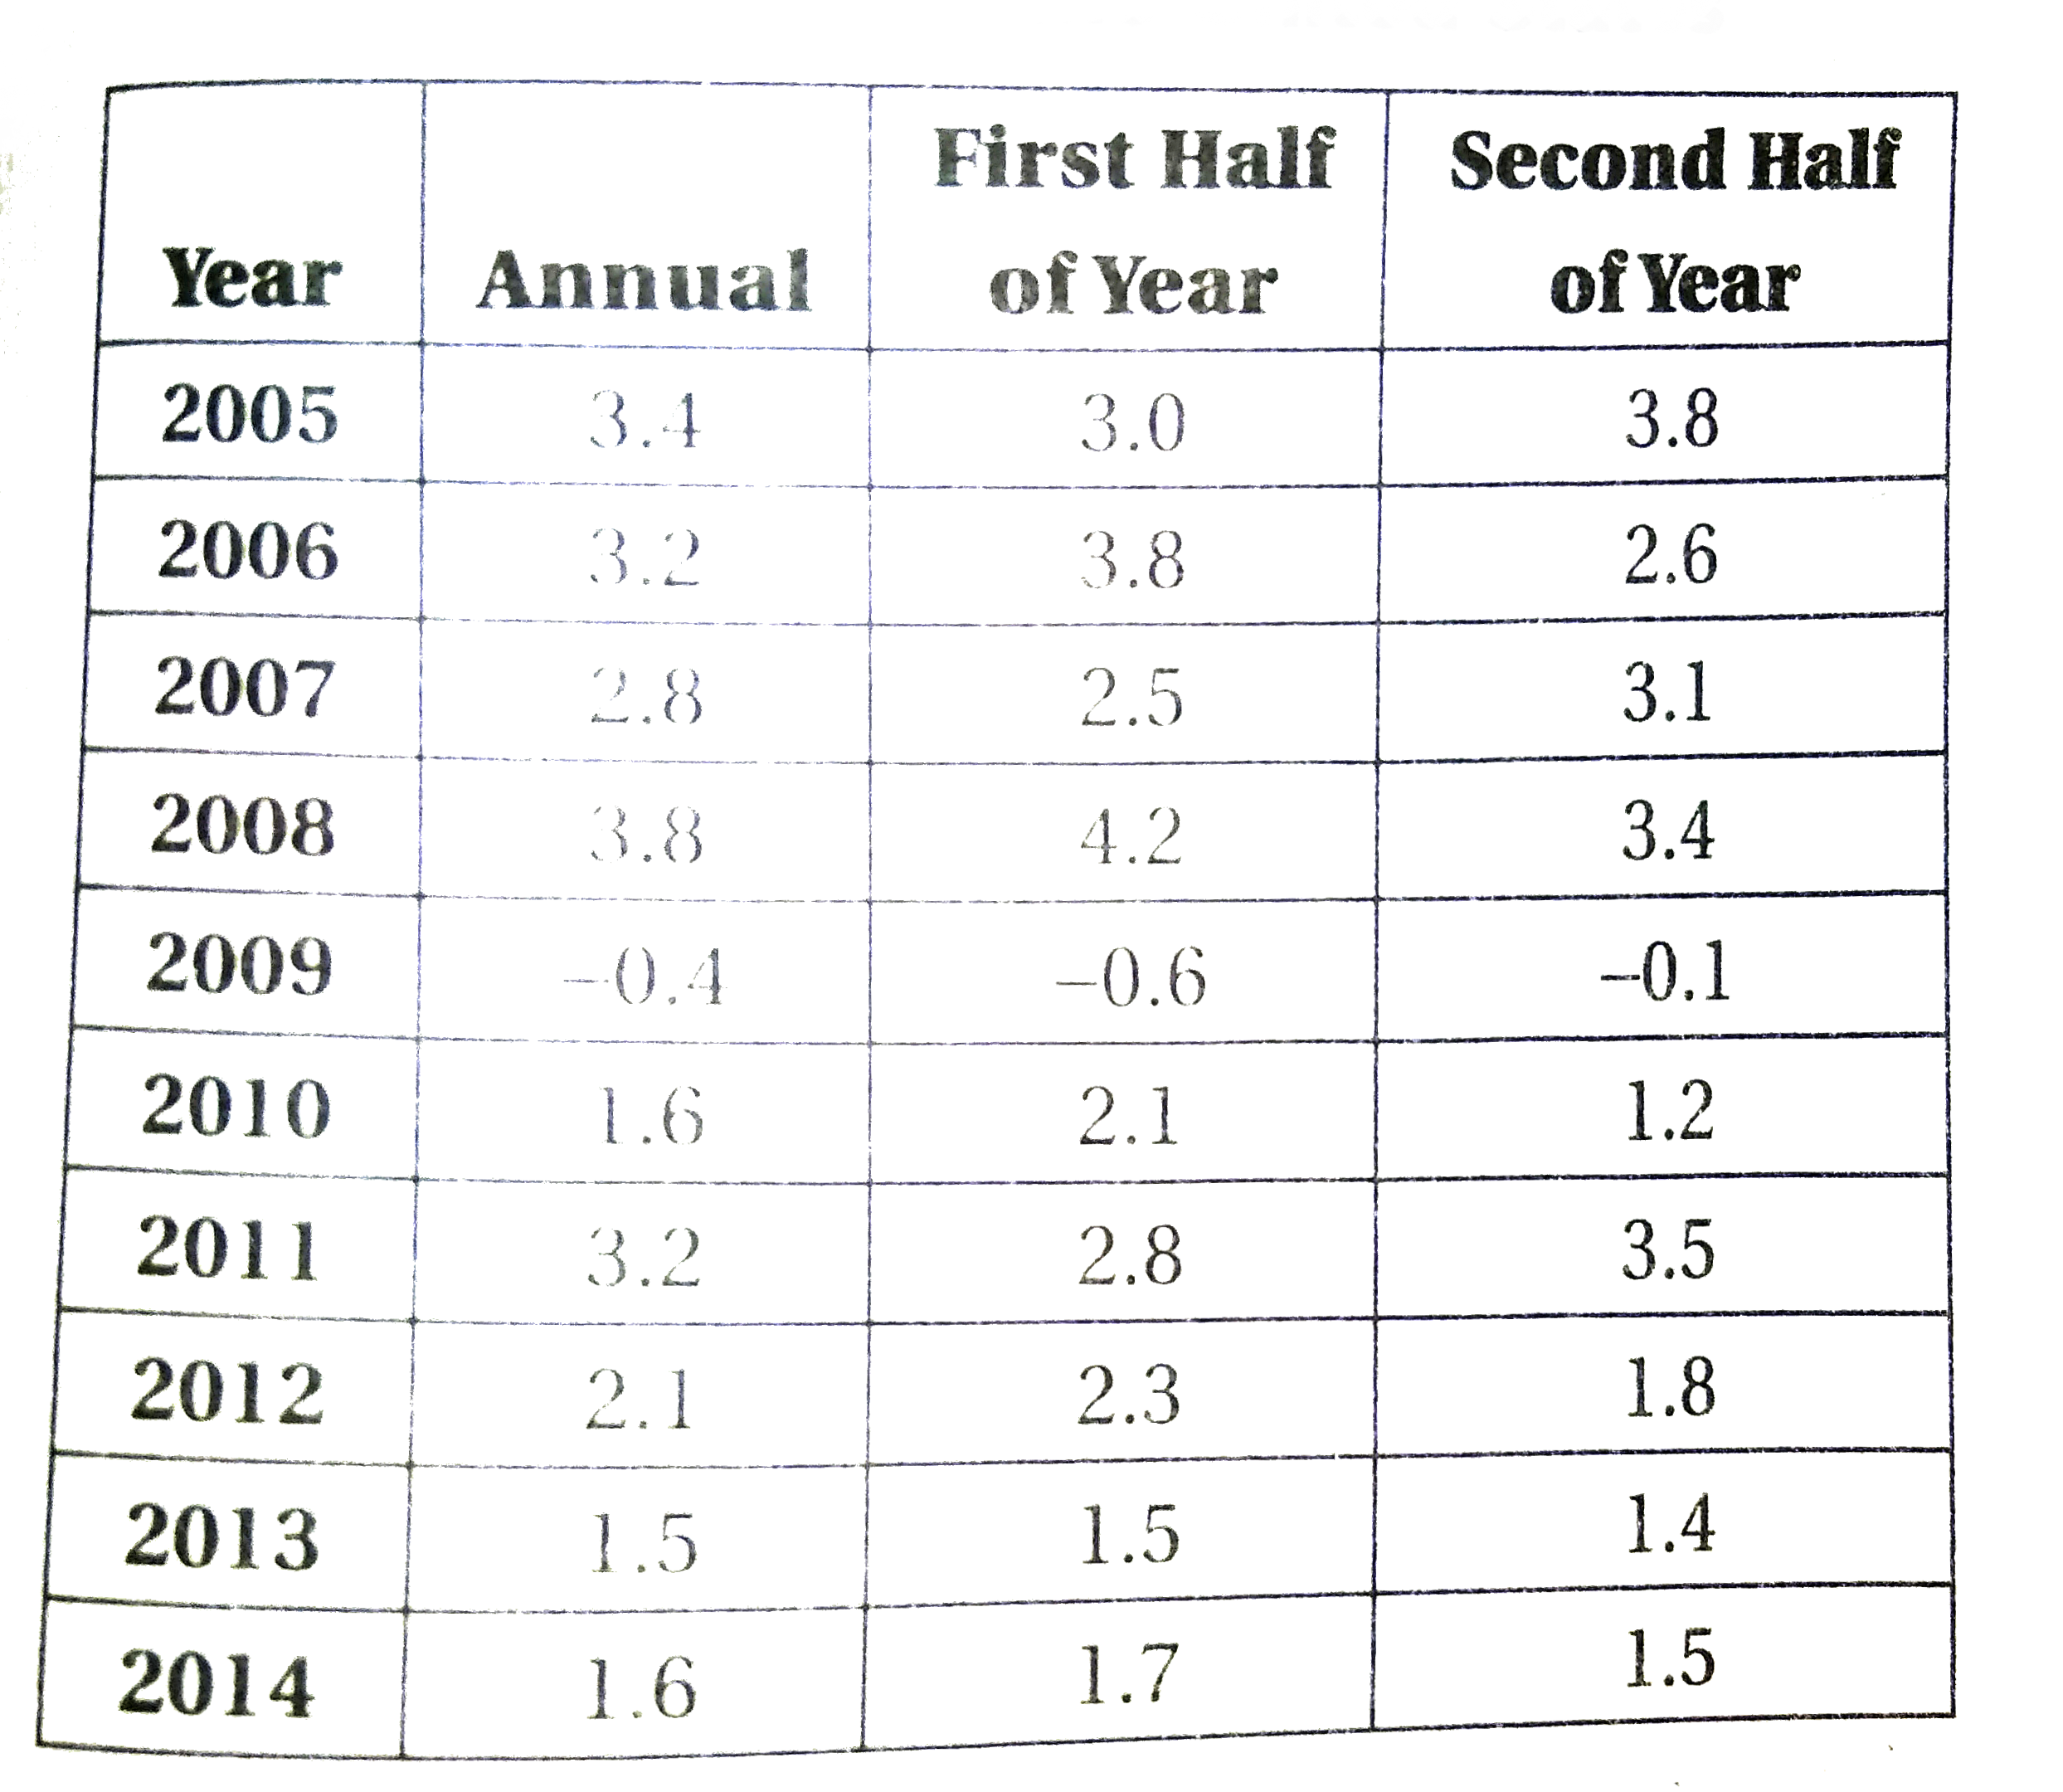
Q. At a beginning of 2015, a retired person is shopping for a retirement annunity, which is an investment policy that will give him fixed monthly payments for the rest of his life. He would like the amount of his annuity payments to more than keep up with the rate of inflation. He decides that he will choose a policy that issuse payments that increase annually at a rate of that is at least 1.5% greater than the average yearly compounded rate of inflation calculated from the period that extends from the second half of 2005 through the first half of 2008. What should be the minimum annual rate of increase in his monthly annuity payments, correct to the nearest tenth?View Solution
Knowledge Check
- Question 1 - Select One

Question 16 and 17 refer to the above table, that shows the population (in millions) and education spending (in millions) and by state for each of the states listed for the years 2011, 2013, and 2015.
Q. Based on the data in the table,which of the following must be true?
I. In 2015 per capita (per person) spending on education inn illinois was greater than per capita spending on education in Texas.
II. Per capita spending on education in Florida declined in 2015 compared to 2011 spending.
III. California had the highest per capita spending in education for each year.AI and II onlyBI and III onlyCII and III onlyDI, II, and III - Question 2 - Select One
Annual Budgets for Different Programs in Kansas, 2007 to 2010
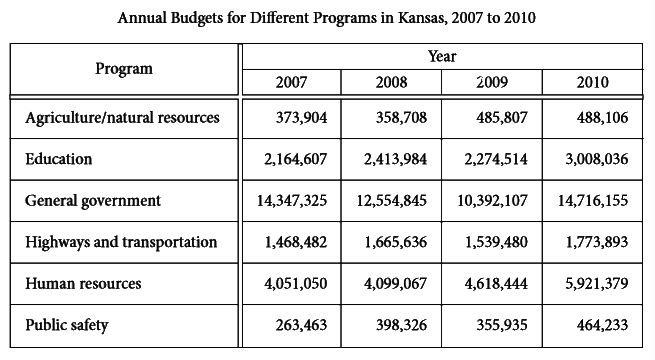
The table above lists the annual budget, in thousands of dollars, for each of six different state programs in Kansas from 2007 to 2010.
Which of the following best approximates the average rate of change in the annual budget for agriculture/natural resources in Kansas from 2008 to 2010 ?A$50,000,000 per yearB$65,000,000 per yearC$75,000,000 per yearD$130,000,000 per year - Question 3 - Select One
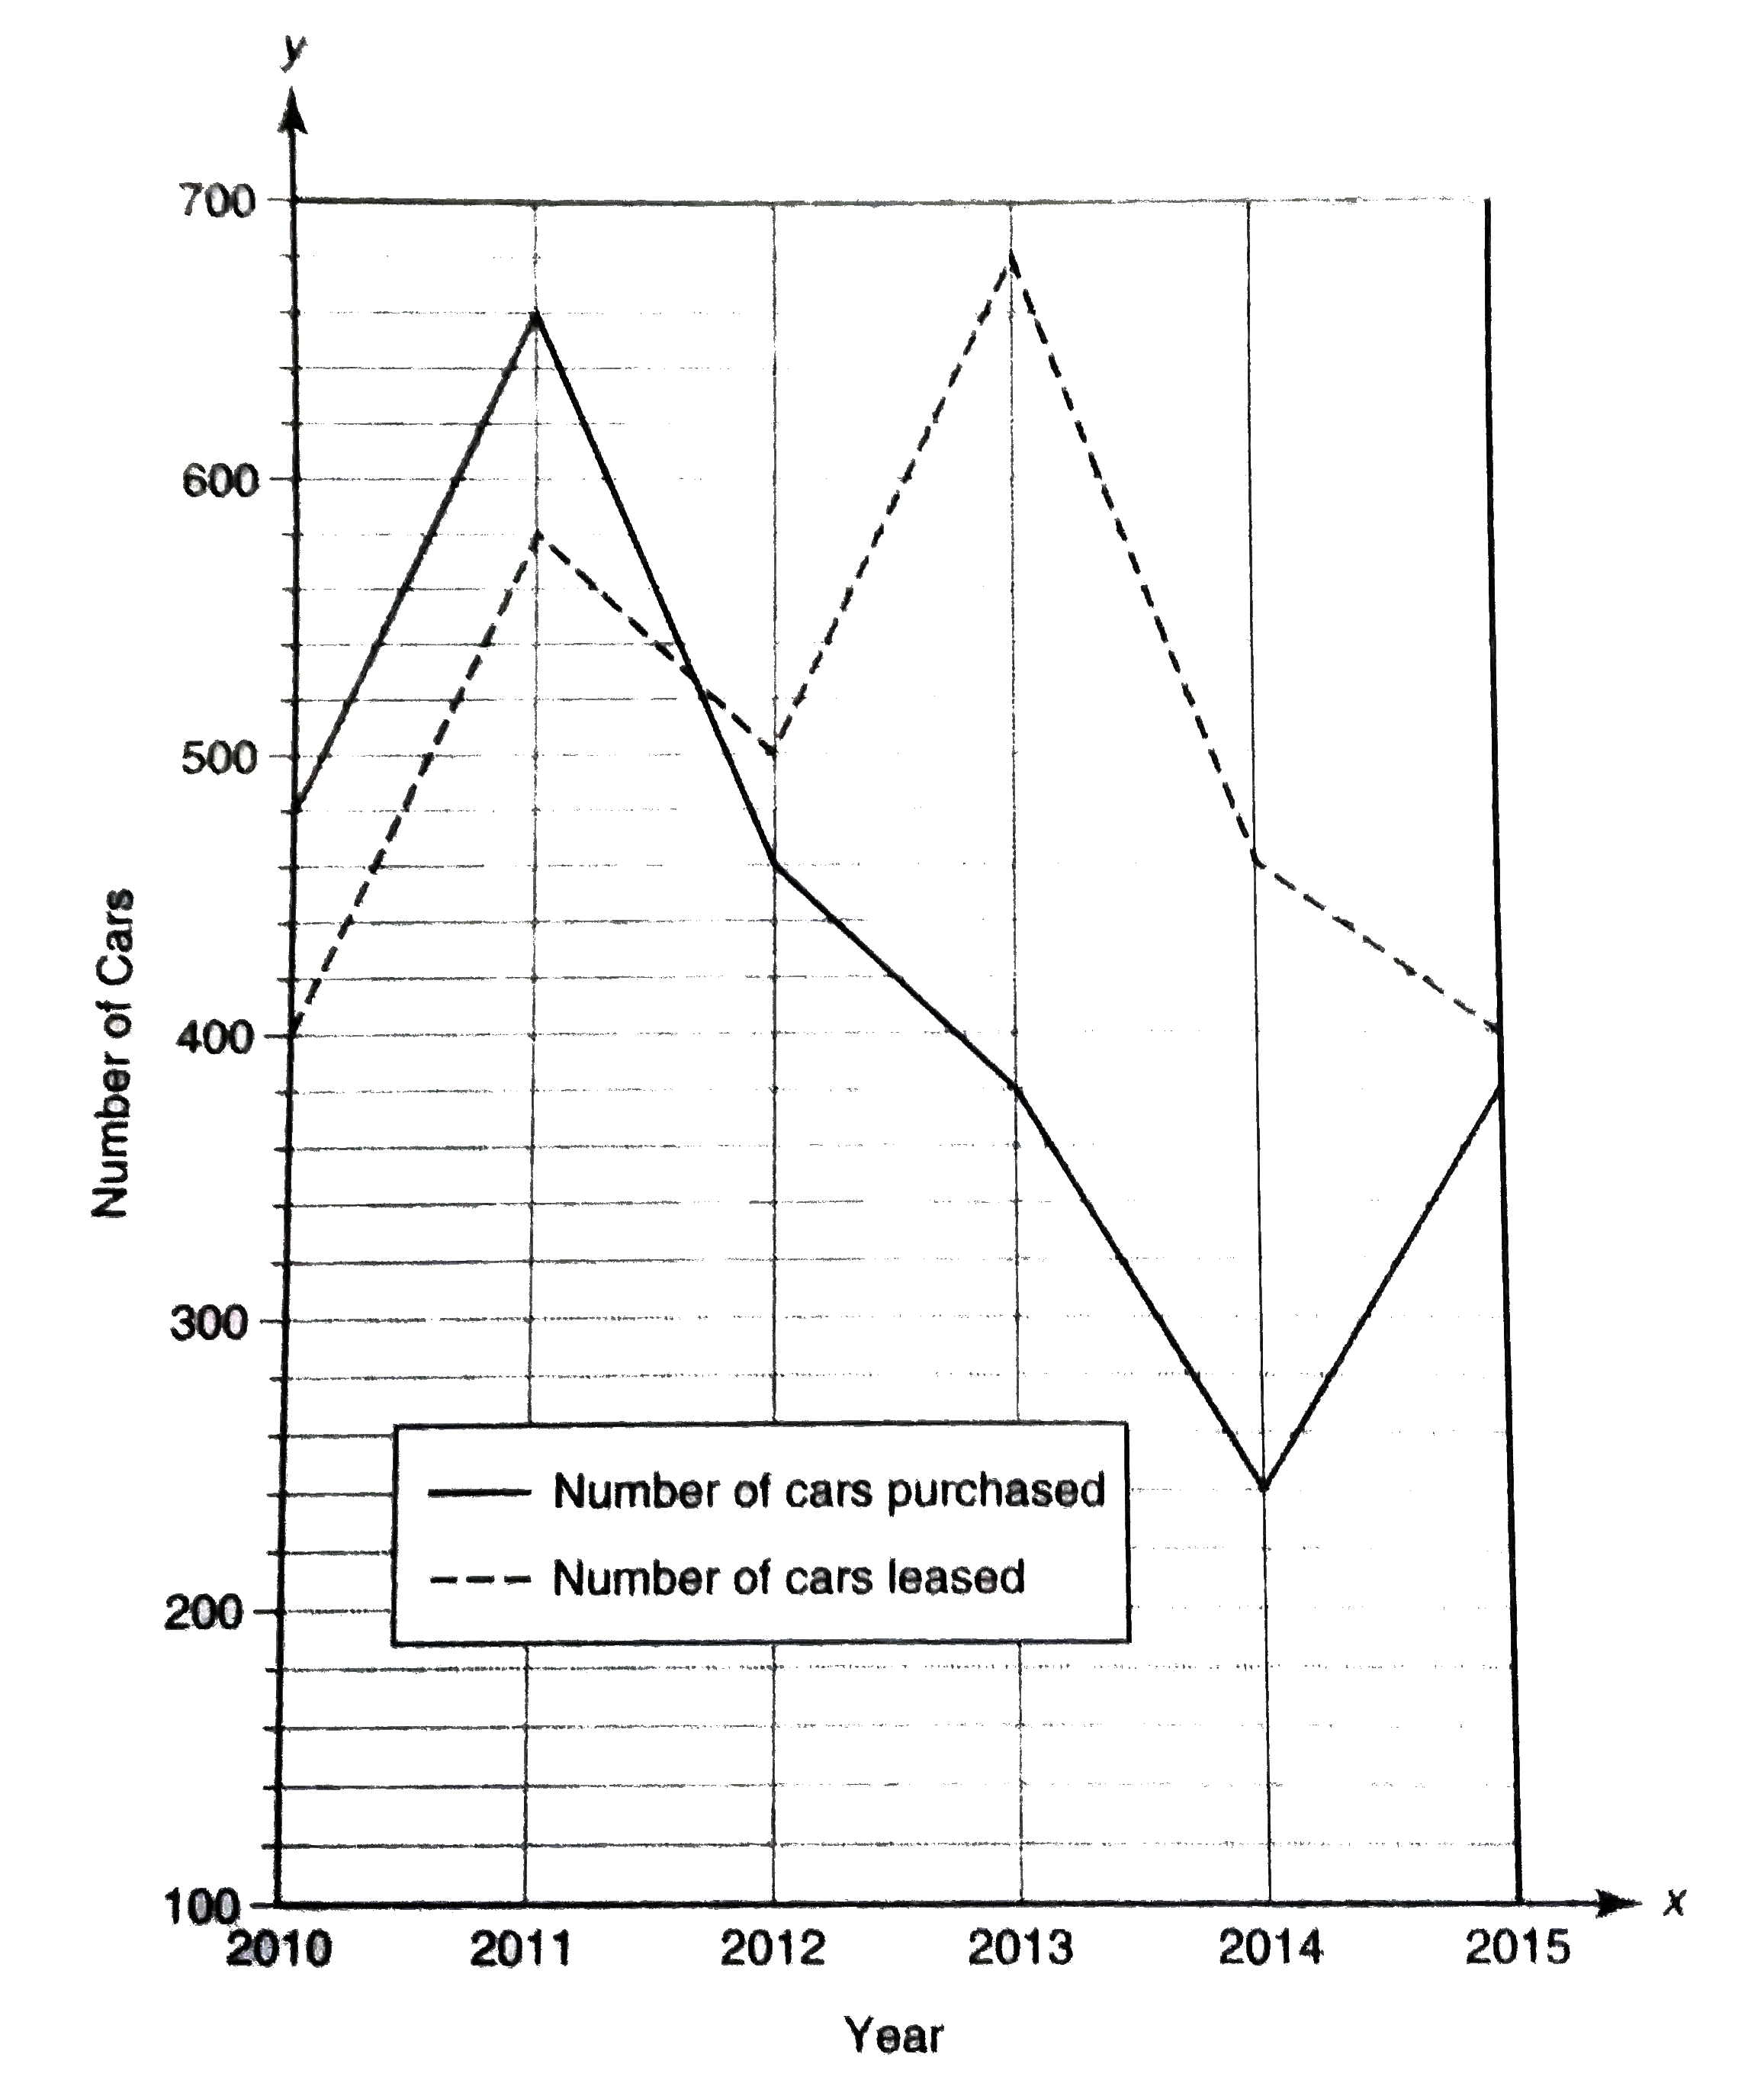
Question 11 and 12 refer to the gaph above.
Q. Which of the following is the best approximation for the decrease in the number of cars purchased per year between 2011 and 2014?A105B140C300D420
Question 37 and 38 refer to the following information
The U.S. federal Government tracks the Consumer Price Index (CPI)- a comprehensive standard used to estimate the average price change for the typical goods and services purchased by consumers. This measure gives economics a useful way to estimate the rates of the inflation or deflation, which reflects the respective general increase or decrease of prices of goods and services in the economy. The accompanying tables summarizes the changes in the CPI for the years 2005 through 2014, which can be assumed to be the corresponding percent rates of inflation.

Q. An economist purchases a kitchen applience at the beginning of 2014 for $3,000. The sales person advises him that the only changes in prices for the applience since the beginning of 2012 have been due to inflation. Assuming that is the case, what would have been the purchase price for the applience at the beginning of 2012 correct to the nearest dollars?View Solution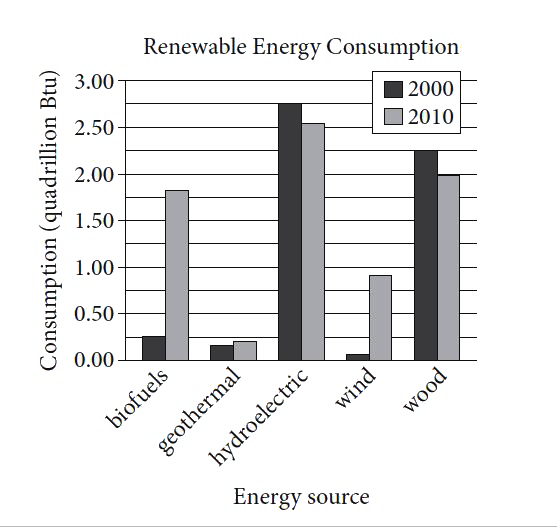
The bar graph above shows renewable energy consumption in quadrillions of British thermal units (Btu) in the United States, by energy source, for several energy sources in the years 2000 and 2010.
Of the following, which best approximates the percent decrease in consumption of wood power in the United States from 2000 to 2010 ?View Solution(##KPL_SAT_PRD_PLS_C09_E01_001_Q01.png" width="80%">
The scatterplot shows the prevalence of obesity plotted against the prevalence of diabetes in various ares of the United States. Which of the following best estimates the average rate of change in the prevalence of diabetes as comared to the prevalence of obesity ?View SolutionThe most significant way in which man differs from animals is in the use of written symbols. Alphabets can, therefore, be considered the most momentous invention in the ascent of man. The use of words enables man to master time by preserving for the posterity the best that is seen, experienced or done. The birth of the civilisation was conceived in the making of the alphabet. The knowledge of the alphabet is the first step in the education of man and is central to the whole concept of elementary education. There is an inextricable link between education and progress. South Korea and Afghanistanı provide glaring instances of progressive prosperity and decline through education and lack of education respectively. Education enables people to acquire a greater control over their destiny. Farmers in India, who ushered in the Green Revolution, could do so only after they learned about the high yield of hybrid varieties of wheat and pest resistant varieties of rice. Perhaps, the greatest use of education and knowledge has been made in the field of health and nutrition. Until recently, millions of people died every year, in tropical and sub-tropical countries of the globe, of diarrhoea. However, when they were educated that the simple solution of water sugar and salt can save people from this fatal disease, mortality rate substantially declined. The use of iodized salt has arrested the incidence of goitre throughout the world. A comparative study of the progress of different States in India firmly establishes the mutual dependence of education and development. The infant mortality rate is the lowest in the highly literate state of Kerala, It is very high in low literacy state of Uttar Pradesh. Child mortality fails as mothers leam. Female literacy is, therefore, of the utmost importance in India. Basic information about health and nutrition form an essential part of elementary education. It has been observed that educated mothers are not only able to raise healthier children by following the best and latest child rearing practices, they are also more open to use of contraceptive and mare capable of limiting the number of children. The States of Uttar Pradesh and Bihar are witnessing a population explosion, as they are very slow in removing illiteracy whereas Kerala and Tamil Nadu have been successful in curbing the growth of population through the spread of literacy and creation of awareness about effective methods of contraception. A new dimension has been added to the programme of universalisation of elementary education in India by public interest litigation (PIL) filed by S.P. Anand in the Supreme Court. This PIL seeks to enforce the right to education by obtaining a commitment from all the states and union territories of India that every child will have free and compulsory education till the age of fourteen, as was promised in the Directive Principles of State Policy, as enshrined in the Indian Constitution. Expansion in Primary education and quality improvement of higher education should be adopted as twin aims of our education policy if our country has to join the select group of enlightened and advanced nations.
Hybrid:View SolutionThe most significant way in which man differs from animals is in the use of written symbols. Alphabets can, therefore, be considered the most momentous invention in the ascent of man. The use of words enables man to master time by preserving for the posterity the best that is seen, experienced or done. The birth of the civilisation was conceived in the making of the alphabet. The knowledge of the alphabet is the first step in the education of man and is central to the whole concept of elementary education. There is an inextricable link between education and progress. South Korea and Afghanistanı provide glaring instances of progressive prosperity and decline through education and lack of education respectively. Education enables people to acquire a greater control over their destiny. Farmers in India, who ushered in the Green Revolution, could do so only after they learned about the high yield of hybrid varieties of wheat and pest resistant varieties of rice. Perhaps, the greatest use of education and knowledge has been made in the field of health and nutrition. Until recently, millions of people died every year, in tropical and sub-tropical countries of the globe, of diarrhoea. However, when they were educated that the simple solution of water sugar and salt can save people from this fatal disease, mortality rate substantially declined. The use of iodized salt has arrested the incidence of goitre throughout the world. A comparative study of the progress of different States in India firmly establishes the mutual dependence of education and development. The infant mortality rate is the lowest in the highly literate state of Kerala, It is very high in low literacy state of Uttar Pradesh. Child mortality fails as mothers leam. Female literacy is, therefore, of the utmost importance in India. Basic information about health and nutrition form an essential part of elementary education. It has been observed that educated mothers are not only able to raise healthier children by following the best and latest child rearing practices, they are also more open to use of contraceptive and mare capable of limiting the number of children. The States of Uttar Pradesh and Bihar are witnessing a population explosion, as they are very slow in removing illiteracy whereas Kerala and Tamil Nadu have been successful in curbing the growth of population through the spread of literacy and creation of awareness about effective methods of contraception. A new dimension has been added to the programme of universalisation of elementary education in India by public interest litigation (PIL) filed by S.P. Anand in the Supreme Court. This PIL seeks to enforce the right to education by obtaining a commitment from all the states and union territories of India that every child will have free and compulsory education till the age of fourteen, as was promised in the Directive Principles of State Policy, as enshrined in the Indian Constitution. Expansion in Primary education and quality improvement of higher education should be adopted as twin aims of our education policy if our country has to join the select group of enlightened and advanced nations.
Master:View Solution
